NG bulish View Ng i am bulish for next few week. all level mention on chart . my view are only for learning purpose. do not advice to trade.
Search in ideas for "ng"
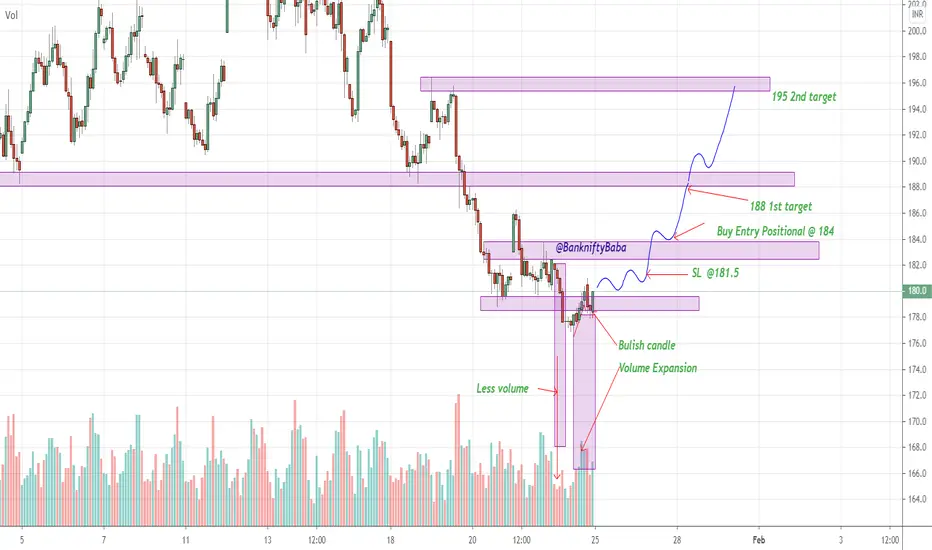


Ng fut CMP188.6 buying range 185.5 -183 Targets 189- 191- 193.5Ng fut CMP188.6 buying range 185.5 -183
Targets 189- 191- 193.5- 196+

Ng fut CMP 122.2 buy for target 123.5-125-126-128-130+Ng fut CMP 122.2 buy for target 123.5-125-126-128-130+


NGits corrective wave now a is going to complete around 250 and then it heading toward B around 500 in upcoming months and then C but c is lesser than B so this summer Ng touch 150

NG Longafter fall NG given buy at 645, enjoy
after fall NG given buy at 645, enjoyafter fall NG given buy at 645, enjoy
after fall NG given buy at 645, enjoy

NG MCX May Future Weekly Technical Analysis 29 Apr-3 May📊 NG MCX Future Technical Chart Analysis
📅 29 May Future
🎯 Range Point: 160.50
🎯 Weekly Range: 33.60
📉 Buy Above: 154.36
📉 Average At: 150.40
🎯 Buy Target 1: 181.26
🎯 Buy Target 2: 194.10
🛑 Buyer Stoploss: 143.16
📉 Sale Below: 146.44
🎯 Sale Target 1: 139.74
🎯 Sale Target 2: 126.90
🛑 Seller Stoploss: 157.64
Don't forget to reciprocate your love by boosting, following and responding, your actions fuel my efforts to do even better for you!
"NG MCX Future Technical Chart Analysis26 April Future#NG #NaturalGas #GasPrices #NatGas #EnergyTrading #MCX #CommoditiesFutures #CommoditiesOptions

NG MCX Future Intraday Technical Chart Analysis 17 Sept., 24📈 NG MCX Future Intraday Technical Chart Analysis
📅 Date: 17th September, 2024
📊 Range Trigger Point: 199.40
📉 Day Range: 10.70
🟢 Buy Above: 197.21
💼 Average Position: 195.95
🎯 Buy Target 1: 206.01
🎯 Buy Target 2: 210.10
🔵 Stoploss: 193.64
🔴 Sell Below: 194.69
🎯 Sell Target 1: 192.79
🎯 Sell Target 2: 188.70
🔵 Stoploss: 198.26
✨ Boost, follow, and engage for more detailed insights. Your support helps us bring you the latest and most accurate updates! 🚀❤️
#NaturalGas #NG #MCX #TradingSignals #Intraday #TradingTips #Commodities #EnergyTrading

NG (XNGUSD) Weekly Technical Chart Analysis 09-13 Sept., 24📈 NG (XNGUSD) Weekly Technical Chart Analysis
📅 Date: 09-13 Sept., 2024
📊 Range Trigger Point: 2.45
📉 Weekly Range: 0.25
🟢 Buy Above: 2.37
💼 Average Position: 2.34
🎯 Buy Target 1: 2.61
🎯 Buy Target 2: 2.70
🔵 Stoploss: 2.29
🔴 Sell Below: 2.31
🎯 Sell Target 1: 2.30
🎯 Sell Target 2: 2.20
🔵 Stoploss: 2.39
✨ Boost, follow, and engage for more detailed insights. Your support helps us bring you the latest and most accurate updates! 🚀❤️
#NaturalGas #XNGUSD #CommodityMarket #TradingSignals #TradingTips #TechnicalAnalysis #NG

NG MCX Future Intraday Analysis for 29th August, 2024📈 NG MCX Future Technical Chart Analysis
📊 Range Trigger Point: 178.80
📉 Day Range: 9.50
📅 Level Type: Daily
📅 Valid For: 29 Aug, 2024
📈 Buy Above: 176.67
💼 Average Position: 175.55
🎯 Buy Target 1: 184.67
🎯 Buy Target 2: 188.30
🛑 Stoploss: 173.50
📉 Sale Below: 174.43
🎯 Sale Target 1: 172.93
🎯 Sale Target 2: 169.30
🛑 Stoploss: 177.60
✨ Follow and engage for more insightful updates. Your engagement fuels our dedication to providing top-notch content! 🚀❤️
#NG #MCX #Futures #TechnicalAnalysis #StockMarket #Trading #Investment #MarketAnalysis #TradingTips

NG MCX Future Weekly Technical Chart Analysis 1-5 July, 24📈 NG MCX Future Technical Chart Analysis
📆 Weekly Levels: 1-5 July, 24
📊 Range Trigger Point: 217.80
📉 Weekly Range: 22.30
📈 Buy Above: 231.08
💼 Average Position: 228.45
🎯 Buy Target 1: 231.58
🎯 Buy Target 2: 240.10
🛑 Buyer Stoploss: 223.65
💰 Sale Below: 225.82
🎯 Sale Target 1: 204.02
🎯 Sale Target 2: 195.50
🛑 Seller Stoploss: 233.25
✨ Boost, follow, and engage for more insightful updates. For detailed analysis and live discussions, check out our community channels. Your engagement fuels our dedication to providing top-notch content! 🚀❤️
#NG #NaturalGas #GasPrices #NatGas #EnergyTrading #MCX #CommoditiesFutures #CommoditiesOptions

NG (MCX): Week of - 13/02/2023Levels:
Support: 200-190
Resistance: 220, 230, 250
OI Data (21st Feb Expiry):
Nearest Major Resistance in NG per OI data: 220, 230, 250
Nearest Major Support in NG per IO data: 200
Trade setup:
1. Looking at the OI data, most likely range-round is: 200-250
+++++++++++++++++++++++++++++++++++++++++
Trade | Level | SL | T1 | T2
-----------------------------------------
BUY | > 230 | 220 | 250| 300
-----------------------------------------
SELL | < 195 | 205 | 175 |150
+++++++++++++++++++++++++++++++++++++++++

Short NGNG has touched the resistance trend-line of daily time-frame. So the price of NG might fall. So here's my probability study in 4 hours time frame.
Entry: 3.064
Stop Loss: 3.1
Target 1: 2.997
Target 2: 2.957
Disclaimer:
This is the study based on my view. I can be wrong. Please apply your own study for entry, exit & stop loss.

NG MCX Future Weekly Technical Chart Analysis 2-6 Sept.📈 NG MCX Future Technical Chart Analysis
📅 Weekly Range: 2nd - 6th September, 2024
📊 Range Trigger Point: 179.00
📉 Weekly Range: 14.50
🟢 Buy Above: 179.76
💼 Average Position: 178.05
🎯 Buy Target 1: 187.96
🎯 Buy Target 2: 193.50
🔵 Stoploss: 174.93
🔴 Sell Below: 176.34
🎯 Sell Target 1: 170.04
🎯 Sell Target 2: 164.50
🔵 Stoploss: 181.17
✨ Stay tuned for more insightful trading updates! Follow for regular market analysis and tips. 🚀📊
#NaturalGas #MCX #FuturesTrading #TechnicalAnalysis #MarketTrends #WeeklyForecast #TradingStrategy #Stoploss #BuyAbove #SellBelow

NG MCX Future Intraday Technical Chart Analysis 23rd August, 24 📈 NG MCX Future Technical Chart Analysis
📊 Range Trigger Point: 172.80
📉 Day Range: 13.20
📅 Level Type: Daily
📅 Valid For: 23 Aug, 2024
📈 Buy Above: 178.96
💼 Average Position: 177.40
🎯 Buy Target 1: 180.96
🎯 Buy Target 2: 186.00
🛑 Stoploss: 174.56
📉 Sale Below: 175.84
🎯 Sale Target 1: 164.64
🎯 Sale Target 2: 159.60
🛑 Stoploss: 180.24
✨ Follow and engage for more insightful updates. Your engagement fuels our dedication to providing top-notch content! 🚀❤️
#NGMCX #NaturalGas #Commodities #Trading #TechnicalAnalysis #StockMarket #Investment #TradingTips #MarketAnalysis

NG to enter up trend on weekly chart, buy on dipsBoth indicators - stochastics and VI, are strongly oversold on weekly chart and there is a clear bullish wedge pattern. NG may touch 200. Buy on dips. Right now at 161 is a buy.
