How do Indicators Work in Trading?Trading indicators are essential tools that help traders analyze market trends and make better decisions.
By using historical price data and various mathematical formulas, these indicators provide insights into market conditions and potential future movements.
Whether you are tracking moving averages, measuring volatility with Bollinger Bands, or assessing momentum with the RSI, each of these indicators has its own advantages.
This article provides an overview of how trading indicators work and effective ways to use them for making trading decisions.
What Are Trading Indicators?
Trading indicators are tools used by traders to make informed decisions when analyzing and interpreting financial market data.
They are mathematical calculations based on historical price, volume, or open interest data, and they generate visual signals or patterns on trading charts.
These indicators can reveal trends, momentum, volatility, and market strength, assisting traders in predicting future price movements.
Commonly used types include moving averages that display the average price over a specific period of time and Relative Strength Index (RSI) that assesses how quickly and dramatically prices change.
Through comprehending and applying these indicators, traders can improve their market analysis and trading strategies.
How Do Indicators Work?
The truth is that trading indicators don't actually 'work' in the sense of predicting future prices. Instead, they reflect the market's psychology, showing how current prices compare to past ones, which can guide traders. When combined with candlestick patterns, these tools can help shape your technical analysis strategy.
For instance, indicators can suggest where to place a stop-loss order to minimize risk when closing a trade.
Using trading indicators is particularly valuable if you want to keep emotions out of your trading decisions or avoid being influenced by others' opinions.
Types of Trading Indicators
Traders use various types of trading indicators to analyze market trends and make informed decisions. Here are some of the most popular trading indicators:
1. Trend Indicators
Trend indicators help traders to recognize the intensity and direction of trends in a market. This helps them know whether a particular asset is in an uptrend, a downtrend, or moving sideways.
Common examples include Moving Averages (MA) and Moving Average Convergence Divergence (MACD). Moving Averages smooth out price data over a specified period, making it easier to spot the trend direction. MACD, on the other hand, shows the relationship between two moving averages, signaling potential trend changes.
These indicators are crucial for traders to align their strategies with the prevailing market direction and optimize their entry and exit points.
2. Momentum Indicators
Momentum indicators measure the speed or velocity of price movements to identify overbought or oversold conditions. They help traders gauge the strength of a price trend and anticipate potential reversals.
Examples of these indicators are: the Relative Strength Index (RSI) and the Stochastic Oscillator.
The RSI measures the size of recent gains versus recent losses to show if an asset is overbought or oversold. The Stochastic Oscillator compares a closing price to its price range over a specific period, also identifying overbought or oversold levels.
These indicators are essential for traders to assess market momentum and make informed trading decisions.
3. Volatility Indicators
Volatility indicators measure the rate of price fluctuations over a given period, helping traders understand market conditions.
Common examples are Bollinger Bands and Average True Range (ATR).
Bollinger Bands consist of a middle band (simple moving average) and two outer bands (standard deviations), indicating volatility levels and potential price reversals.
ATR gauges market volatility by averaging the true range over a set period. The true range includes the highest minus the lowest price of the current period, the absolute difference between the current high and the previous close, and the absolute difference between the current low and the previous close.
These indicators help in assessing market risk and potential price movements.
4. Volume Indicators
Volume indicators analyze trading activity to confirm price movements' strengths or weaknesses. By examining the volume of trades, these indicators reveal whether market participants support a price trend.
Common examples include On-Balance Volume (OBV) and the Volume Oscillator. OBV tracks buying and selling pressure by adding the volume on days when prices go up and subtracting it on days when prices go down. The Volume Oscillator compares two moving averages of volume to gauge trend strength.
These indicators help traders identify potential trend reversals, validate price movements, and make more informed trading decisions based on the activity behind price changes.
Conclusion
Trading indicators are powerful tools that can significantly improve your trading strategy. By providing valuable insights into market trends and conditions, they help traders make more informed decisions.
While it's important to understand their limitations, combining different indicators and customizing them to your trading style can lead to better results.
Search in ideas for "oscillator"

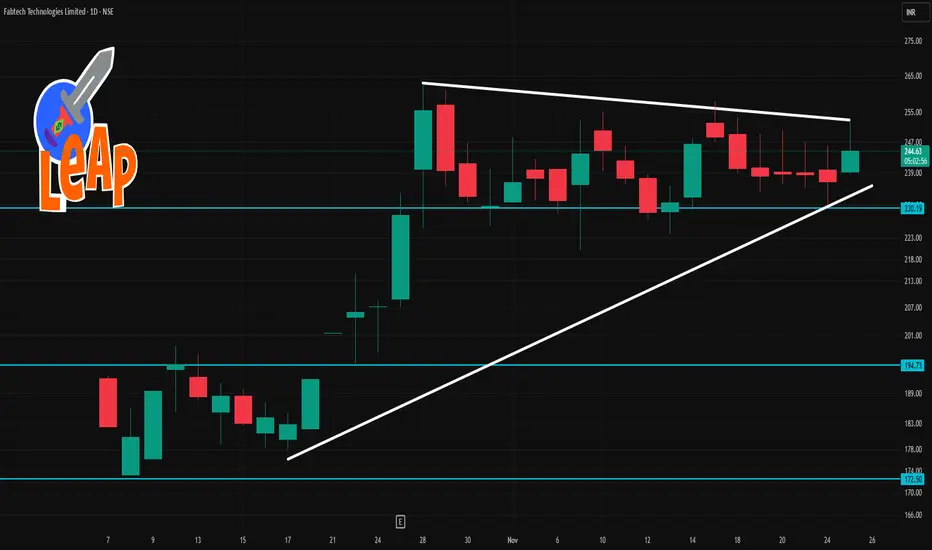
Fabtech 1 Day Time Frame 🔍 Technical Context
Moving averages (20-day, 50-day) are showing price above them, which suggests bullish bias.
Oscillators: RSI ~ 59-60 meaning moderate strength.
A recent source says the daily summary is “Neutral” on investing.com, indicating caution.
1-day pivot levels (classic) from Investing.com:
Pivot ~ ₹ 237.73
Resistance R1 ~ ₹ 240.46, R2 ~ ₹ 244.72, R3 ~ ₹ 247.45
Support S1 ~ ₹ 233.47, S2 ~ ₹ 230.74, S3 ~ ₹ 226.48
📊 Key Levels to Watch Today
Support Zone: ~ ₹ 233-235
If the stock approaches or dips into this area, watch for whether it holds or breaks.
Immediate Pivot / Mid-range: ~ ₹ 237-238
The pivot (~₹237.73) is a critical inflection point. A clear move above might bias upside; a break below may shift focus downward.
Resistance Zone: ~ ₹ 240-245
Upper resistance around ~₹240.46 to ~₹244.72. If momentum picks up and this zone is breached, next upside target ~₹247.45.
Lower Breakdown Level: ~ ₹ 230-227
If support in the ~233-235 zone fails, look toward ~₹230.74 and then ~₹226.48 as next real support.
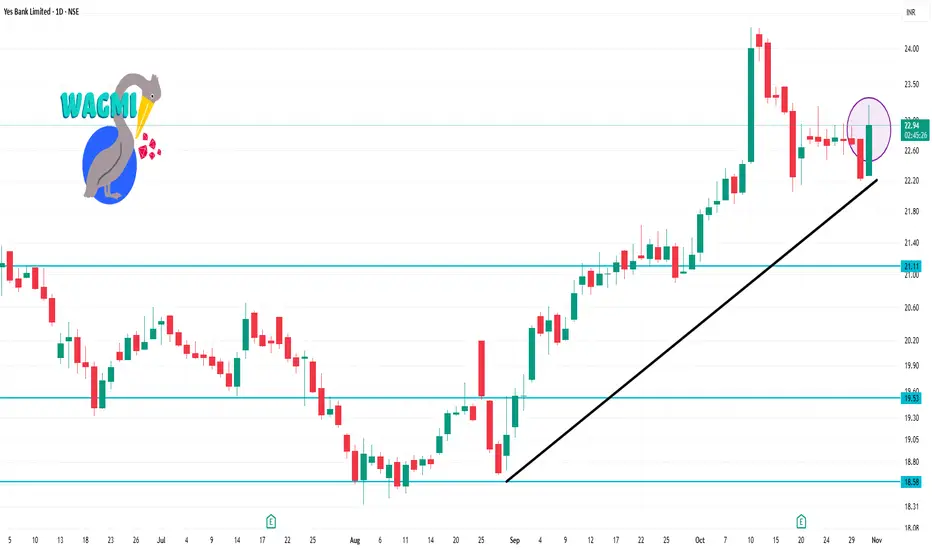
YESBANK 1 Day Time Frame ✅ Key Technical Levels & Indicators
Recent price around ₹22.60–₹22.70.
Support zones: ~ ₹22.22 (short term) and ~ ₹20.97 (medium term) according to MarketScreener.
Resistance: ~ ₹24.03 region.
Pivot (classic) for the day: ~ ₹22.58.
Daily technical indicator summary: Many moving averages show bullish (price above SMA/EMA) for 20/50/200 day on some sites.
Oscillators: RSI in mid-range (~46.6) signalling neither strongly overbought nor oversold.
Short-term trend: Many tools flag “bullish” in short, medium and long term.
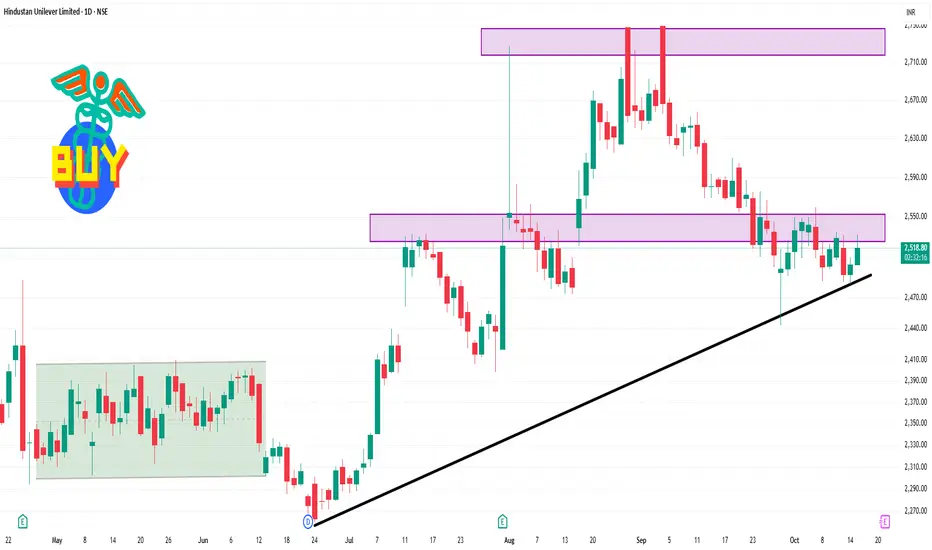
HINDUNILVR 1 Day Time Frame 📊 Intraday Price Range
Day Range: ₹2,502.60 – ₹2,531.80
VWAP (Volume-Weighted Average Price): ₹2,521.48
🔰 Pivot & Support/Resistance Levels
Standard Pivot: ₹2,513.57
Resistance (R1): ₹2,524.83
Resistance (R2): ₹2,540.47
Support (S1): ₹2,497.93
Support (S2): ₹2,486.67
🔁 Technical Outlook
Technical Summary: Neutral
Moving Averages: Neutral
Oscillators: Neutral
Overall Rating: Neutral
🔍 Analysis & Strategy
Support Zone: ₹2,400–₹2,500
Resistance Zone: ₹2,650–₹2,700
Breakout Target: ₹2,850+
Stop Loss: ₹2,395 (closing basis)
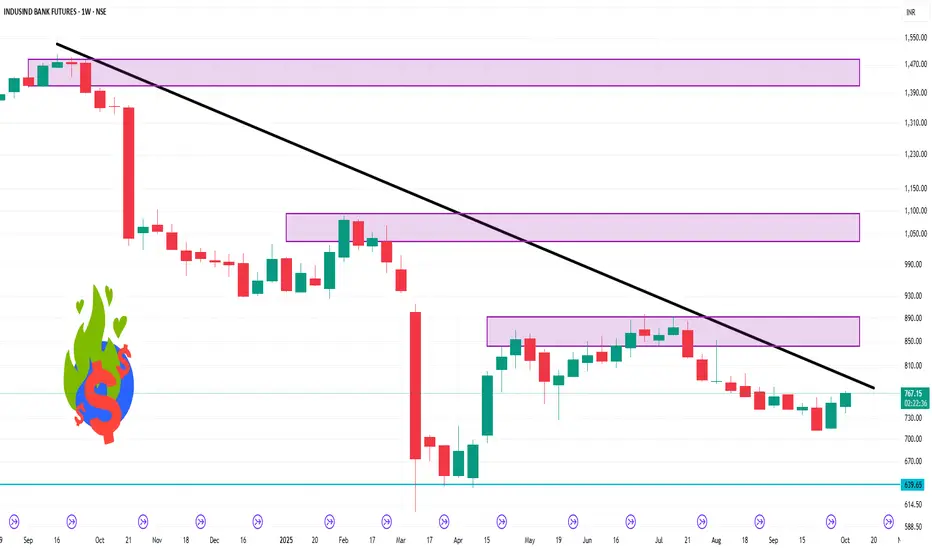
INDUSINDBK 1 Week Time FrameKey Technical Indicators:
Oscillators: Neutral
Moving Averages: Strong Buy
Overall Technical Rating: Neutral
Support and Resistance Levels:
Weekly Pivot Points:
Support: 739.63
Resistance: 766.72
Additional Insights:
Relative Strength Index (RSI): The 14-day RSI is at 70.368, suggesting the stock is approaching overbought conditions, which may indicate a potential pullback
Moving Averages: The 5-day moving average is 755.54, and the 50-day moving average is 744.63, both indicating a bullish trend
Conclusion:
While the overall technical rating is neutral, the price action above the weekly pivot point and the bullish moving averages suggest a potential for upward movement. However, the elevated RSI indicates caution, as the stock may be due for a correction. Traders should monitor these levels closely and consider the broader market conditions before making trading decisions.
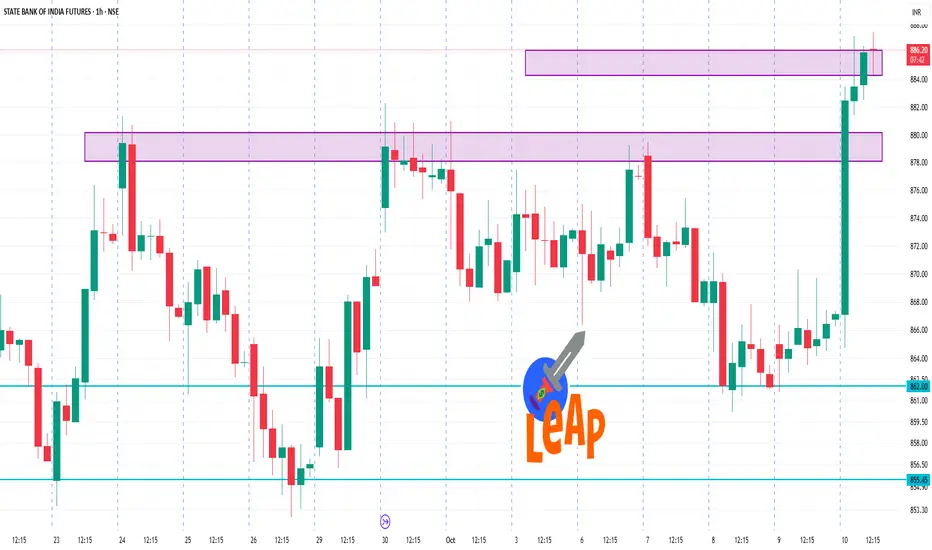
SBIN 1 Hour Time Frame 📈 1-Hour Time Frame Technical Overview
On the 1-hour chart, the technical indicators for SBIN futures are as follows:
Moving Averages: Strong Buy
Oscillators: Neutral
Overall Technical Rating: Strong Buy
This suggests a bullish short-term trend, with moving averages indicating upward momentum.
🔄 Key Levels to Watch
Based on recent intraday analysis, the following levels are noteworthy:
Resistance Levels: ₹880.88
Support Levels: ₹863.38
These levels can serve as potential entry or exit points for traders.
📊 Additional Insights
Open Interest: Approximately 94.62 million contracts, indicating active participation.
Volume: Around 13.07 million contracts traded, reflecting healthy liquidity.
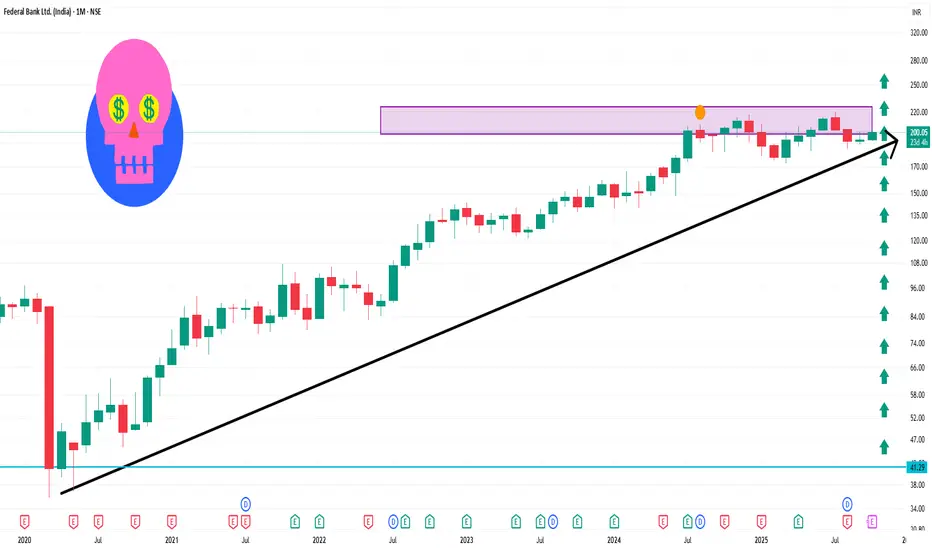
FEDERALBNK 1 Month Time Frame📊 Current Market Snapshot
Current Price: ₹199.99
Day Range: ₹199.68 – ₹202.46
52-Week Range: ₹172.66 – ₹220.00
Volume: 3,014,015 shares traded
📈 Analyst Price Forecast (1-Month Outlook)
Average Target: ₹224.37
High Estimate: ₹265.00
Low Estimate: ₹165.00
📉 Technical Indicators
Overall Sentiment: Mixed (Bearish: 9, Neutral: 3, Bullish: 3)
Moving Averages: Bearish
Oscillators: Bearish
Pivot Points: Neutral
📰 Recent Financial Performance
Q1 FY2025: Net profit declined by 15% to ₹862 crore, attributed to higher provisions, despite a 2% increase in Net Interest Income (NII)
✅ Summary
Current Price: ₹199.99
1-Month Target Range: ₹165 – ₹265
Technical Indicators: Mixed, with a bearish short-term outlook
Recent Performance: Profit decline due to increased provisions
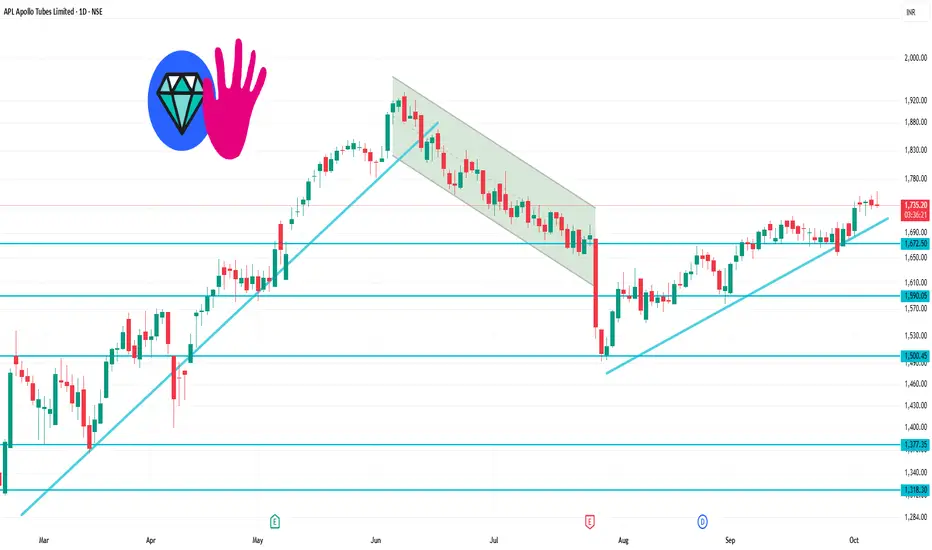
APLAPOLLO 1 Day Time Frame📊 Intraday Support & Resistance Levels
Immediate Support Levels: ₹1,717.57 and ₹1,733.63
Immediate Resistance Levels: ₹1,764.6 and ₹1,764.6
📈 Pivot Points
Standard Pivot Point: ₹1,749.57
Camarilla R3: ₹1,742.82
Fibonacci Resistance: ₹1,748.19
📉 Technical Indicators
Overall Technical Strength: Strong Buy
Moving Averages: Bullish
Oscillators: Bullish
🔮 Trend Outlook
The stock is trading above key support levels, indicating a potential continuation of the upward trend. However, it's essential to monitor for any signs of reversal or consolidation near resistance levels.
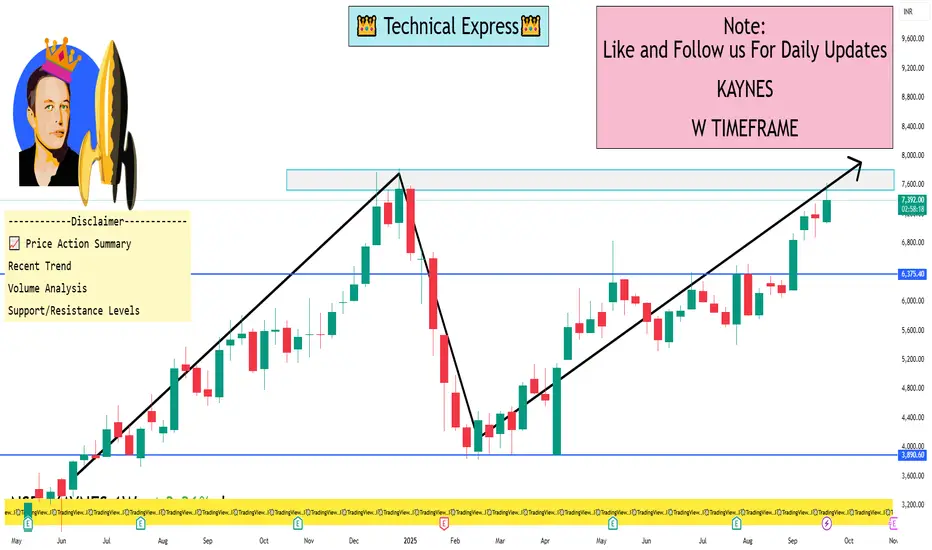
KAYNES 1 Week View 📊 Current Market Snapshot
Current Price: ₹7,379.00
Day's Range: ₹7,375.00 – ₹7,509.00
Previous Close: ₹7,503.00
VWAP (Volume Weighted Average Price): ₹7,445.71
Market Cap: ₹49,725.69 Cr
52-Week High/Low: ₹7,822.00 / ₹3,825.15
P/E Ratio: 156.62
Dividend Yield: 0.00%
Beta: 1.39
Face Value: ₹10.00
Volume: 194,246 shares
🔍 Technical Indicators (1-Day Timeframe)
Moving Averages: Mixed signals; no clear trend direction.
Oscillators: Neutral; no strong buy or sell signals.
Pivot Points: Support around ₹7,375.00; resistance near ₹7,509.00.
MACD: Recently crossed over on September 24, 2025, indicating potential upward momentum.
📈 Price Action Summary
Recent Trend: The stock has shown a slight decline of 1.66% from the previous close, indicating a minor pullback.
Volume Analysis: Trading volume remains moderate, suggesting steady investor interest without significant volatility.
Support/Resistance Levels: Immediate support at ₹7,375.00; resistance at ₹7,509.00. A breakout above resistance could signal a continuation of the upward trend; a drop below support may indicate further downside.
🧠 Market Sentiment
Investor sentiment appears cautiously optimistic, with recent developments such as the company's expansion into OSAT and PCB manufacturing, backed by government subsidies, potentially contributing to positive outlooks.
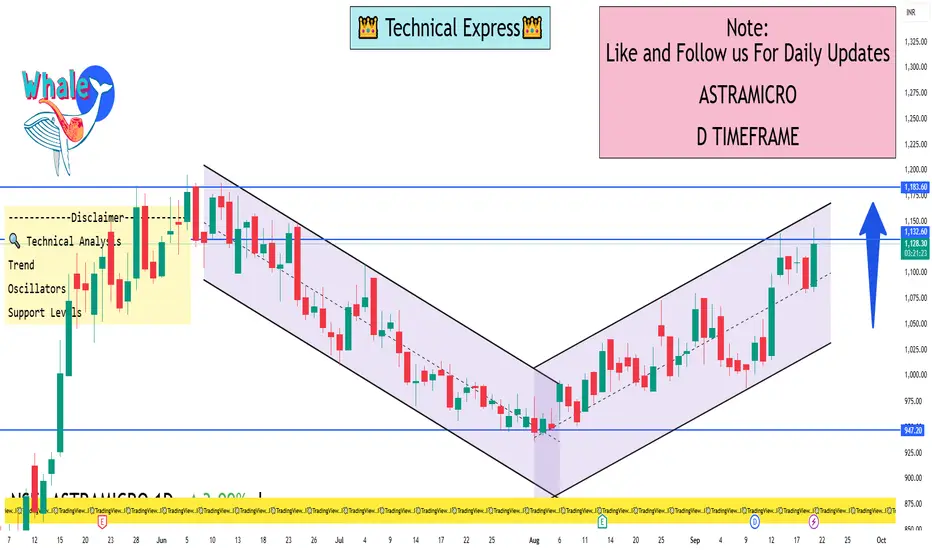
ASTRAMICRO 1 Day View📈 Current Market Overview
Current Price: ₹1,132.50
Day’s Range: ₹1,081.30 – ₹1,144.00
Previous Close: ₹1,085.00
Volume: 517,982 shares
VWAP: ₹1,123.74
52-Week Range: ₹584.20 – ₹1,195.90
The stock has gained approximately 4.77% today, outperforming the broader market indices, with the BSE Sensex down 0.50% and the Nifty 50 down 0.45%
🔍 Technical Analysis (1-Day Timeframe)
Trend: The stock is in a strong uptrend, forming higher highs and higher lows on the daily chart.
Oscillators: Indicators suggest a bullish momentum, with a "buy" signal prevailing.
Support Levels: The immediate support is around ₹1,081.30.
✅ Conclusion
Astra Microwave Products Ltd is currently in a bullish phase on the 1-day timeframe, supported by positive technical indicators and moving averages. However, given the stock's proximity to resistance levels and high volatility, it's advisable to monitor for a breakout above ₹1,144.00 for potential further gains. Traders should also consider setting a stop-loss around ₹1,034.16 to manage risk effectively.
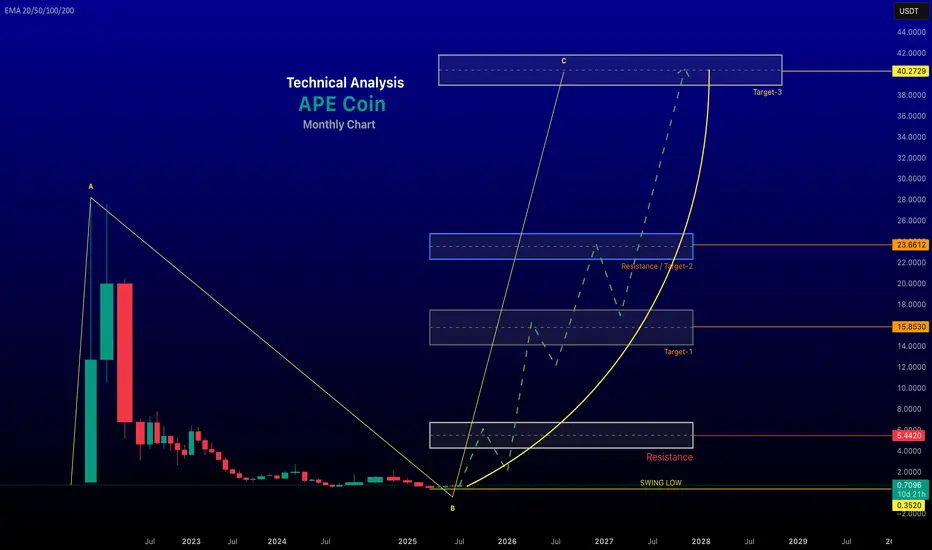
renderwithme || Ape Technical Analysis for 2025ApeCoin (APE) AnalysisApeCoin (APE) is an ERC-20 governance and utility token tied to the Bored Ape Yacht Club (BAYC) ecosystem by Yuga Labs, designed to empower decentralized community building in Web3. Below is a comprehensive analysis of ApeCoin, covering its current market performance, technical indicators, price predictions, and fundamental factors, based on available data.
Historical Price Trends: All-Time High: $27.79 on April 28, 2022, reflecting a -98% decline to current levels.
All-Time Low: $0.349 on April 7, 2025, with the current price up approximately 93.31% from this low.
Recent Performance: Over the past week, APE has risen by 9.17%-37.09%, and over the past month, it has increased by 0.45%-58.16%. However, it has declined by -15.88% to -44.50% over the past year, indicating significant volatility and a bearish long-term trend.
Trading Volume: The 24-hour trading volume is approximately $30.92M-$61.61M, with a 7-day average of $32.61M and a 30-day average of $25.38M. This suggests moderate trading activity, with recent spikes potentially tied to ecosystem developments.
Technical AnalysisCurrent Signals: Short-Term (Daily/4-Hour): Technical indicators show a "Strong Buy" signal on 4-hour and daily charts, suggesting short-term bullish momentum. This is supported by a recent breakout above a key resistance at $0.63 and a potential retest of higher levels like $0.74 or $1.00.
Weekly/Monthly: The weekly chart shows a neutral signal, while the monthly chart indicates a "Sell" trend, reflecting longer-term bearish pressure.
Chart Patterns:A falling wedge pattern has formed on the daily chart, which could signal a bullish reversal if buying pressure increases, potentially pushing APE toward $0.80-$2.00. However, failure to sustain momentum could lead to a drop to $0.22-$0.42.
The price has broken key resistance levels (e.g., $0.63) and trendlines, with some analysts noting a "flag" pattern breakout, indicating potential for further upside if the trend holds.
Key Indicators:Moving Averages: Most moving averages suggest a "Strong Sell" on longer timeframes, indicating bearish momentum over months.
Oscillators: Neutral, with no clear overbought or oversold conditions, suggesting indecision between buyers and sellers.
Fibonacci Levels: APE is currently trading between 0.236 and 0.382 Fibonacci retracement levels, with resistance around $0.60-$1.00.
Sentiment: The Fear & Greed Index for APE stands at 66 (Greed zone), indicating positive investor sentiment, which could signal a buying opportunity for some or a potential sell-off if greed peaks.
Price PredictionsShort-Term (2025):Bearish forecasts suggest APE could drop to $0.22-$0.42 due to consolidation or lack of buying pressure.
Bullish scenarios predict a range of $0.80-$2.00, especially if an altcoin season emerges or ecosystem developments drive demand.
Medium-Term (2026-2027):Bullish predictions estimate APE reaching $2.50-$3.84 in 2026 and potentially higher in 2027 if the crypto market sees broader growth.
Conservative estimates suggest a trading range of $0.41-$0.94, reflecting continued volatility.
Long-Term (2030-2050):Optimistic forecasts project APE reaching $29.55-$40.15 by end of 2026, driven by potential growth in the Web3 and metaverse sectors.
Extremely bullish (but speculative) predictions for 2050 suggest prices as high as $1,050-$1,184, though these are highly uncertain due to the hype-driven nature of APE’s ecosystem.
More conservative outlooks predict modest growth to $0.73-$1.10 by 2030, contingent on sustained ecosystem adoption.
Fundamental AnalysisEcosystem and Use Case:Governance: APE is the governance token for the ApeCoin DAO, allowing holders to vote on fund allocation, partnerships, and ecosystem development. 62% of the token supply is allocated to the Ecosystem Fund to support community-driven initiatives.
Utility: APE serves as a currency for transactions within the ecosystem, providing access to exclusive games, merchandise, events, and services. It also incentivizes third-party developers to integrate APE into Web3 projects, such as Animoca Brands’ Benji Bananas.
ApeChain: The launch of Yuga Labs’ ApeChain Layer-3 platform in October 2024 briefly boosted APE’s price, but the token fell out of the top 100 cryptos by market cap in December 2024, reflecting waning momentum.
Community and Adoption:The BAYC ecosystem, backed by high-profile endorsements (e.g., Justin Bieber, Paris Hilton), remains a key driver of APE’s relevance. However, declining NFT popularity since 2021 has reduced hype, impacting APE’s value.
The ApeCoin DAO’s governance structure, including the APE Foundation and its Board, aims to foster decentralized decision-making but has faced criticism for inefficiencies and lack of community engagement.
Strengths:Strong brand association with BAYC, a leading NFT project.
Fixed supply of 1 billion tokens, preventing inflation.
Integration into Web3 projects like the Otherside metaverse and gaming ecosystems.
Weaknesses:Heavy reliance on NFT hype, which has significantly declined.
Volatility tied to market sentiment and ecosystem developments.
Criticism of the DAO’s treasury spending on “nonsense” projects, raising concerns about governance efficiency.
Opportunities:Growth in Web3 and metaverse adoption could drive demand for APE.
Partnerships with platforms like Animoca Brands and potential new use cases in DeFi or e-commerce.
Threats:Regulatory risks affecting cryptocurrencies and NFTs.
Competition from other governance and utility tokens.
Potential for further price declines if NFT market sentiment remains bearish.
Investment Advice: Always conduct thorough research and consult a financial advisor before investing, as cryptocurrencies carry significant risks.
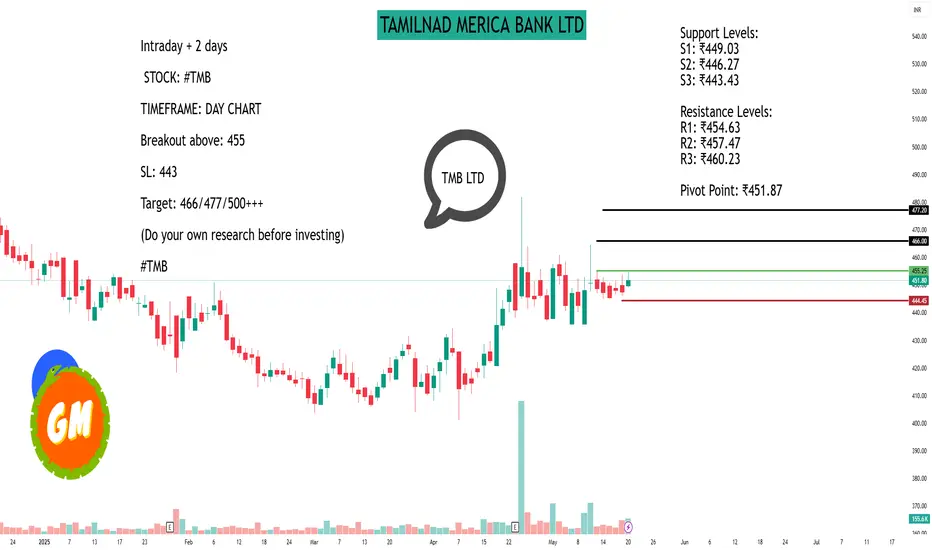
TAMILNAD MERICA BANK LTDAs of May 21, 2025, Tamilnad Mercantile Bank Ltd. (NSE: TMB) is trading at ₹451.80, reflecting a 0.97% increase over the previous day.
📊 1-Day Support & Resistance Levels (Classic Pivot Method)
Based on the previous trading day's price range, the following support and resistance levels have been identified:
Support Levels:
S1: ₹449.03
S2: ₹446.27
S3: ₹443.43
Resistance Levels:
R1: ₹454.63
R2: ₹457.47
R3: ₹460.23
Pivot Point: ₹451.87
📈 Technical Indicators
Moving Averages:
20-day EMA: ₹444.47
50-day EMA: ₹437.38
100-day EMA: ₹438.24
200-day EMA: ₹446.85
Oscillators:
Relative Strength Index (RSI 14): 58.01 (indicates uptrend)
Commodity Channel Index (CCI 14): 62.68 (indicates uptrend)
Money Flow Index (MFI): 74.25 (indicates strong uptrend)
🔍 Trading Insights
The current price is slightly below the pivot point, suggesting a neutral to slightly bullish stance. If the price moves above the pivot point, it may test the resistance levels. Conversely, a drop below the pivot could lead to testing the support levels.
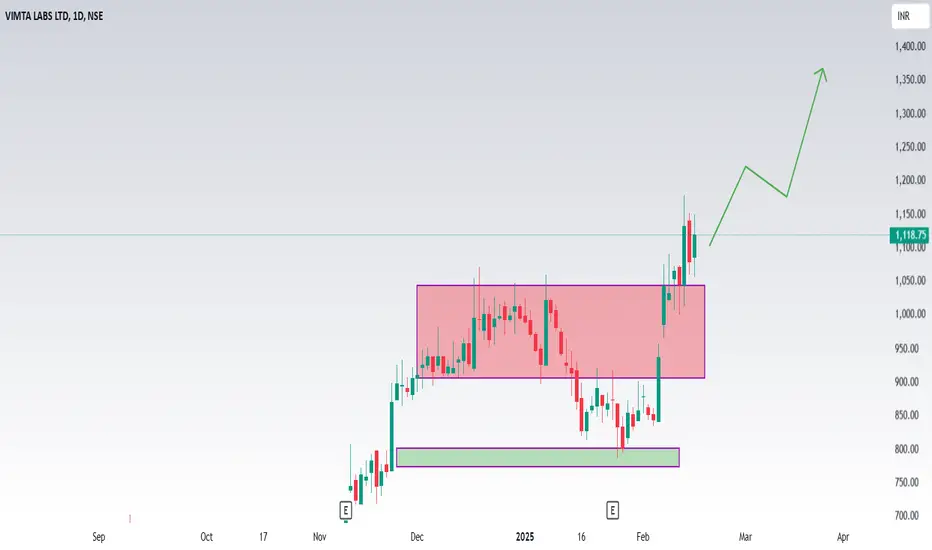
Vimta labs ltdShould I buy VIMTA LABS LTD stock? Our technical rating for VIMTA LABS LTD is buy today. Note that market conditions change all the time — according to our 1 week rating the strong buy trend is prevailing, and 1 month rating shows the strong buy signal.
Vimta Labs Ltd. (NSE: VIMTALABS) is currently exhibiting a strong bullish trend, as indicated by various technical analysis indicators.
**Technical Indicators:**
- **Moving Averages:** All moving averages (5, 10, 20, 50, 100, and 200 periods) are signaling a 'Buy' or 'Strong Buy' position, suggesting sustained upward momentum. citeturn0search2
- **Relative Strength Index (RSI):** The 14-day RSI stands at 89.33, indicating that the stock is in the overbought territory. While this suggests strong momentum, it also implies a potential for price correction. citeturn0search2
- **MACD (Moving Average Convergence Divergence):** The MACD is above the signal line, reinforcing the bullish trend. citeturn0search2
- **Stochastic Oscillator:** The Stochastic Oscillator is in the overbought zone, which may indicate a potential for price pullback. citeturn0search2
**Support and Resistance Levels:**
- **Support:** The stock has support at ₹560. citeturn0search3
- **Resistance:** The resistance level is at ₹1,020. citeturn0search3
**Volume Analysis:**
The stock has experienced high trading volumes at price peaks and lower volumes at price troughs, indicating that price movements are supported by significant trading activity. citeturn0search3
**Conclusion:**
While Vimta Labs Ltd. is currently in a strong bullish phase, the overbought conditions suggested by the RSI and Stochastic Oscillator warrant caution. Investors should monitor these indicators closely, as a price correction could occur if the stock remains in the overbought zone. It's advisable to consider these technical factors alongside fundamental analysis and broader market conditions when making investment decisions.
Crude OilLet's break down the trend and reversal analysis of this chart:
### 1. Trend Analysis:
- **Uptrend:** As seen in the chart, prices form higher lows (HL), indicating an upward movement over time. Higher lows suggest that buyers are gaining strength at each dip.
- **Downtrend:** Conversely, the presence of lower highs (LH) points to a downward trend where sellers dominate, causing prices to decline with each rally.
### 2. Reversal Signals:
- **Stochastic Oscillator:** This tool helps identify overbought (82.60) and oversold (73.03) conditions. When the oscillator crosses above or below these levels, it can signal possible price reversals.
- **Candlestick Patterns:** Notice the formations around higher lows and lower highs. These patterns can provide clues to potential reversals. For example, long wicks indicate price rejection at certain levels, hinting at a change in direction.
### 3. Key Levels:
- **Resistance Levels:** Prices often struggle to break above certain points, known as resistance. In this chart, the high around 79.44 USD could act as a resistance level.
- **Support Levels:** Similarly, prices tend to find support at lower levels like 64.74 USD, where buyers step in to prevent further decline.
To sum it up, this chart indicates that the WTI Crude market experiences alternating trends, with periods of upward (higher lows) and downward (lower highs) movements, while key indicators (stochastic oscillator and candlestick patterns) provide insight into potential reversals.
Feel free to ask if you'd like to dive deeper into any specific aspect!

USDINR_IN CONSOLIDATION PHASEA consolidation zone, also known as a trading range, occurs when a stock's price moves within a relatively narrow range, exhibiting neither a clear uptrend nor downtrend. Traders and investors often refer to this period as a "sideways market" or "range-bound market." Identifying stocks in a consolidation zone can be useful for traders who employ range-bound strategies. Here are some key characteristics of stocks in consolidation:
#Horizontal Price Movement:
Prices move within a defined range, creating horizontal support and resistance levels.
The stock neither makes significant higher highs nor lower lows.
#Decreased Volatility:
Volatility tends to decrease during consolidation.
The price swings are smaller compared to trends, and there is less directional momentum.
Stable Trading Patterns:
Traders may observe repeating patterns within the consolidation range, such as channels or rectangles.
These patterns can help identify potential breakout or breakdown points.
#Volume Analysis:
Trading volume often decreases during consolidation.
A breakout or breakdown accompanied by an increase in volume can signal a potential change in trend.
#Indicators and Oscillators:
Technical indicators like the Relative Strength Index (RSI) or Moving Average Convergence Divergence (MACD) may show reduced momentum during consolidation.
Overbought or oversold conditions may be less pronounced.
#Duration of Consolidation:
The length of time a stock spends in consolidation can vary, ranging from days to weeks or even months.
Longer consolidation periods may precede more significant price movements.
News and Catalysts:
Consolidation can be influenced by a lack of significant news or catalysts, creating a period of uncertainty for market participants.
#Breakout or Breakdown Potential:
Traders often watch for a breakout above resistance or a breakdown below support to initiate trades.
Confirmation of a breakout or breakdown is crucial for avoiding false signals.

OLD, an technical insight for the coming week 21.08.2023Gold Analysis for the Upcoming Week on MCX, India
Date: 20th August 2023, 18:03 hours
Technical Overview:
Recent Performance: From 8th May to today's date, gold prices have witnessed a significant decline of approximately 5.49%.
Moving Averages: The gold price has recently breached the 50-day moving average, which stands at 58,980. The 200-day moving average looms at 57,586. The cross below the 50-day indicates a bearish momentum in the short term.
Potential Move: If gold price approaches the 200-day moving average of 57,586, there's potential for further downside towards 56,048.
Oscillators: The asset is currently in an oversold condition, which can sometimes indicate a potential rebound. The optimistic signals stand at D: 6.54 and K: 3.21.
MACD: The Moving Average Convergence Divergence (MACD) is still hinting at a bearish scenario, suggesting continued negative momentum.
Fisher & Percentage R: Both indicators are positioned at the lower end, hinting at a potential bearish continuation.
Fibonacci Levels: Post touching a low at the Fibonacci level of 57,653, gold made an upward move and attempted to break above the 0.5 Fibonacci level at 59,751 twice between July and August. However, it failed to sustain this and reversed its direction, breaking past the 0.382 and 0.236 levels. Current trajectory points towards a retest of the 57,653 level.
Target Price for the Week: Considering the above technical factors and absence of any significant strategic updates from the Federal Reserve regarding interest rates, our projected target price for gold in the near term stands at 57,612.
Disclaimer: This analysis does not provide any specific trading or investment recommendation. It is essential to note that the movements in gold prices can be significantly influenced by various macroeconomic factors and announcements from the Federal Reserve. Always consult with a financial advisor before making any investment decision.
Disclosure: We do not have any vested interest in the gold market We may or may or maynot be having positions in the gold. This analysis is purely based on technical indicators and past market data.

Bata India (Daily) - Head & Shoulders Chart Pattern Bata India (Daily)
Chart Pattern - Head & Shoulders
Wave Count - 4th (seems to be in the C wave of ABC / ABCDE)
Indicators/Oscillators:
MACD of the weekly is downtick
MACD of daily is downtick and NCO too with solid red bars of the histogram
BB about to get challenged on the lower side (BBCD)
RSI is below 40 in oversold zone
Stochastic 14,3,3 is NCO and about to leave the band for oversold zone
-DI is above +DI in Directional Movement Index (DMI) indicating downtrend and ADX is above 15
Target:
During the fall, it has a major resistance at 1686.55, this is the same level on the chart at which it had faced resistance twice earlier while climbing up and hence could be the first target while shorting
Caution:
Liquidity is a serious issue, please check the OI data in the Options Chain in case you wish to do options trading or implement a vertical spread like Bear Call Spread

SRTRANSFIN: Pattern after PatternCandle pattern: Bullish
Indicators & Oscillators: OverSOLD.
Go LONG: @ LTP +0.5% to @ -0.5%
Target / SL/ & others on chart.
for any clarification / discussion please comment.
Intraday/ Swing levels Updated later.
Disclaimer: Only For STUDY. For Taking Trade Decision Consult Financial Advisor.
LIKE / Comment /Share, If useful & enriched your knowledge.

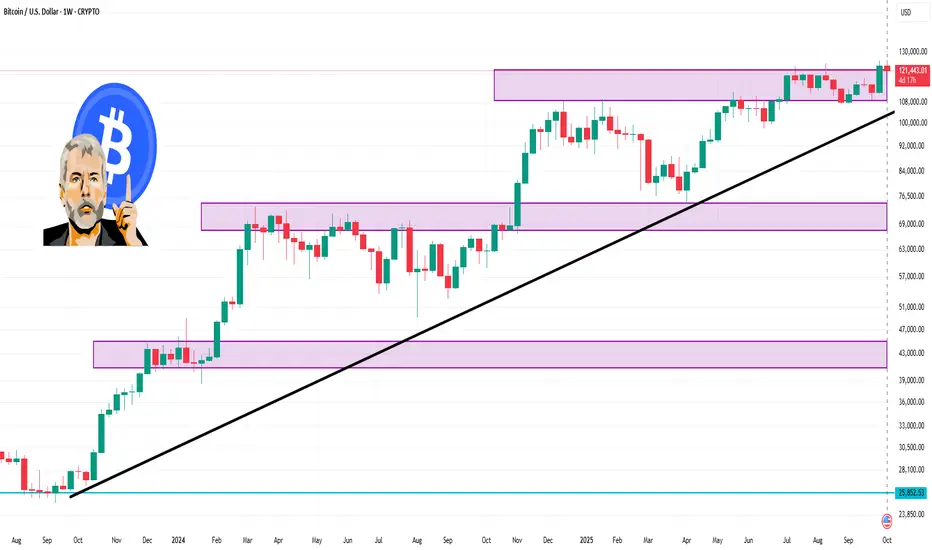
BTC against USD 1 Week Time Frame 📊 Weekly Technical Levels
Resistance Levels:
$124,652.59
$127,266.08
$129,248.44
Support Levels:
$120,056.73
$118,074.38
$115,460.88
These levels are based on Barchart's technical analysis and are derived from the most recent data available.
📈 Technical Indicators
Relative Strength Index (RSI): The RSI is currently at 61.95%, indicating that Bitcoin is neither overbought nor oversold.
Stochastic Oscillator: Both the %K and %D lines are in the 80% range, suggesting that Bitcoin is in an overbought condition, which could precede a pullback.
Average True Range (ATR): The 9-day ATR is 3,316.77, indicating a daily price movement of approximately 2.73%.
Directional Movement Index (DMI): The +DI is at 35.72, and the -DI is at 10.17, suggesting a strong bullish trend.
🔮 Market Outlook
Analysts project that Bitcoin may reach up to $126,865 within the next week, with a potential target of $129,753 over the next four weeks.
⚠️ Risk Considerations
While the long-term outlook appears bullish, it's essential to monitor key support levels. A drop below $120,000 could signal a short-term correction. Additionally, the stochastic oscillator indicates an overbought condition, which may lead to a pullback.
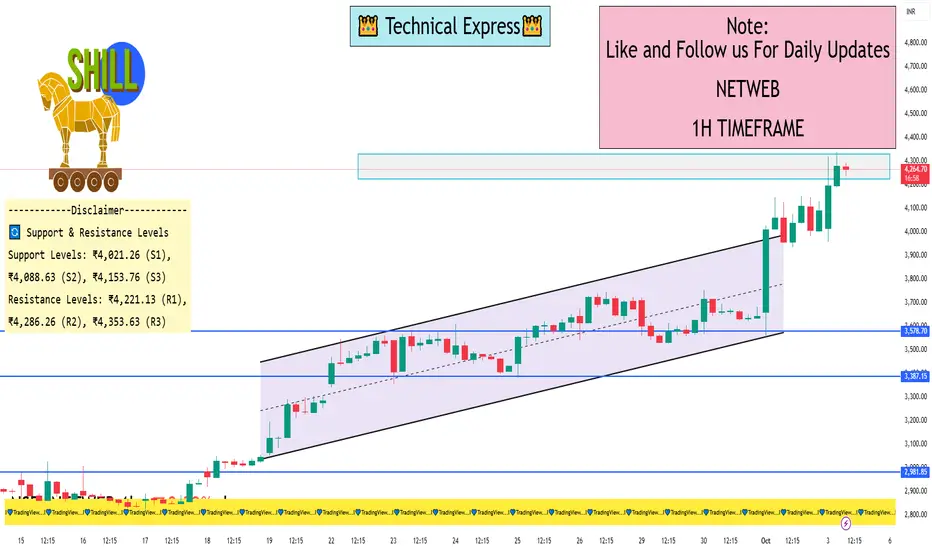
NETWEB 1 Hour ViewNETWEB is trading at ₹4,216.00, reflecting a 3.79% increase from the previous close.
📈 1-Hour Technical Analysis (as of 10:43 AM IST)
Based on intraday data, here are the key technical indicators for NETWEB on the 1-hour timeframe:
Relative Strength Index (RSI): 81.37 — indicates the stock is in the overbought zone, suggesting potential for a short-term pullback.
Moving Average Convergence Divergence (MACD): 395.90 — confirms a strong bullish momentum.
Average Directional Index (ADX): 60.55 — suggests a strong trend in the market.
Stochastic Oscillator: 89.93 — indicates the stock is in the overbought zone.
Super Trend: ₹3,386.37 — supports the current upward movement .
Williams %R: -4.50 — suggests the stock is in the overbought zone.
🔄 Support & Resistance Levels
According to pivot point analysis, the key support and resistance levels for NETWEB are:
Support Levels: ₹4,021.26 (S1), ₹4,088.63 (S2), ₹4,153.76 (S3).
Resistance Levels: ₹4,221.13 (R1), ₹4,286.26 (R2), ₹4,353.63 (R3).
The current price of ₹4,216.00 is near the R1 resistance level, indicating potential for a breakout if the price surpasses this level.
📊 Trend Analysis
The stock is exhibiting strong bullish indicators across multiple timeframes, including the 1-hour chart. The RSI, MACD, and ADX all suggest a continuation of the upward trend. However, the overbought conditions indicated by the RSI, Stochastic Oscillator, and Williams %R suggest that traders should be cautious of potential short-term pullbacks.
WIPRO 1D Time framw📈 Price Action
Previous Close: ₹255.75
Today's Close: ₹256.50
Daily Range: ₹253.00 – ₹257.00
Volume: 804,499 shares (significantly higher than the 50-day average of 369,496 shares)
52-Week Range: ₹228.00 – ₹324.55
🔧 Technical Indicators
Relative Strength Index (RSI): 63.59 — Indicates bullish momentum.
MACD: Positive — Suggests upward trend.
Moving Averages:
5-day MA: ₹254.50
50-day MA: ₹249.00
200-day MA: ₹265.00
Trend: Bullish, as the stock is trading above short-term moving averages.
Stochastic Oscillator: 76.47% — Indicates overbought conditions, suggesting potential for a pullback.
Average True Range (ATR): ₹0.05 — Indicates low volatility.
📊 Support & Resistance Levels
Immediate Support: ₹253.00
Immediate Resistance: ₹257.00
Pivot Point: ₹255.00
🧠 Trend Analysis
Trend: Bullish
Momentum: Positive
Volatility: Low
Summary: Wipro's stock is exhibiting a bullish trend with positive momentum. The current overbought condition, as indicated by the stochastic oscillator, suggests that the stock may experience a short-term pullback before continuing its upward trajectory. Traders should monitor the support and resistance levels for potential entry and exit points.

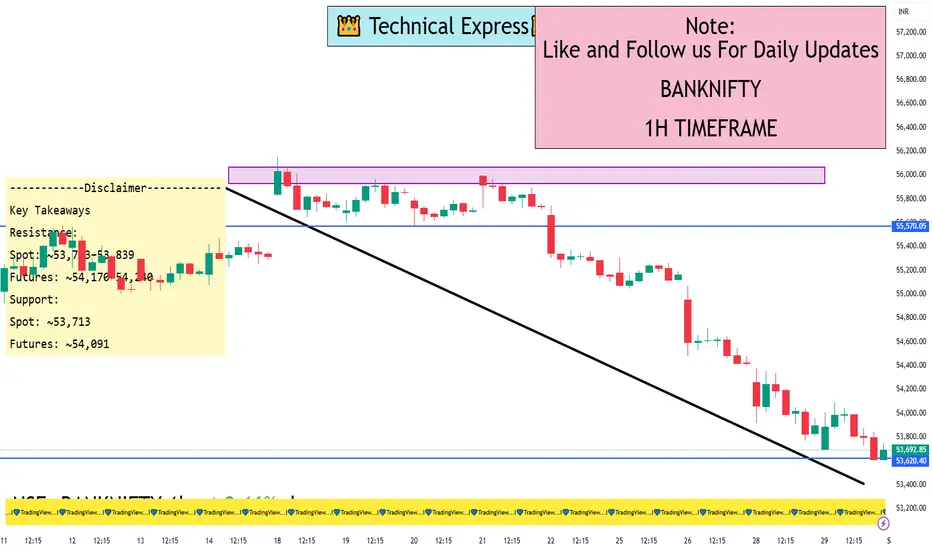
Bank Nifty Index 1 Hour ViewHourly Technical Summary (as of August 29, 2025, ~10:00 AM GMT)
Investing.com’s “Nifty Bank (NSEBANK)” technicals on the hourly chart show:
Overall Summary: Strong Sell
Moving Averages: 12 out of 12 (both Simple and Exponential across various periods) suggest Sell
Key Indicators:
RSI (14): ~25 – Sell
Stochastic oscillator: Overbought
MACD: Sell
ADX: Strong Sell (indicating trending weakness)
Other metrics (CCI, ROC, Bull/Bear Power) – mostly Sell
Pivot-levels (Hourly):
Classic:
S1: 53,713
Pivot: 53,783
R1: 53,839
Fibonacci: similar to above
Camarilla: tighter range around 53,783
How to Use This
Short-term traders might look to enter on bounces near the resistance end of the range with tight stop-loss, targeting support.
Breakout traders should watch if support breaks — could see accelerated decline — or if resistance is broken with volume, signaling possible reversal.
Risk management is key given mixed oscillator readings and macro volatility.
Do keep in mind:
These are technical snapshots as of August 29, 2025. If you're looking for real-time or updated levels, regularly check live tools like TradingView, Investing.com, or your trading platform.
Always blend technical levels with broader market context and risk tolerance before taking action.
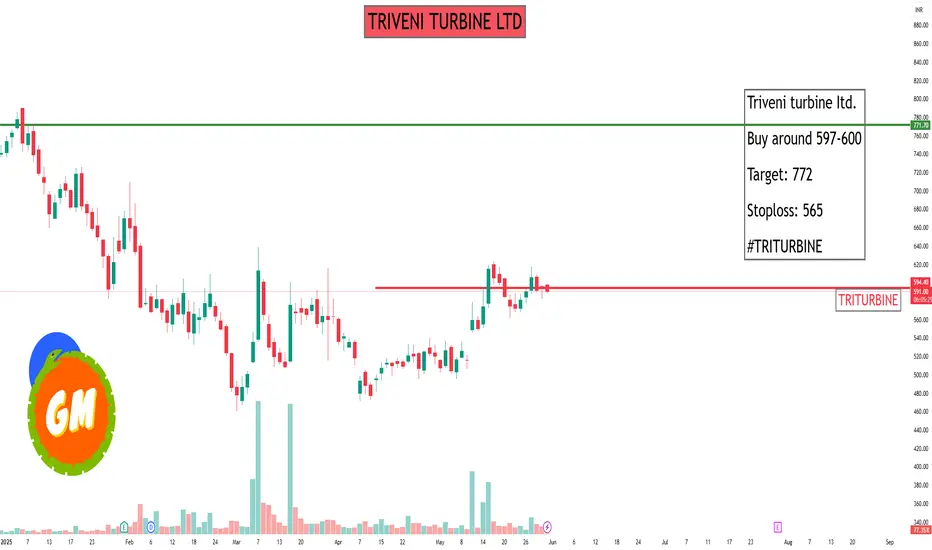
TRIVENI TURBINE LTDAs of May 30, 2025, Triveni Turbine Ltd. (NSE: TRITURBINE) is trading at approximately ₹595.40 . Based on the latest technical data, here are the intraday support and resistance levels:
🔹 Intraday Support & Resistance Levels
Standard Pivot Points:
Support Levels:
S1: ₹597.12
S2: ₹584.98
S3: ₹577.87
Resistance Levels:
R1: ₹616.37
R2: ₹623.48
Fibonacci Pivot Points:
Support Levels:
S1: ₹597.12
S2: ₹589.76
S3: ₹585.22
Resistance Levels:
R1: ₹604.47
R2: ₹609.01
R3: ₹616.37
Camarilla Pivot Points:
Support Levels:
S1: ₹590.34
S2: ₹588.57
S3: ₹586.81
Resistance Levels:
R1: ₹593.86
R2: ₹595.63
R3: ₹597.39
Note: These levels are derived from pivot point calculations and can vary based on market conditions.
🔹 Technical Indicators
Relative Strength Index (RSI): The RSI is currently between 45 and 55, indicating a neutral condition.
Stochastic Oscillator: The Stochastic Oscillator is in the bullish range, suggesting potential upward momentum.
🔹 Recent Price Action
Triveni Turbine's stock has experienced significant volatility recently. After reaching a high of ₹885.00 on November 26, 2024, the stock declined to a low of ₹460.30 on March 3, 2025. Since then, it has rebounded, trading around ₹595.40 as of May 30, 2025.