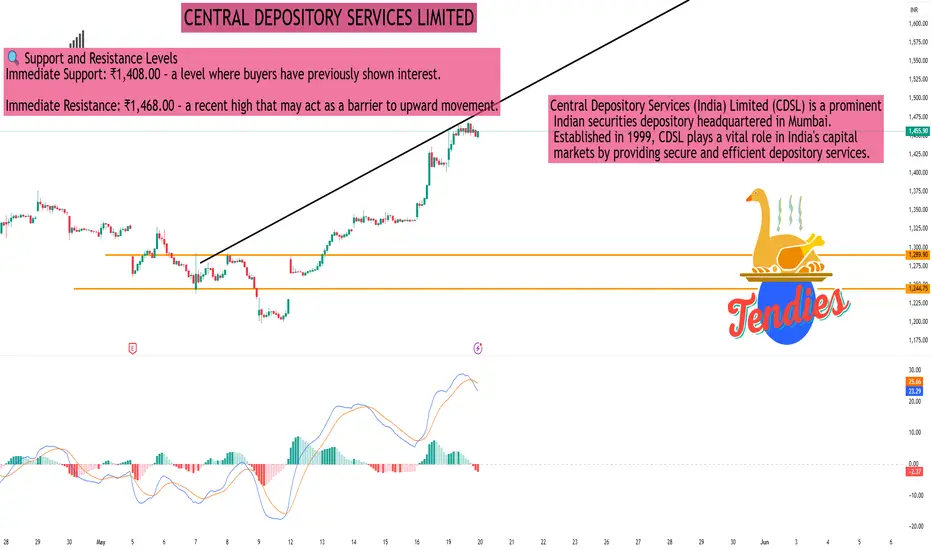
CENTRAL DEPOSITORY SERVICES LIMITEDAs of the close on Monday, May 19, 2025, Central Depository Services (India) Ltd (NSE: CDSL) was trading at ₹1,450.80, marking a 2.98% increase from the previous session.
📊 30-Minute Timeframe Technical Overview
Price Action:
Day's Range: ₹1,408.00 – ₹1,468.00
52-Week Range: ₹1,047.45 – ₹2,989.00
Volume: Approximately 9.5 million shares traded, indicating heightened market activity.
Technical Indicators:
Relative Strength Index (RSI): 69.89 – approaching overbought territory, suggesting caution.
Moving Average Convergence Divergence (MACD): 36.23 – indicating bullish momentum.
Average Directional Index (ADX): 16.44 – suggesting a weak trend strength.
Stochastic Oscillator: 80.92 – in the overbought zone, which may precede a price correction.
Indicator: ₹1,280.03 – acting as a support level.
Parabolic SAR (PSAR): ₹1,209.57 – indicating an upward trend.
🔍 Support and Resistance Levels
Immediate Support: ₹1,408.00 – a level where buyers have previously shown interest.
Immediate Resistance: ₹1,468.00 – a recent high that may act as a barrier to upward movement.
🔭 Outlook
The technical indicators suggest that CDSL is experiencing a strong bullish trend. However, the RSI and Stochastic Oscillator indicate that the stock is nearing overbought conditions, which could lead to a short-term consolidation or minor correction. Investors should monitor the support and resistance levels closely and consider the heightened trading volume, which may affect the strength of the current trend.
Search in ideas for "oscillator"
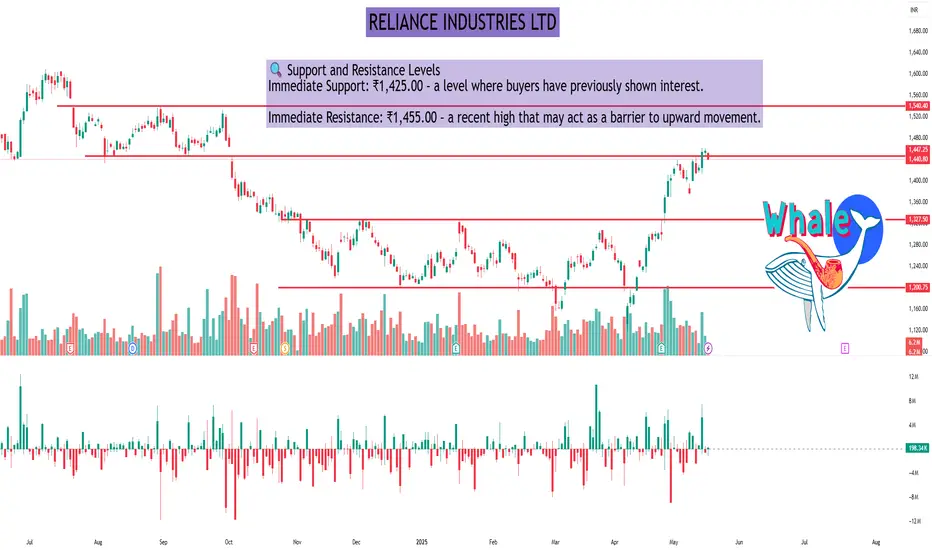
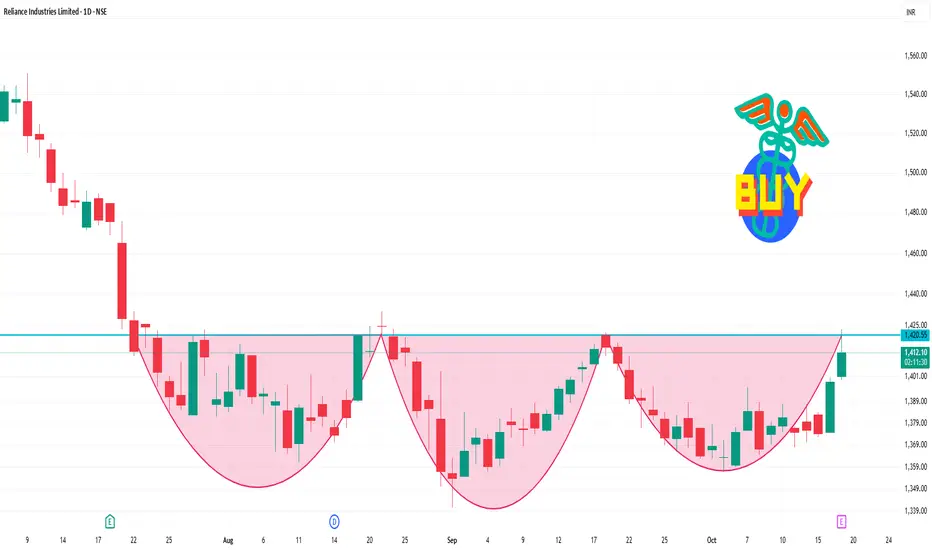
RELIANCE INDUSTRIES LTDAs of the close on Monday, May 19, 2025, Reliance Industries Ltd (NSE: RELIANCE) traded at ₹1,440.80, reflecting a 1.07% decrease from the previous session.
📊 Daily Technical Overview
Price Action:
Opening Price: ₹1,452.10
Day's Range: ₹1,438.20 – ₹1,454.60
52-Week Range: ₹1,114.85 – ₹1,608.80
Volume: Approximately 6.2 million shares traded, below the 50-day average of 8.4 million, indicating reduced market activity.
Technical Indicators:
Relative Strength Index (RSI): 69.84 – approaching overbought territory, suggesting caution.
Moving Average Convergence Divergence (MACD): Bullish crossover, indicating potential upward momentum.
Stochastic Oscillator: 76.17 – in the overbought zone, which may precede a price correction.
Average Directional Index (ADX): Indicates a strong trend, supporting the current price movement.
🔍 Support and Resistance Levels
Immediate Support: ₹1,425.00 – a level where buyers have previously shown interest.
Immediate Resistance: ₹1,455.00 – a recent high that may act as a barrier to upward movement.
🔭 Outlook
The technical indicators suggest that Reliance Industries Ltd is experiencing a strong bullish trend. However, the RSI and Stochastic Oscillator indicate that the stock is nearing overbought conditions, which could lead to a short-term consolidation or minor correction. Investors should monitor the support and resistance levels closely and consider the reduced trading volume, which may affect the strength of the current trend.
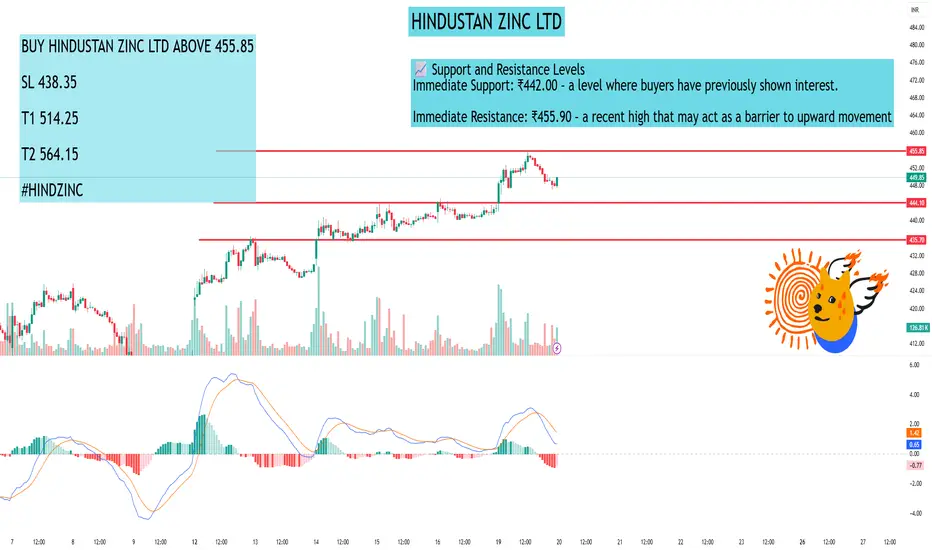
HINDUSTAN ZINC LTDAs of the close on Monday, May 19, 2025, Hindustan Zinc Ltd (NSE: HINDZINC) was trading at ₹448.20, reflecting a 1.33% increase from the previous session.
📊 15-Minute Timeframe Technical Overview
Analyzing the 15-minute chart, the stock exhibits a mild bullish trend:
Price Action: The current price is ₹428.25.
Moving Averages:
The 5-period Exponential Moving Average (EMA) is at ₹440.66.
The 15-period EMA stands at ₹435.01.
The 50-period EMA is at ₹435.91.
The 100-period EMA is at ₹446.19.
The 15-period EMA trending above the 50-period EMA indicates a bullish crossover.
Trend Analysis: The 5 and 15 EMAs are on an upward trajectory, suggesting a mild bullish sentiment in the short term.
🔍 Technical Indicators
Relative Strength Index (RSI): The RSI is approximately 56.70, indicating a neutral momentum without being overbought or oversold.
Moving Average Convergence Divergence (MACD): The MACD is at 0.811, suggesting a bullish crossover.
Average Directional Index (ADX): The ADX is at 13.22, indicating a weak trend strength.
Stochastic Oscillator: The Stochastic Oscillator is at 63.96, pointing to neutral momentum.
Indicator: The supertrend is at ₹406.99, acting as a support level.
Parabolic SAR (PSAR): The PSAR is at ₹400.77, indicating an upward trend.
📈 Support and Resistance Levels
Immediate Support: ₹442.00 – a level where buyers have previously shown interest.
Immediate Resistance: ₹455.90 – a recent high that may act as a barrier to upward movement.
🔭 Outlook
The current indicators suggest a cautious approach:
If the price sustains above ₹442.00, there may be potential for a rebound towards ₹455.90.
Conversely, a drop below ₹442.00 could lead to further declines, possibly testing lower support levels.
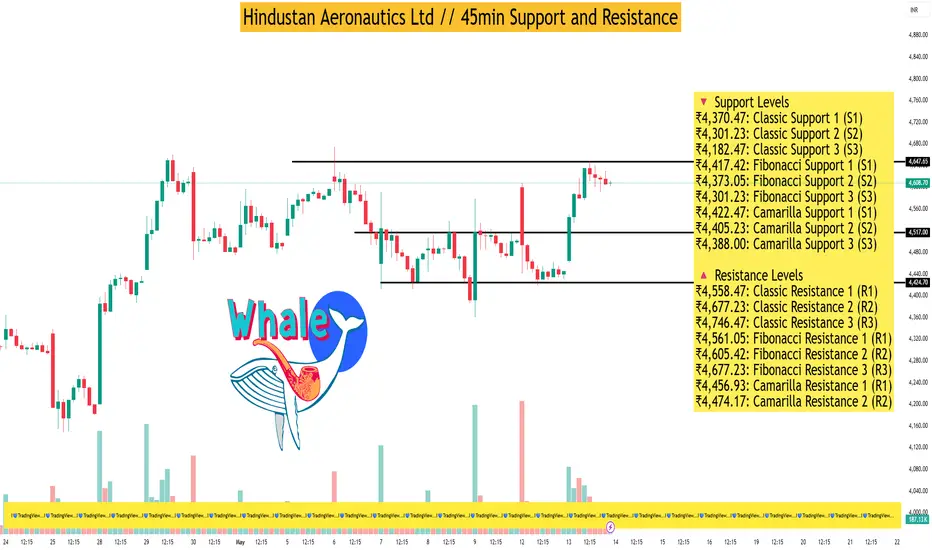
Hindustan Aeronautics Ltd // 45min Support and ResistanceAs of May 13, 2025, Hindustan Aeronautics Ltd (HAL) closed at ₹4,463.80, experiencing a slight decline of 0.668% for the day. Analyzing the 45-minute timeframe, the following support and resistance levels have been identified based on technical indicators and pivot point analyses:
🔻 Support Levels
₹4,370.47: Classic Support 1 (S1)
₹4,301.23: Classic Support 2 (S2)
₹4,182.47: Classic Support 3 (S3)
₹4,417.42: Fibonacci Support 1 (S1)
₹4,373.05: Fibonacci Support 2 (S2)
₹4,301.23: Fibonacci Support 3 (S3)
₹4,422.47: Camarilla Support 1 (S1)
₹4,405.23: Camarilla Support 2 (S2)
₹4,388.00: Camarilla Support 3 (S3)
🔺 Resistance Levels
₹4,558.47: Classic Resistance 1 (R1)
₹4,677.23: Classic Resistance 2 (R2)
₹4,746.47: Classic Resistance 3 (R3)
₹4,561.05: Fibonacci Resistance 1 (R1)
₹4,605.42: Fibonacci Resistance 2 (R2)
₹4,677.23: Fibonacci Resistance 3 (R3)
₹4,456.93: Camarilla Resistance 1 (R1)
₹4,474.17: Camarilla Resistance 2 (R2)
₹4,491.40: Camarilla Resistance 3 (R3)
📊 Technical Indicators Summary
Relative Strength Index (RSI): 44.65 – Neutral
MACD: -4.97 – Bearish
Average Directional Index (ADX): 20.58 – Indicates a weak trend
Stochastic Oscillator: 58.04 – Neutral
Rate of Change (ROC): 1.61 – Slightly bullish
Supertrend: ₹4,540.11 – Current trend indicator
Parabolic SAR (PSAR): ₹4,397.84 – Suggests potential reversal point
These indicators suggest a mildly bearish outlook in the short term, with the stock trading below key resistance levels. The RSI and Stochastic Oscillator indicate a neutral momentum, while the MACD points towards a bearish trend. The ADX value suggests that the current trend lacks strength.
Banswara Syntex Ltd.Banswara Syntex Ltd. (NSE: BANSWRAS) is currently exhibiting a **Neutral** technical outlook on the monthly timeframe.
**Technical Indicators:**
- **Relative Strength Index (RSI):** The 14-day RSI stands at 53.81, indicating a neutral market sentiment. citeturn0search5
- **Moving Averages:** The stock is trading below its 50-day simple moving average (SMA) of ₹144.23 and above its 50-day exponential moving average (EMA) of ₹139.63, suggesting a mixed trend. citeturn0search5
- **MACD (Moving Average Convergence Divergence):** The MACD value is -2.43, which is below the signal line, indicating a bearish momentum. citeturn0search5
- **Stochastic Oscillator:** The Stochastic Oscillator is at 68.59, suggesting a neutral market condition. citeturn0search5
**Support and Resistance Levels:**
- **Support:** The stock has support at ₹127.62. citeturn0search5
- **Resistance:** The resistance level is at ₹137.67. citeturn0search5
**Conclusion:**
Banswara Syntex Ltd. is currently in a neutral technical position on the monthly timeframe, with indicators suggesting neither strong bullish nor bearish momentum. Investors should monitor these indicators closely, as a breakout above resistance levels could signal a bullish trend, while a drop below support levels might indicate a bearish move. It's advisable to consider these technical factors alongside fundamental analysis and broader market conditions when making investment decisions.

#bls international #BLS PERFECT REVERSAL CANDIDATE
BLS International Services Ltd. (NSE: BLS) is currently exhibiting a **Neutral** technical outlook, with indicators suggesting neither strong bullish nor bearish momentum.
**Technical Indicators:**
- **Relative Strength Index (RSI):** The 14-day RSI stands at 35.13, indicating a neutral market sentiment. citeturn0search4
- **Moving Averages:** The stock is trading below its 5-day, 10-day, 20-day, and 50-day simple and exponential moving averages, suggesting a bearish trend. citeturn0search4
- **MACD (Moving Average Convergence Divergence):** The MACD value is -10.94, which is below the signal line, indicating a bearish momentum. citeturn0search4
- **Stochastic Oscillator:** The Stochastic Oscillator is at 16.70, suggesting a buy signal. citeturn0search4
**Support and Resistance Levels:**
- **Support:** The stock has support at ₹389.87. citeturn0search4
- **Resistance:** The resistance level is at ₹448.87. citeturn0search4
**Conclusion:**
BLS International Services Ltd. is currently in a neutral technical position, with indicators suggesting neither strong bullish nor bearish momentum. Investors should monitor these indicators closely, as a breakout above resistance levels could signal a bullish trend, while a drop below support levels might indicate a bearish move. It's advisable to consider these technical factors alongside fundamental analysis and broader market conditions when making investment decisions.

Crisil Ltd.CRISIL Ltd. (NSE: CRISIL) is currently exhibiting a **Neutral** technical outlook, as indicated by various technical analysis indicators.
**Technical Indicators:**
- **Relative Strength Index (RSI):** The 14-day RSI stands at 38.43, suggesting a neutral market sentiment. citeturn0search3
- **Moving Averages:** The stock is trading below its 5-day, 10-day, 20-day, and 50-day simple and exponential moving averages, indicating a bearish trend. citeturn0search3
- **MACD (Moving Average Convergence Divergence):** The MACD value is -124.85, which is below the signal line, suggesting a bearish momentum. citeturn0search3
- **Stochastic Oscillator:** The Stochastic Oscillator is at 38.63, indicating a neutral market condition. citeturn0search3
**Support and Resistance Levels:**
- **Support:** The stock has support at ₹4,996.55. citeturn0search3
- **Resistance:** The resistance level is at ₹5,455.40. citeturn0search3
**Conclusion:**
CRISIL Ltd. is currently in a neutral technical position, with indicators suggesting neither strong bullish nor bearish momentum. Investors should monitor these indicators closely, as a breakout above resistance levels could signal a bullish trend, while a drop below support levels might indicate a bearish move. It's advisable to consider these technical factors alongside fundamental analysis and broader market conditions when making investment decisions.

silver Divergence TradingTrend lines are among the most accurate buy and sell indicators, along with simple moving average, stochastic, moving average convergence divergence, and relative strength index being the top trading indicators that help traders analyze the market signals effectively.
The best divergence indicators mt4 are MACD, RSI, stochastic, OA. They are user-friendly and simple but provide quite accurate trading signals. You can learn more about stochastic oscillator trading forex in the article Stochastic Oscillator: guide for using indicator in Forex trading.

XRP Weekly Chart Analysis: Bullish or Bearish?
BINANCE:XRPUSDT has been trading sideways within a tight range between $0.64 and $0.68 for the past few weeks, leaving investors wondering whether the crypto is consolidating for another bullish leg up or preparing for a potential breakdown. This article will analyze the technical indicators, support and resistance levels, and overall market sentiment to provide a comprehensive outlook for XRP in the coming weeks.
Technical Analysis:
Price: $0.6854 (as of 10 December 2023)
Trend: Neutral to slightly bullish
Technical Indicators:
RSI: 52.42 (neutral)
MACD: Histogram is above the zero line, indicating a potential bullish trend.
Stochastic oscillator: Both lines are above 50, indicating overbought conditions.
The technical indicators on the weekly chart present a mixed picture. The RSI remains neutral, suggesting that there is no strong buying or selling pressure in the market. The MACD histogram is above the zero line, indicating a potential bullish trend, while the stochastic oscillator is in overbought territory, suggesting that a pullback may be imminent.
Support and Resistance:
Support: $0.64, $0.62, $0.60
Resistance: $0.68, $0.70, $0.72
The chart shows several key support and resistance levels. If XRP breaks below the $0.64 support level, it could lead to a further decline towards $0.62 or even $0.60. Conversely, a break above the $0.68 resistance level could trigger a rally towards $0.70 or even $0.72.
Fundamental Analysis:
Ripple Labs: Ripple Labs, the company behind XRP, continues to develop its blockchain-based payment network. Recent partnerships with major financial institutions could drive adoption and demand for XRP.
Regulation: The ongoing SEC lawsuit against Ripple Labs remains a major overhang on XRP's price. However, a recent court ruling could pave the way for a favorable outcome for Ripple.
The fundamental picture for XRP is mixed. While the company continues to make progress, the regulatory environment remains uncertain. The outcome of the SEC lawsuit could have a significant impact on XRP's price in the future.
Sentimental Analysis:
Social media: Sentiment towards XRP on social media is generally positive, with many investors optimistic about its future.
News articles: Recent news articles have been positive, focusing on Ripple's partnerships and technological advancements.
Surveys: A recent survey suggests that a majority of investors believe XRP will reach $1.00 by the end of 2024.
The sentimental analysis of XRP is positive, suggesting that investors are increasingly optimistic about its future prospects.
Prediction:
Based on the technical, fundamental, and sentimental analysis, here is a potential outlook for XRP in the coming weeks:
Short Term:
Trading range: $0.64 - $0.68
Potential breakouts:
Above $0.68: $0.70, $0.72
Below $0.64: $0.62, $0.60
Long Term:
Overall trend: Bullish
Potential price targets:
End of 2023: $0.75 - $1.00
End of 2024: $1.00 - $2.00
Disclaimer: This is not financial advice. Please do your own research before investing in any cryptocurrency.
Additional Notes:
The price of XRP is highly volatile and can be affected by a number of factors, including the overall cryptocurrency market, news and events related to Ripple Labs, and regulatory developments.
It is important to remember that past performance is not indicative of future results.

TREND LINE BREAKOUT in MPHASISCan wait for confirmation for shorting because the volumes are not interesting also the other oscillators arent giving strong signals for sell, so can wait for confirmation candle and other signals from oscillators.

OWN STRATEGY TO TRADE IN CRUDE OIL MARKETHI TRADERS
I'M FROM INDIA, DOING TRADE FOR LAST THREE YEARS AND ONLY IN CRUDE. THE POPULAR PRODUCT AND HIS MOVEMENTS IMPRESSED EVERY TRADER. YA EVERYBODY KNOWS THAT. WHEN I'M STARTING TRADING HAVE LOTS OF STRUGGLES. DON'T KNOW ABOUT THE BASIC, FUNDAMENTAL AND TECHNICAL. AFTER SOME PERIOD GONE I STUDIED THE CRUDE. USING INDICATORS, OSCILLATORS, SEARCHING FORMULAS... ITS GOES ON GOES ON GOES ON... AFTER GETTING SOME PERIOD I FOUND ONE METHOD. FORMING A TABLE. ITS A SIMPLE WAY TO FIND THE TREND. NOT USING ANY INDICATORS OR OSCILLATORS. IT BASED ON ONLY NUMBERS. ITS SIMPLE EXCEL CALCULATIONS ONLY. EVERY I FOLLOWING THAT STRATEGY ONLY. ITS JUST AN EXPERIENCE SHARING ONLY. ANYBODY WANT TO LEARN THAT STRATEGY. PING ME.
THANKS

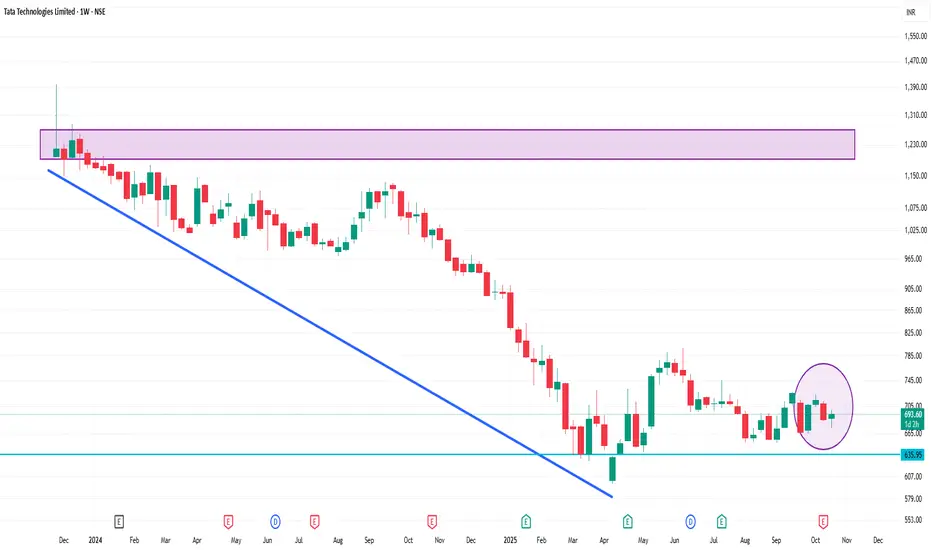
TATATECH 1 Week Time Frame 📉 Technical Summary (1-Week Outlook)
Overall Rating: Bearish to Neutral
Moving Averages: The stock is trading below key moving averages, including the 5-day, 10-day, 20-day, and 50-day, indicating a short-term bearish trend.
Relative Strength Index (RSI): At 43.13, the RSI suggests a neutral stance, indicating neither overbought nor oversold conditions.
MACD: The MACD is at -0.64, which typically signals a bearish trend.
Support Levels: Key support is observed around ₹677.75.
Resistance Levels: Immediate resistance is near ₹699.95.
🔍 Indicator Insights
Stochastic Oscillator: At 13.30, indicating potential for a short-term rebound.
Commodity Channel Index (CCI): At -74.09, suggesting neutral momentum.
Average Directional Index (ADX): At 16.41, showing weak trend strength.
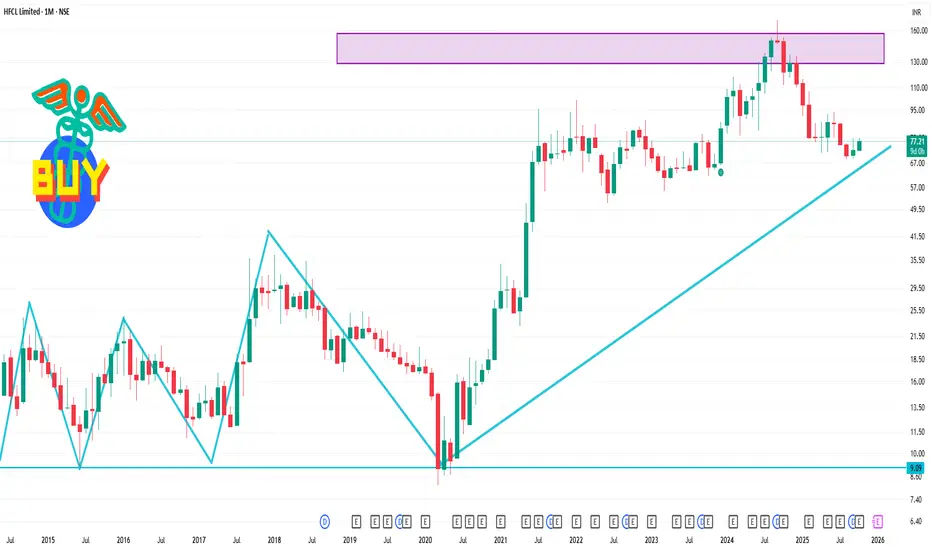
HFCL 1 Month Time Frame 📊 Monthly Technical Indicators
RSI (14-day): 57.91 — Neutral
Stochastic RSI: 72.52 — Neutral
MACD: 0.64 — Slightly bullish
ADX (14): 18.80 — Weak trend strength
Commodity Channel Index (CCI): 26.28 — Neutral
Rate of Change (ROC): 4.63% — Positive momentum
Williams %R: -51.95 — Neutral
Ultimate Oscillator: 48.33 — Neutral
Average True Range (ATR): ₹2.67 — Moderate volatility
📈 Moving Averages
Short-Term (5, 10, 20-day): Bullish
Medium-Term (50-day): Bullish
Long-Term (100, 200-day): Bearish
🧭 Key Support & Resistance Levels
Support Levels: ₹76.43 (S1), ₹75.73 (S2), ₹74.86 (S3)
Resistance Levels: ₹78.12 (R1), ₹79.06 (R2), ₹80.00 (R3)
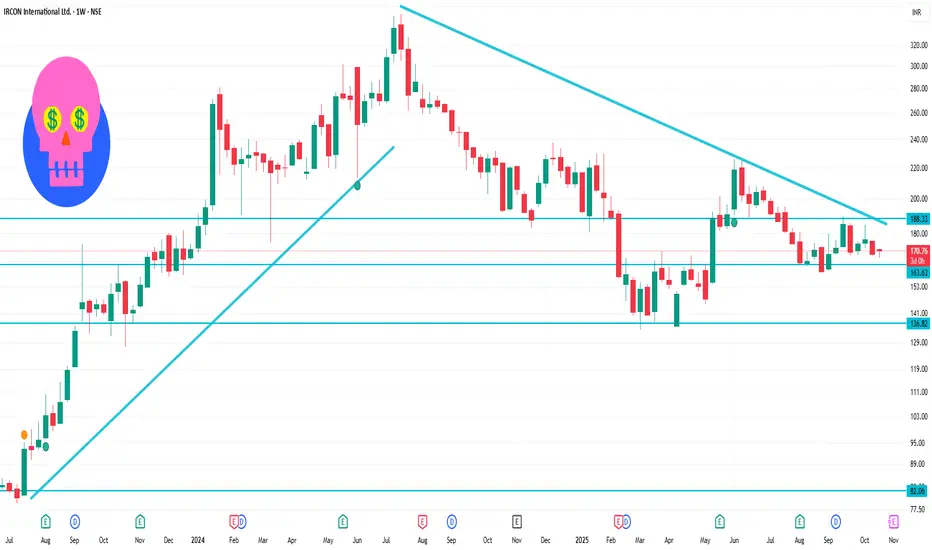
IRCON 1 Week Time Frame 📉 1-Week Performance
Current Price: ₹170.23
Weekly Change: Approximately -1.33%
Recent High: ₹175.30 on October 16
Recent Low: ₹167.30 on October 21
📊 Technical Indicators (Weekly)
Relative Strength Index (RSI): 57.79 — Neutral
Moving Average Convergence Divergence (MACD): 0.04 — Slightly Bearish
Commodity Channel Index (CCI): -283.04 — Bearish
Average Directional Index (ADX): 25.32 — Indicates a weak trend
Ultimate Oscillator: 63.31 — Neutral
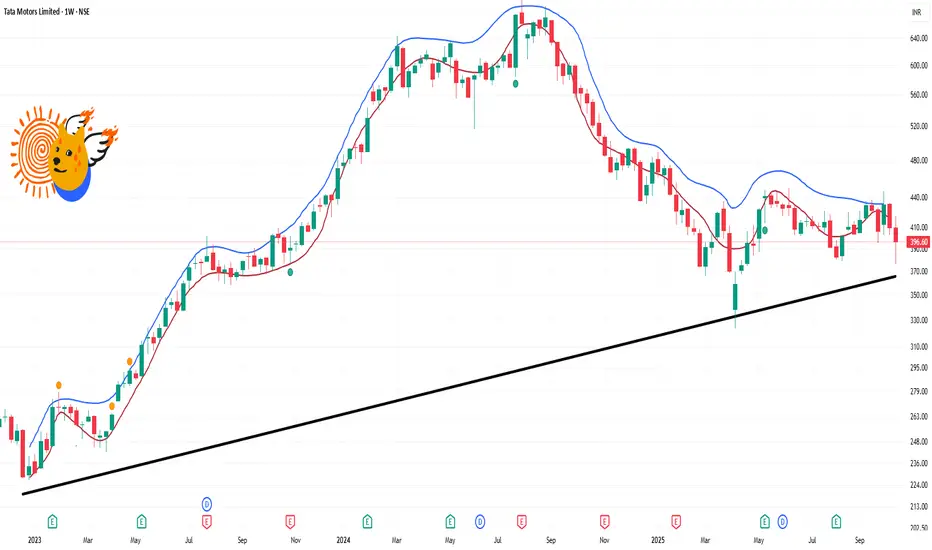
TATAMOTORS 1 Week Time Frame 📉 1-Week Price Movement
Current Price: ₹396.60
52-Week Range: ₹321.45 – ₹550.62
Recent Performance: The stock has experienced a significant decline of approximately 41.77% over the past week, largely due to the demerger of its commercial vehicle business.
📊 Technical Indicators (Weekly Overview)
Moving Averages: The stock is trading below key moving averages, indicating a bearish trend.
Relative Strength Index (RSI): The RSI is below 30, suggesting the stock is in oversold territory.
MACD: The MACD line is below the signal line, confirming a bearish momentum.
Stochastic Oscillator: The stochastic indicator is in the oversold zone, which may imply a potential reversal if buying interest returns.
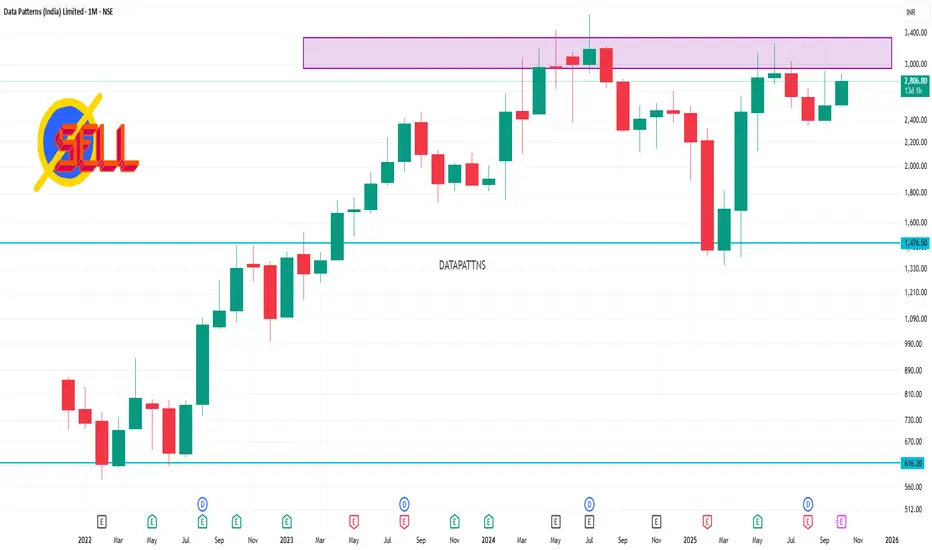
DATAPATTNS 1 Month Time Frame 📈 Current Stock Price
Price: ₹2,806.80
Day Range: ₹2,725.00 – ₹2,890.00
52-Week Range: ₹1,351.15 – ₹3,268.80
Market Cap: ₹15,714 crore
P/E Ratio (TTM): 73.2
Dividend Yield: 0.28%
ROE: 15.2%
ROCE: 21.0%
Debt-to-Equity: 0.00%
🔍 Technical Indicators (1-Month Time Frame)
RSI (14): 59.67 – Indicates neutral momentum.
MACD: 18.4 – Suggests bullish momentum.
Stochastic Oscillator: 64.93 – Indicates bullish trend.
CCI (14): 71.77 – Suggests bullish momentum.
ADX (14): 37.85 – Indicates strong trend strength.
Pivot Points (Classic):
R1: ₹2,837.36
R2: ₹2,848.03
R3: ₹2,857.16
S1: ₹2,808.43
S2: ₹2,797.76
S3: ₹2,797.76
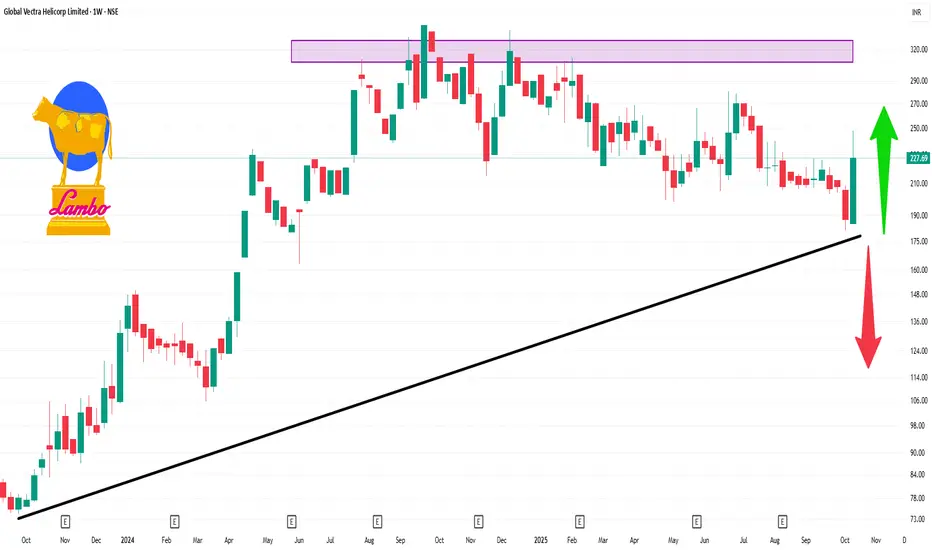
GLOBALVECT 1 Week Time Frame 📈 1-Week Price Movement
Current Price: ₹227.69 (as of October 17, 2025)
Weekly Range: ₹225.21 – ₹248.00
Weekly Change: +21.34%
🔍 Technical Indicators (Weekly Timeframe)
RSI (14): 58.97 – Indicates a neutral to slightly bullish trend.
MACD: 8.09 – Suggests bullish momentum.
Stochastic Oscillator: 46.76 – Neutral, neither overbought nor oversold.
Bollinger Bands: Upper Band: ₹262.49; Lower Band: ₹184.92; 20-day SMA: ₹223.70 – Indicates potential for further price movement within this range.
Moving Averages: Short-term averages are in an "outperform" zone, suggesting a bullish trend.
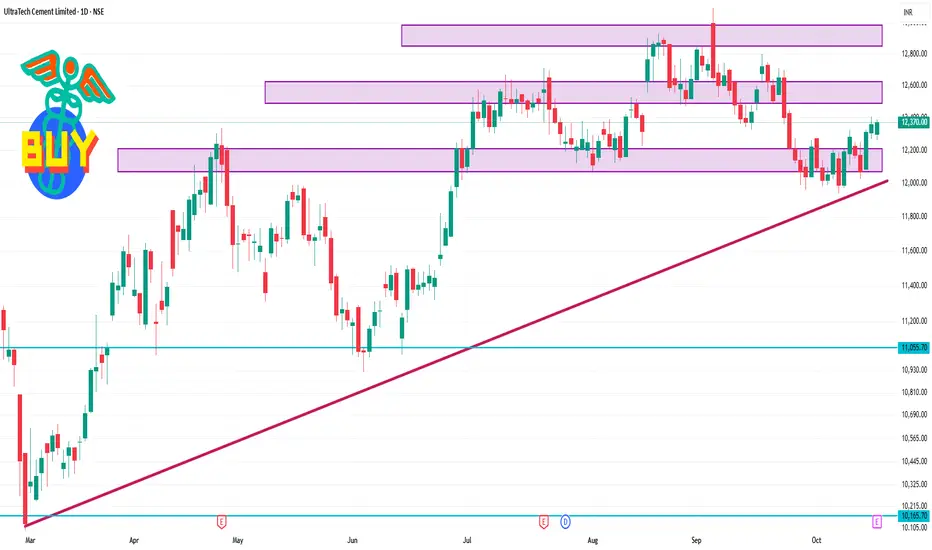
ULTRACEMCO 1 Day Time Frame 📊 Intraday Support & Resistance Levels
Level Type Price (₹)
Current Price 12,370.00
Immediate Support 12,268.00
Short-Term Support 12,140.60
Short-Term Resistance 12,289.70
Immediate Resistance 12,409.00
Upper Intraday Target 12,450.00
These levels are derived from recent technical analyses and intraday price movements.
📈 Technical Indicators
RSI (14): 52.90 – Indicates neutral momentum.
MACD: -42.61 – Suggests bearish momentum.
Stochastic Oscillator: 56.14 – Neutral, indicating no immediate overbought or oversold conditions.
Super Trend: 12,617.76 – Mildly bearish.
Parabolic SAR: 12,268.00 – Mildly bullish
🔍 Trade Strategy
Bullish Scenario: A breakout above ₹12,409 with strong volume could target ₹12,450.
Bearish Scenario: A drop below ₹12,268 may lead to a test of ₹12,140.
RELIANCE 1 Day Time Frame 📈 Daily Support & Resistance Levels
Immediate Support: ₹1,399.10
Key Resistance: ₹1,417.80
Pivot Point: ₹1,407.53
These levels are based on standard pivot point calculations and indicate that the stock is trading just below the immediate resistance level, suggesting potential for upward movement.
🔧 Technical Indicators
RSI (14-day): 62.51 — Neutral to slightly bullish
MACD: 0.730 — Positive momentum
Moving Averages:
5-day SMA: ₹1,373.00 — Buy signal
50-day SMA: ₹1,350.00 — Buy signal
200-day SMA: ₹1,300.00 — Buy signal
Stochastic Oscillator: 75.00 — Overbought, indicating potential for a pullback
Supertrend: ₹1,414.07 — Mildly bearish
Parabolic SAR: ₹1,357.52 — Mildly bullish
These indicators suggest a generally positive trend, with some caution due to overbought conditions.
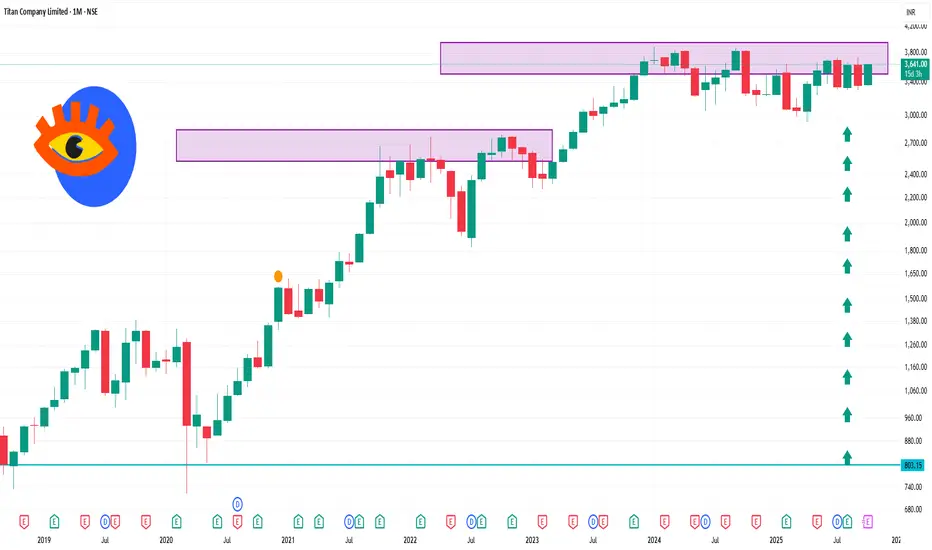
TITAN 1 Month Time Frame Titan Company Ltd is trading near ₹3,636.50, approaching its 52-week high of ₹3,740.
📊 1-Month Technical Overview
Price Performance: The stock has seen a modest decline of approximately 0.20% over the past month.
Technical Indicators:
Relative Strength Index (RSI): The RSI is currently in the neutral zone, indicating balanced buying and selling pressures.
Moving Averages: The stock is trading above its short-term moving averages, suggesting a positive short-term trend.
Stochastic Oscillator: The stochastic indicator is in the bullish zone, indicating potential upward momentum.
Commodity Channel Index (CCI): The CCI is above zero, signaling a bullish trend.
Rate of Change (ROC): The ROC is positive, further confirming bullish momentum.
Money Flow Index (MFI): The MFI is above 50, indicating healthy buying activity.
Support and Resistance Levels:
Support: ₹3,189.25
Resistance: ₹3,559.25
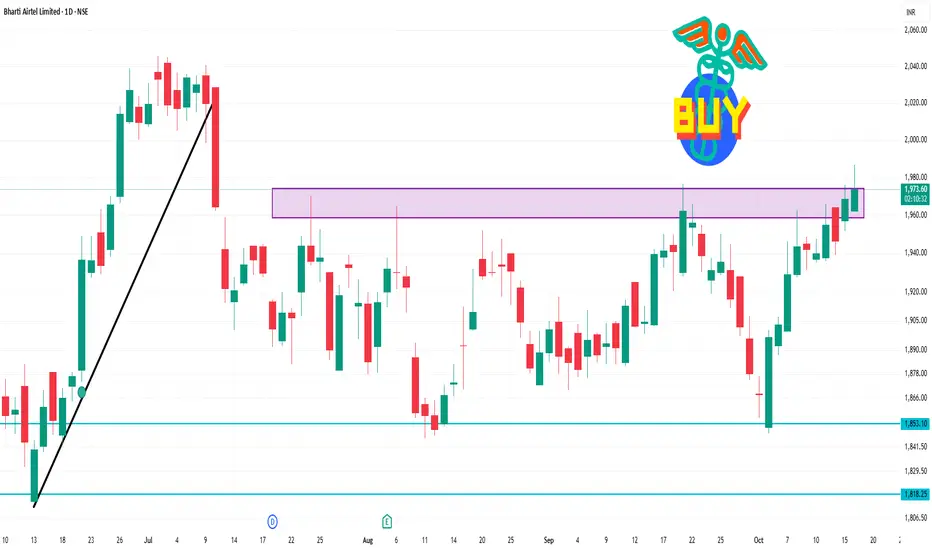
BHARTIARTL 1 Day Time Frame Bharti Airtel Limited is trading at ₹1,973.50, reflecting a 0.31% increase from the previous close.
Technical Analysis Overview (1-Day Time Frame):
Trend: Neutral to mildly bullish
Support Levels: ₹1,900 – ₹1,895
Resistance Levels: ₹1,920 – ₹1,925 and ₹1,950 – ₹1,960
Key Technical Indicators:
Moving Averages: All major moving averages (20-day, 50-day, 200-day) are bullish, indicating upward momentum.
Relative Strength Index (RSI): At 55.9, suggesting a neutral stance, neither overbought nor oversold.
Commodity Channel Index (CCI): At -214.32, indicating a bullish condition.
Momentum Oscillator: Positive, reinforcing the bullish outlook.
Average Directional Index (ADX): At 20.28, suggesting a neutral trend strength.
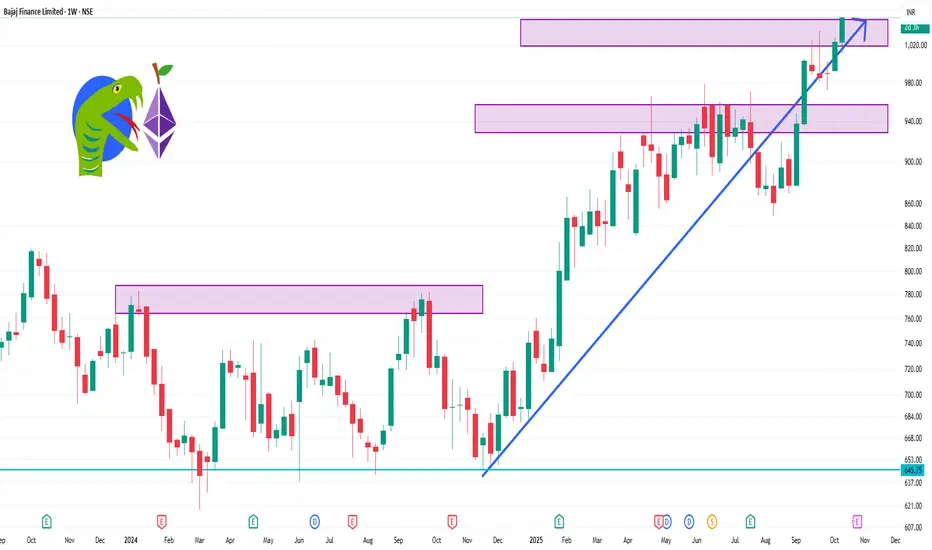
BAJFINANCE 1 Week Time Frame 📈 Weekly Technical Levels
Resistance Levels: ₹1,036.75 (short-term), ₹1,023.85 (mid-term)
Support Levels: ₹1,009.85 (short-term), ₹938 (mid-term), ₹816.86 (long-term)
These levels suggest that the stock is trading above its key support zones, indicating a potential continuation of the uptrend.
🔧 Key Technical Indicators
RSI (14): 66.57 — approaching overbought territory, but still room for upward movement.
MACD: 20.92 — indicates bullish momentum.
ADX (14): 31.50 — suggests a strong trend.
Supertrend: ₹973.61 — currently bullish.
Parabolic SAR: ₹982.79 — supports the bullish trend.
Stochastic Oscillator: 84.34 — near overbought levels, indicating potential for a pullback.
Commodity Channel Index (CCI): +131.56 — suggests the stock is overbought.
These indicators collectively point towards a strong bullish trend, though caution is advised as some indicators approach overbought conditions.
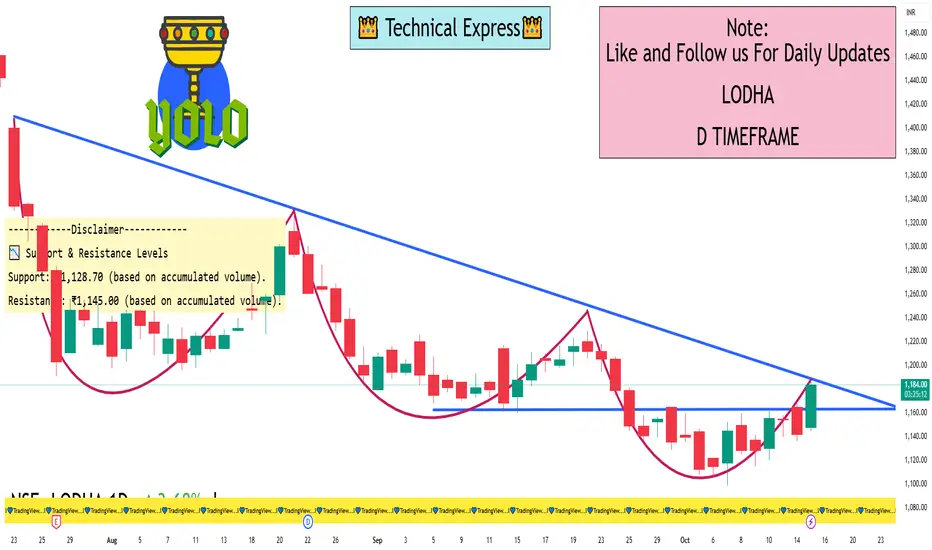
LODHA 1 Day View 📈 Current Price & Trend
Current Price: ₹1,184.90
Day's Range: ₹1,136.50 – ₹1,168.00
Previous Close: ₹1,142.00
Price Change: +₹42.90 (+3.77%)
The stock has shown a positive movement today, indicating a potential short-term bullish trend.
🔍 Technical Indicators
RSI (14-day): Approximately 51, suggesting a neutral momentum with no immediate overbought or oversold conditions.
MACD: Currently below the signal line, indicating a bearish short-term momentum.
Moving Averages:
Short-term (14-day): Currently above the long-term (200-day) moving average, suggesting a bullish short-term trend.
Long-term (200-day): The price is trading below the long-term moving average, indicating a bearish long-term trend.
Stochastic Oscillator: Reading between 45 and 55, suggesting a neutral market condition.
📌 Support & Resistance Levels
Support: ₹1,128.70 (based on accumulated volume)
Resistance: ₹1,145.00 (based on accumulated volume)
📊 Trading Outlook
The stock is expected to trade within a range of ₹1,126.95 to ₹1,157.05, with a potential move of ±2.67% from the last closing price.
⚠️ Risk & Outlook
Risk: Medium, with average daily volatility of approximately 2.77%.
Outlook: The stock is showing a neutral to slightly bullish short-term outlook, with mixed signals from various indicators. Traders should monitor key support and resistance levels around ₹1,128.70 and ₹1,145.00, respectively.