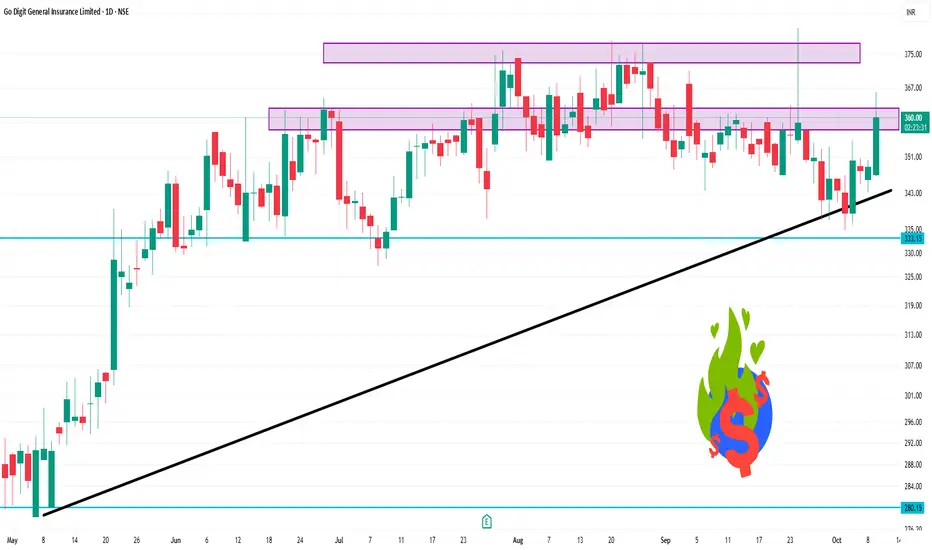
GODIGIT 1 Day Time Frame📊 Intraday Price Movement
Day’s Range: ₹346.65 – ₹350.15
Opening Price: ₹347.10
Closing Price (Previous Day): ₹348.80
Volume Traded: Approximately 55,201 shares
📈 Technical Indicators (1-Day Time Frame)
Relative Strength Index (RSI): 35.92 — indicates a neutral stance
Moving Averages:
5-Day EMA: ₹343.23 (Sell)
10-Day EMA: ₹346.88 (Sell)
20-Day EMA: ₹350.54 (Sell)
50-Day EMA: ₹351.97 (Sell)
100-Day EMA: ₹345.69 (Sell)
200-Day EMA: ₹334.59 (Buy)
MACD: -3.83 — suggests a potential buying opportunity
Commodity Channel Index (CCI): -206.91 — indicates a buying signal
Ultimate Oscillator: 28.51 — suggests a sell signal
Price Rate of Change (ROC): -5.88 — indicates a downward trend
🔍 Summary
The stock is exhibiting a neutral to slightly bearish trend in the short term, with several moving averages signaling a sell. However, indicators like MACD and CCI suggest potential buying opportunities. Investors should monitor for a sustained break above ₹350.00 for a more bullish outlook.
Search in ideas for "oscillator"
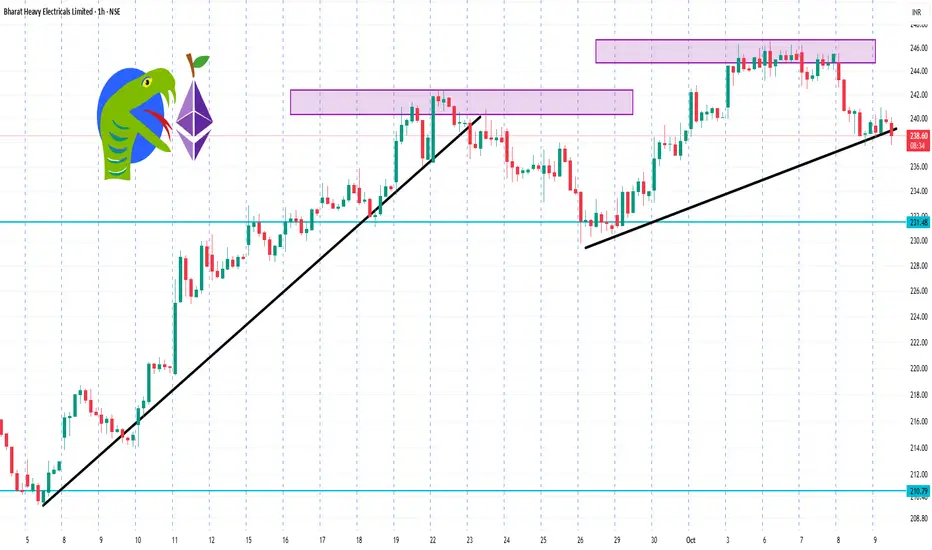
BHEL 1 Hour Time Frame 📉 1-Hour Technical Analysis Summary
Overall Signal: Strong Sell
Relative Strength Index (RSI): 41.43 — approaching oversold territory
MACD: -0.58 — indicating downward momentum
Stochastic Oscillator: 21.78 — confirming bearish bias
Average Directional Index (ADX): 54.36 — suggesting a strong trend
Williams %R: -76.66 — indicating oversold conditions
Commodity Channel Index (CCI): -68.24 — supporting bearish outlook
Pivot Levels:
Support: S1 = ₹238.45
Resistance: R1 = ₹240.85
These indicators collectively suggest a continuation of the current downtrend.
🔍 Key Price Levels
Intraday Support: ₹236.19
Intraday Resistance: ₹243.64
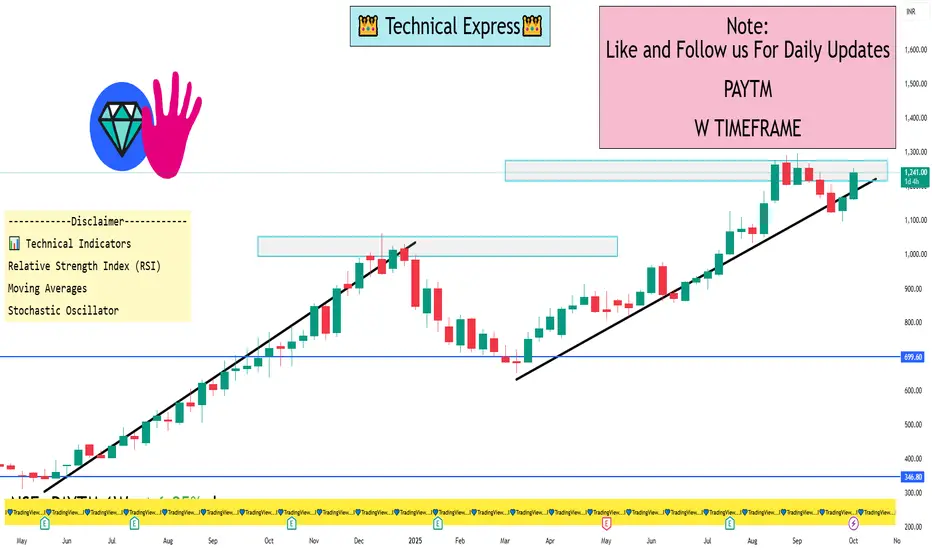
PAYTM 1 Week View 📈 Current Price Snapshot
Latest Price: ₹1,241.50
Day's Range: ₹1,224.30 – ₹1,247.80
52-Week Range: ₹651.50 – ₹1,296.60
🔧 Key Technical Levels (1-Week Timeframe)
Resistance Levels:
₹1,247.80 – Recent intraday high
₹1,288.30 – Near-term resistance zone
Support Levels:
₹1,224.30 – Recent intraday low
₹1,119.00 – Short-term support
📊 Technical Indicators
Relative Strength Index (RSI): 57.67 – Indicates bullish momentum without being overbought.
Moving Averages: Both short-term and long-term moving averages are in a bullish alignment, supporting the positive trend.
Stochastic Oscillator: In the bullish zone, suggesting continued upward momentum.
🧭 Summary
The stock is currently trading near its recent intraday high, indicating strong bullish momentum. With RSI and moving averages supporting the uptrend, PAYTM appears poised to test higher resistance levels in the near term. However, investors should monitor the stock's movement near the resistance level of ₹1,288.30 for potential breakout or reversal signals.
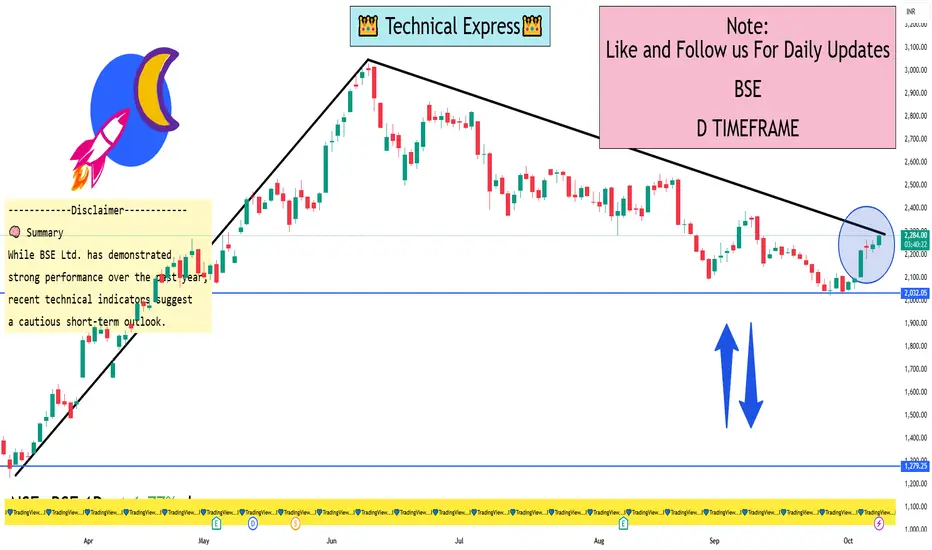
BSE 1 Day View📈 Daily Technical Indicators
RSI (14-day): 57.72 — Indicates a neutral to bullish momentum.
MACD: -19.21 — Suggests mild bearishness.
Stochastic Oscillator: 83.13 — Approaching overbought territory, implying caution.
Average True Range (ATR): Indicates low volatility, suggesting a stable trading environment.
ADX (14-day): 26.07 — Reflects a moderately strong trend.
🔄 Short-Term Outlook
On the 1-hour chart, BSE Ltd. is exhibiting a "Strong Sell" signal across both technical indicators and moving averages. This suggests a prevailing short-term downtrend, with the stock trading below its key moving averages.
📊 Key Levels to Watch
Support Levels: ₹2,230 (recent low) and ₹2,121 (intraday low).
Resistance Levels: ₹2,281 (recent high) and ₹2,300 (target price set by IIFL Capital).
🧠 Summary
While BSE Ltd. has demonstrated strong performance over the past year, recent technical indicators suggest a cautious short-term outlook. Traders should monitor key support and resistance levels closely and consider market conditions before making investment decisions.
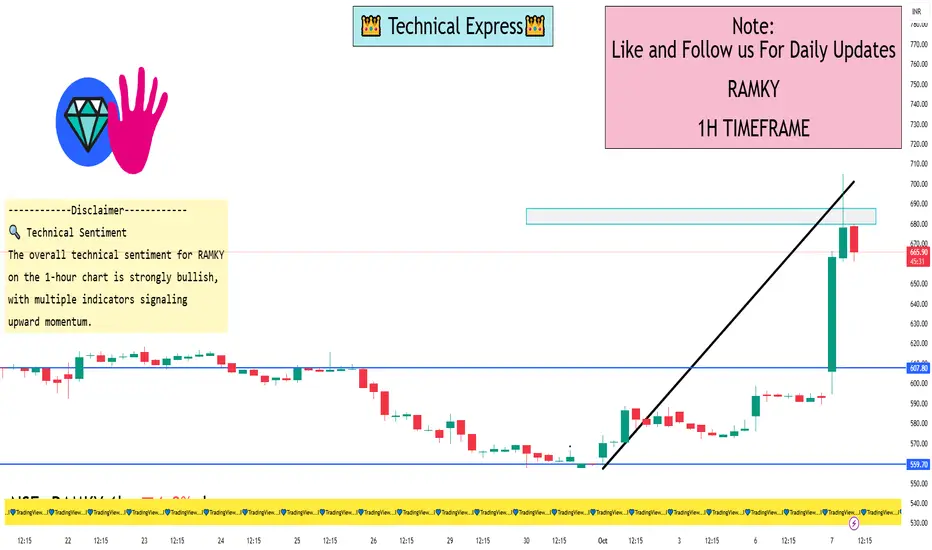
RAMKY 1 Hour View 📈 1-Hour Intraday Technical Overview
Based on the latest intraday data, here's a snapshot of RAMKY's performance:
Current Price: ₹687.10
Daily Range: ₹594.40 – ₹705.00
Volume: Approximately 6.4 million shares
RSI (Relative Strength Index): 73.06 (indicating overbought conditions)
MACD (Moving Average Convergence Divergence): 11.03 (bullish momentum)
ADX (Average Directional Index): 23.81 (moderate trend strength)
Supertrend Indicator: ₹560.31 (suggesting an upward trend)
Parabolic SAR: ₹557.45 (supporting bullish trend)
Rate of Change (ROC): 14.39% (indicating strong momentum)
Chaikin Money Flow (CMF): 0.358 (positive accumulation)
Williams %R: -12.13 (approaching overbought territory)
Stochastic Oscillator: 36.47 (neutral, with potential for upward movement)
🔍 Technical Sentiment
The overall technical sentiment for RAMKY on the 1-hour chart is strongly bullish, with multiple indicators signaling upward momentum. However, the high RSI suggests that the stock may be approaching overbought levels, indicating a potential for short-term consolidation or pullback.
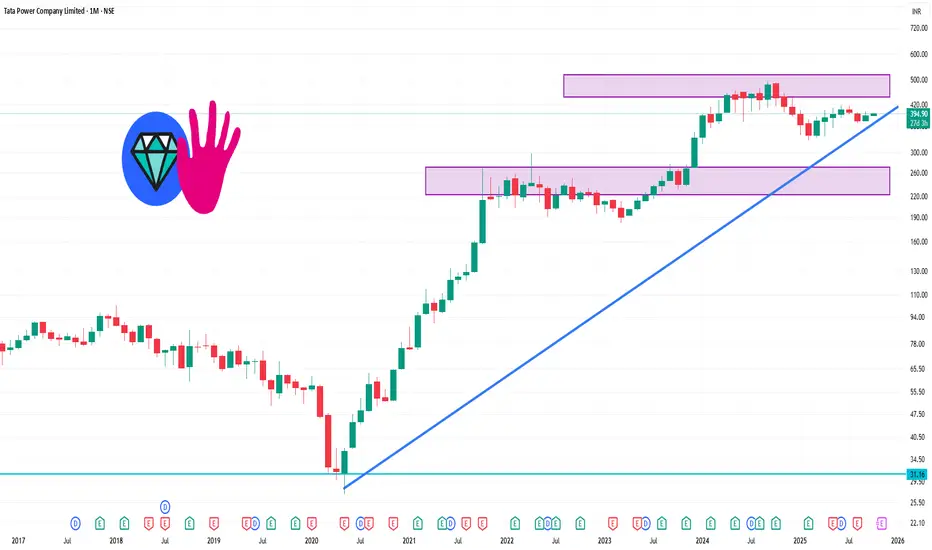
TATAPOWER 1 Month Time frame 📊 1-Month Technical Overview
Over the past month, the stock has shown a modest upward movement of approximately 1.90%
TradingView
.
🔄 Pivot Points (Monthly)
Support Levels: ₹387.57, ₹375.23, ₹361.82
Resistance Levels: ₹413.32, ₹426.73, ₹440.14
The central pivot point stands at ₹400.98
📊 Technical Indicators
Relative Strength Index (RSI): 56.79 (Neutral)
Moving Average Convergence Divergence (MACD): 0.06 (Bullish)
Commodity Channel Index (CCI): -482.5 (Bullish)
Ultimate Oscillator: 80.16 (Bullish)
Simple Moving Averages (SMA): 20-day: ₹394.82, 50-day: ₹394.90, 200-day: ₹393.54 (All Bullish)
Exponential Moving Averages (EMA): 20-day: ₹394.92, 50-day: ₹394.79, 200-day: ₹393.68 (All Bullish)
🧠 Summary
Tata Power's stock is exhibiting a bullish trend over the past month, supported by positive technical indicators and sustained upward momentum. The current price is approaching key resistance levels, suggesting potential for further gains if these levels are breached. However, investors should remain cautious of broader market conditions and sector-specific challenges that could impact performance.
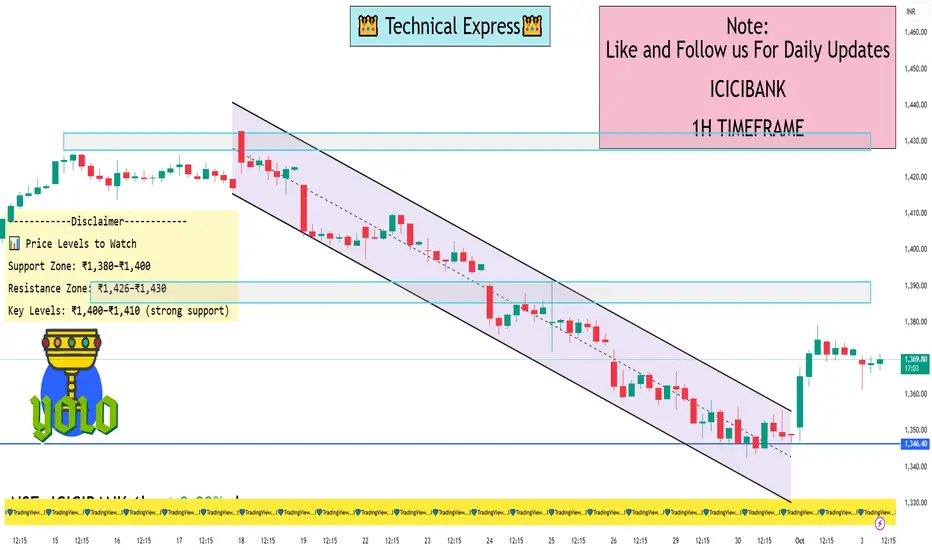
ICICIBANK 1 Hour View📊 1-Hour Timeframe: Key Levels
🔹 Support Levels
Immediate Support: ₹1,363.14
Key Support Zones: ₹1,352.93, ₹1,333.87
🔹 Resistance Levels
Immediate Resistance: ₹1,367.07
Key Resistance Zones: ₹1,385.23, ₹1,398.47
These levels are derived from standard pivot point calculations and are commonly used by traders to identify potential reversal points within the trading day.
📈 Technical Indicators (1-Hour Chart)
Relative Strength Index (RSI): 37.26 — indicates the stock is nearing oversold conditions, suggesting potential for a price rebound.
Moving Average Convergence Divergence (MACD): -16.11 — a negative value, which may indicate bearish momentum.
Average Directional Index (ADX): 23.81 — suggests a weak trend, implying indecision in the market.
Stochastic Oscillator: 13.21 — indicates the stock is oversold, potentially signaling a reversal.
Supertrend Indicator: ₹1,398.34 — indicates a bearish trend.
These indicators collectively suggest a bearish short-term outlook, with potential for a reversal if support levels hold.
📊 Price Levels to Watch
Support Zone: ₹1,380–₹1,400
Resistance Zone: ₹1,426–₹1,430
Key Levels: ₹1,400–₹1,410 (strong support)
🔄 Summary
ICICI Bank Ltd. is currently trading near its support levels on the 1-hour chart. The RSI indicates potential oversold conditions, while other indicators suggest a weak bearish trend. Traders should monitor the key support and resistance levels mentioned above for potential breakout or breakdown scenarios.
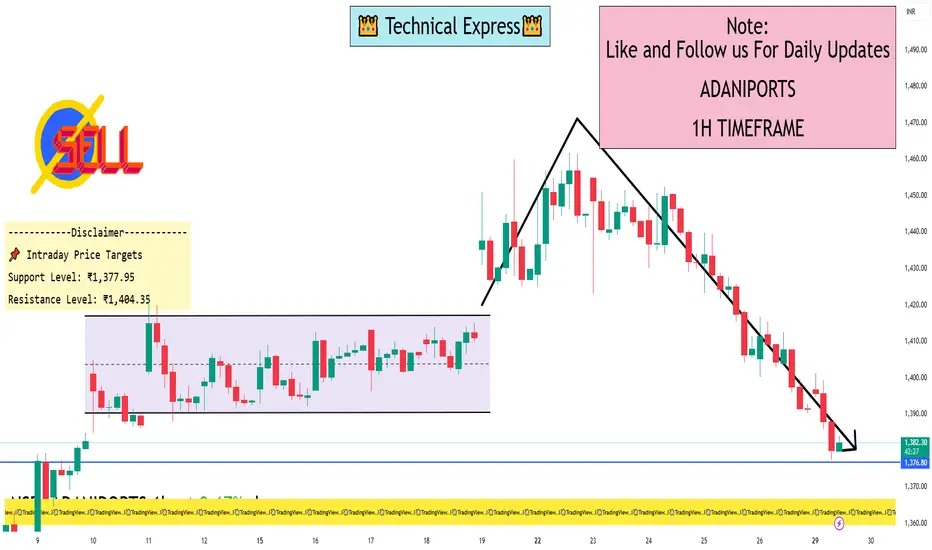
ADANIPORTS 1 Hour View📊 1-Hour Timeframe Technical Overview
Current Price: ₹1,392.00
Day’s Range: ₹1,390.30 – ₹1,416.70
Volume: ~1.9 million shares
Price Change: -1.08%
Technical Strength Index: Mild Bearish
📈 Key Indicators
Supertrend: 1460.9 (Mild Bearish)
Parabolic SAR: 1458.77 (Mild Bearish)
RSI (Relative Strength Index): Data not specified
MACD: Data not specified
ADX (Average Directional Index): Data not specified
Stochastic Oscillator: Data not specified
Rate of Change (ROC): Data not specified
Chaikin Money Flow (CMF): -0.05 (Bearish)
Williams %R: Data not specified
Pivot Levels: Data not specified
📌 Intraday Price Targets
Support Level: ₹1,377.95
Resistance Level: ₹1,404.35
🔍 Summary
Adani Ports is currently exhibiting a mild bearish trend on the 1-hour chart, with key indicators such as the Supertrend and Parabolic SAR suggesting downward momentum. The Chaikin Money Flow (CMF) is also negative, indicating potential selling pressure.
Intraday traders should monitor the support level at ₹1,377.95 and the resistance at ₹1,404.35. A break below support could signal further downside, while a move above resistance may indicate a reversal or continuation of the uptrend.
Please note that technical analysis is subject to market conditions and should be used in conjunction with other forms of analysis and risk management strategies.
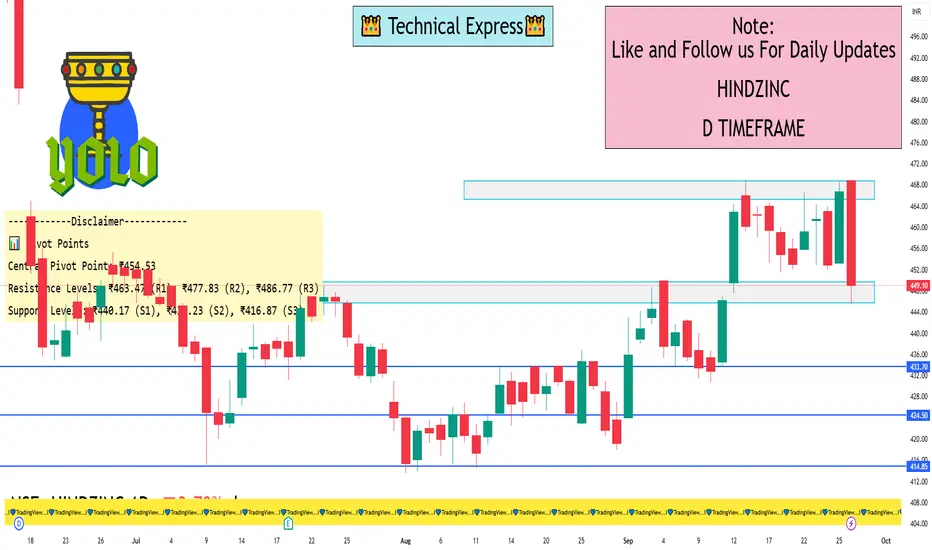
HINDZINC 1 Day View📊 Intraday Support & Resistance Levels
Immediate Support: ₹442.00 – A level where buyers have previously shown interest.
Immediate Resistance: ₹455.90 – A recent high that may act as a barrier to upward movement.
Additional Resistance Levels:
₹461.80
₹470.70
₹479.60
₹494.00
Additional Support Levels:
₹427.50
₹436.40
🔍 Technical Indicators
Relative Strength Index (RSI): Approximately 41.05, indicating a neutral to bearish momentum.
Moving Average Convergence Divergence (MACD): At -1.680, suggesting a bearish trend.
Average Directional Index (ADX): Around 21.33, indicating a weak trend strength.
Stochastic Oscillator: Approximately 63.96, pointing to neutral momentum.
⚠️ Trade Considerations
Bullish Scenario: If the price sustains above ₹442.00, there may be potential for a rebound towards ₹455.90.
Bearish Scenario: A drop below ₹442.00 could lead to further declines, possibly testing lower support levels.
📊 Pivot Points
Central Pivot Point: ₹454.53
Resistance Levels: ₹463.47 (R1), ₹477.83 (R2), ₹486.77 (R3)
Support Levels: ₹440.17 (S1), ₹431.23 (S2), ₹416.87 (S3)
📝 Outlook
Bullish Scenario: If the price sustains above ₹442.00, there may be potential for a rebound towards ₹455.90.
Bearish Scenario: A drop below ₹442.00 could lead to further declines, possibly testing lower support levels.
ADANIPOWER 1 Day View📈 Support & Resistance Levels
Classic Pivot Points:
Resistance: ₹151.20 (R1), ₹156.15 (R2), ₹159.40 (R3)
Support: ₹139.75 (S1), ₹143.00 (S2), ₹134.80 (S3)
Pivot Point: ₹147.95
Fibonacci Levels:
Resistance: ₹151.08 (R1), ₹153.02 (R2), ₹156.15 (R3)
Support: ₹142.88 (S1), ₹144.82 (S2), ₹139.75 (S3)
Pivot Point: ₹147.95
Camarilla Levels:
Resistance: ₹147.00 (R1), ₹147.75 (R2), ₹148.50 (R3)
Support: ₹144.00 (S1), ₹144.75 (S2), ₹145.50 (S3)
Pivot Point: ₹147.95
📊 Technical Indicators
RSI (14-day): 44.06 — Neutral to slightly bearish
MACD: -0.840 — Bearish trend
Moving Averages:
20-day EMA: ₹135.67 — Neutral
50-day EMA: ₹127.34 — Neutral
100-day EMA: ₹121.00 — Uptrend
200-day EMA: ₹116.62 — Uptrend
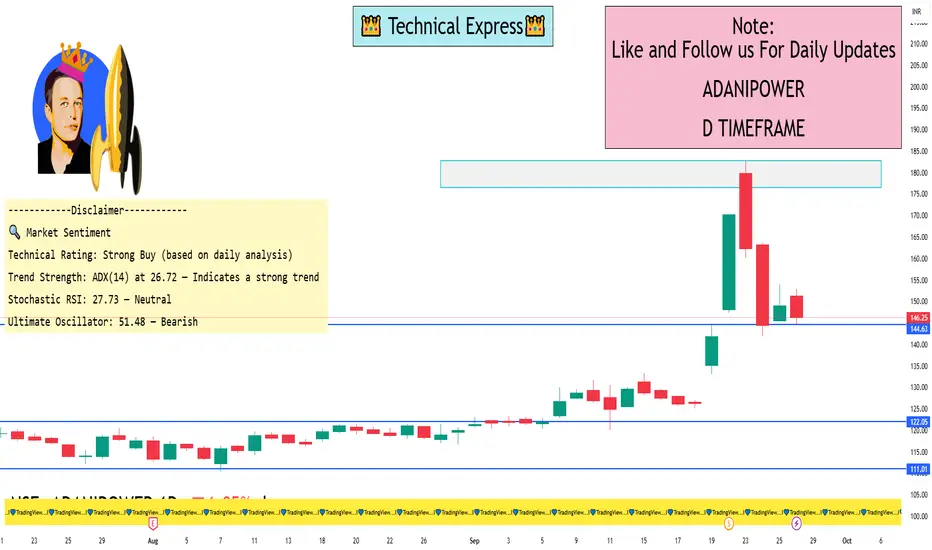
🔍 Market Sentiment
Technical Rating: Strong Buy (based on daily analysis)
Trend Strength: ADX(14) at 26.72 — Indicates a strong trend
Stochastic RSI: 27.73 — Neutral
Ultimate Oscillator: 51.48 — Bearish
📉 Recent Performance
Recent Decline: Adani Power reported a 15.5% decline in its first-quarter profit, with consolidated net earnings dropping to ₹33.05 billion from ₹39.13 billion the previous year. The decline is attributed to subdued power demand and increased coal import costs
📌 Conclusion
Adani Power is currently in a neutral to slightly bearish phase on the daily chart, with key support around ₹139.75 and resistance near ₹151.20. The technical indicators suggest a cautious outlook, with the RSI and MACD indicating a bearish trend. However, the strong trend strength (ADX) and positive moving averages indicate potential for upward movement if the stock breaks above resistance levels.
LT 1 Week View📊 Weekly Price Range (Sep 22–26, 2025)
High: ₹3,794.90
Low: ₹3,661.00
Closing Range: ₹3,642.15 – ₹3,731.10
Average Closing Price: ₹3,673.80
Trading Volume: Significantly above average, with 241,575 shares traded on September 26, compared to the 50-day average of 126,661 shares.
🔧 Technical Indicators
Relative Strength Index (RSI): Indicates bullish momentum.
Moving Averages: Both 50-day and 200-day moving averages suggest a positive trend.
MACD & Stochastic Oscillator: Both indicators are aligned with upward momentum.
Volume Delivery: High delivery volumes suggest strong investor confidence.
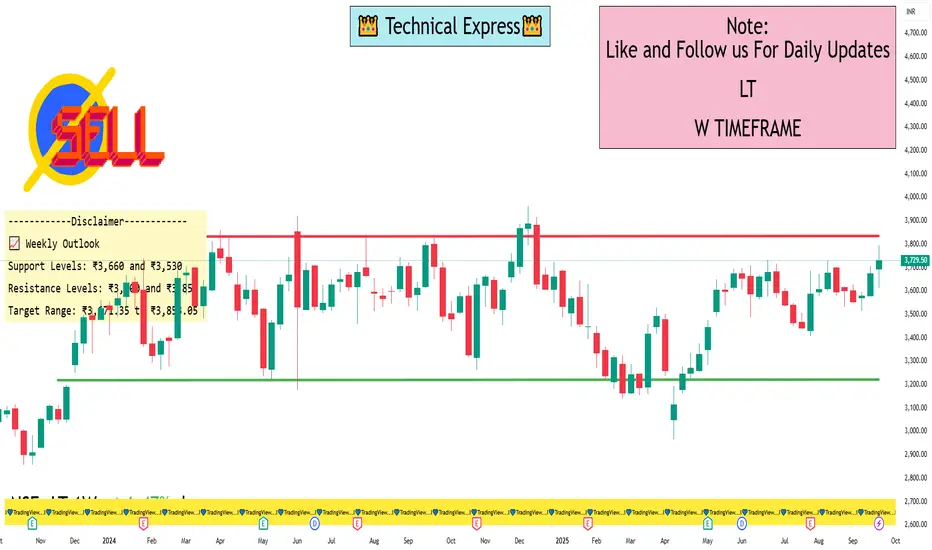
📈 Weekly Outlook
Support Levels: ₹3,660 and ₹3,530
Resistance Levels: ₹3,800 and ₹3,850
Target Range: ₹3,671.35 to ₹3,853.05
Bank Nifty 1 Hour View📊 Bank Nifty 1-Hour Time Frame Analysis
🔹 Current Market Snapshot
Closing Price (Sep 26, 2025): ₹54,389.35
Day's Range: ₹54,310.95 – ₹54,897.00
52-Week Range: ₹47,702.90 – ₹57,628.40
Trend: Neutral
🔹 Key Support and Resistance Levels
Opening Support/Resistance Zone: ₹54,935 – ₹54,971
Immediate Resistance: ₹55,167
Last Intraday Resistance: ₹55,368
Last Intraday Support: ₹54,698
Deeper Support: ₹54,545
🔹 Market Scenarios
Gap-Up Opening (200+ points):
A gap-up above ₹55,150–₹55,200 will immediately test the Opening Resistance at ₹55,167. Sustaining above this zone may extend the rally towards the last intraday resistance at ₹55,368.
A breakout above ₹55,368 could invite further bullish momentum.
However, if Bank Nifty fails to hold above ₹55,167, it may retrace back to the support zone around ₹54,971.
Educational Note: Gap-ups often invite early profit booking. Always confirm sustainability above resistance levels before initiating aggressive long trades.
Flat Opening (within ±200 points):
A flat start near ₹54,900–₹55,000 means Bank Nifty will trade directly around the Opening Support/Resistance Zone (₹54,935 – ₹54,971).
Holding above ₹54,971 will give buyers confidence to push towards ₹55,167 → ₹55,368.
A failure to sustain above this zone may drag the index down towards ₹54,698 and possibly ₹54,545.
Educational Note: Flat openings provide clearer setups as price tests both support and resistance zones naturally, giving traders better confirmation of direction.
Gap-Down Opening (200+ points):
A gap-down below ₹54,750 will put immediate pressure on Bank Nifty, exposing the Last Intraday Support at ₹54,698.
Use hourly candle close for stop-loss confirmation to prevent whipsaws.
Avoid naked options in high volatility; instead, use spreads (like Bull Call or Bear Put spreads) to limit premium decay.
Maintain a strict 1:2 risk-to-reward ratio.
Never chase trades out of emotion. Scale into trades gradually rather than going all-in at once.
📈 Technical Indicators Overview
Trend: Neutral
Moving Averages: Not specified
RSI (Relative Strength Index): Not specified
MACD (Moving Average Convergence Divergence): Not specified
Stochastic Oscillator: Not specified
Volume: Not specified
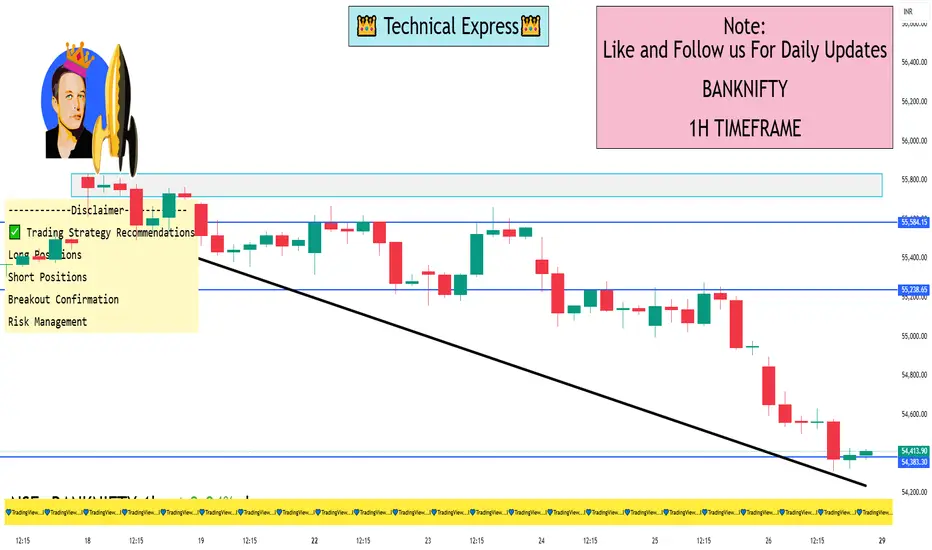
✅ Trading Strategy Recommendations
Long Positions: Consider initiating long positions if Bank Nifty sustains above ₹55,167, with a target towards ₹55,368.
Short Positions: Be cautious of short positions unless a clear breakdown below ₹54,698 is observed, with a subsequent target towards ₹54,545.
Breakout Confirmation: Always wait for confirmation (e.g., a 15-minute close) above or below key levels before entering trades.
Risk Management: Employ stop-loss orders to protect against adverse market movements.
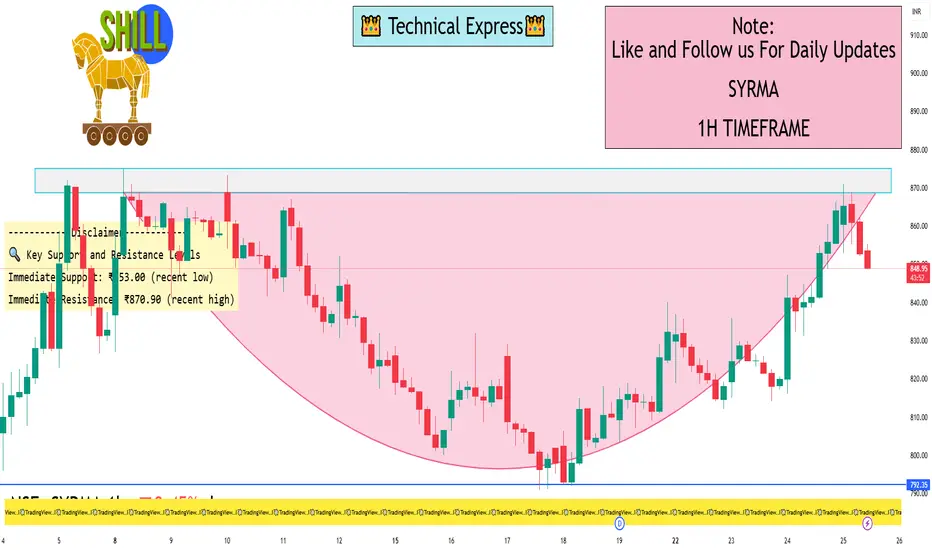
SYRMA 1 Hour View📈 1-Hour Time Frame Technical Overview
Based on recent intraday data, here’s a snapshot of SYRMA’s 1-hour technical indicators:
Relative Strength Index (RSI): 67.55, indicating bullish momentum.
Moving Average Convergence Divergence (MACD): 26.80, suggesting upward momentum.
Average Directional Index (ADX): 25.47, reflecting a moderately strong trend.
Stochastic Oscillator: 56.86, showing no overbought or oversold conditions.
Supertrend: ₹765.70, indicating a bullish trend.
Parabolic SAR (PSAR): ₹792.41, supporting the bullish trend.
Chaikin Money Flow (CMF): 0.110, suggesting accumulation of shares.
These indicators collectively point towards a bullish short-term trend for SYRMA.
🔍 Key Support and Resistance Levels
Immediate Support: ₹853.00 (recent low)
Immediate Resistance: ₹870.90 (recent high)
A breakout above ₹870.90 could signal further upside potential, while a dip below ₹853.00 might suggest a pullback.
For real-time intraday analysis on a 1-hour time frame, you can utilize the following platforms:
TradingView: Offers a comprehensive technical analysis overview, including indicators like RSI, MACD, and moving averages
Chartink: Provides customizable candlestick charts with various time frames and technical indicators
Investing.com: Features candlestick charts with pattern recognition and technical indicators
TopStockResearch: Delivers interactive charts with real-time updates and technical analysis tools
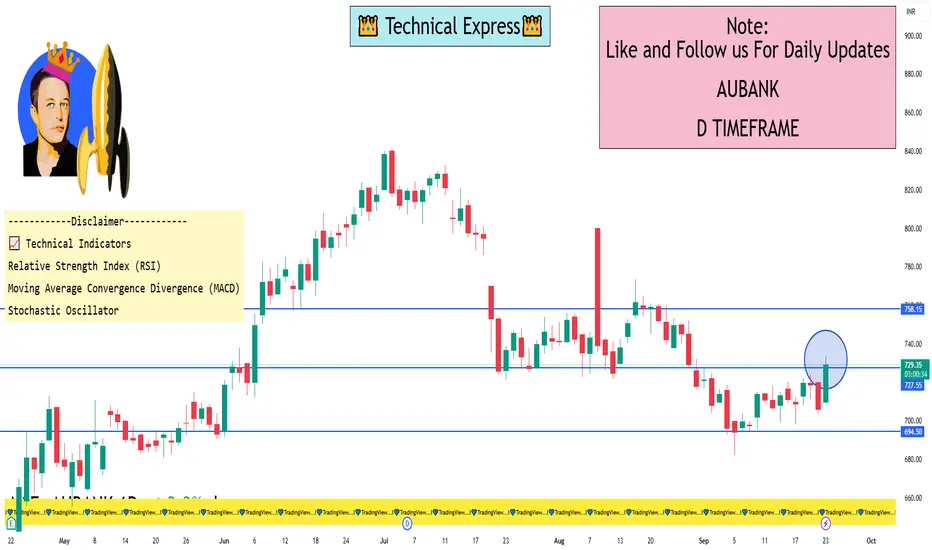
AUBANK 1 Day View📊 Intraday Technical Levels (1-Day Time Frame)
Based on pivot point analysis and Fibonacci retracements, here are the key support and resistance levels for today:
🔹 Standard Pivot Points
Support Levels: S1: ₹709.93, S2: ₹693.88, S3: ₹683.92
Resistance Levels: R1: ₹725.98, R2: ₹732.07
🔹 Camarilla Pivot Points
Support Levels: S3: ₹701.64, S2: ₹703.11, S1: ₹704.58
Resistance Levels: R1: ₹707.52, R2: ₹708.99, R3: ₹710.46
🔹 Fibonacci Retracement Levels
Support Levels: S1: ₹700.01, S2: ₹693.06
Resistance Levels: R1: ₹719.85, R2: ₹725.72
🔹 Woodie's Pivot Points
Support Levels: S1: ₹698.02, S2: ₹692.91
Resistance Levels: R1: ₹708.96, R2: ₹714.08
🔹 Demark Pivot Points
Support Levels: S1: ₹696.92
Resistance Levels: R1: ₹712.98
📈 Technical Indicators
Relative Strength Index (RSI): Currently at 60, indicating a bullish trend with room for further upside.
Moving Average Convergence Divergence (MACD): The MACD line is above the signal line, suggesting upward momentum.
Stochastic Oscillator: Reading between 55 and 80, indicating a bullish condition.
🔍 Summary
AU Small Finance Bank Ltd is exhibiting a bullish trend in the 1-day time frame, trading above key pivot levels. The RSI and MACD indicators support this positive outlook. Traders may consider monitoring the stock for potential breakout opportunities above resistance levels.
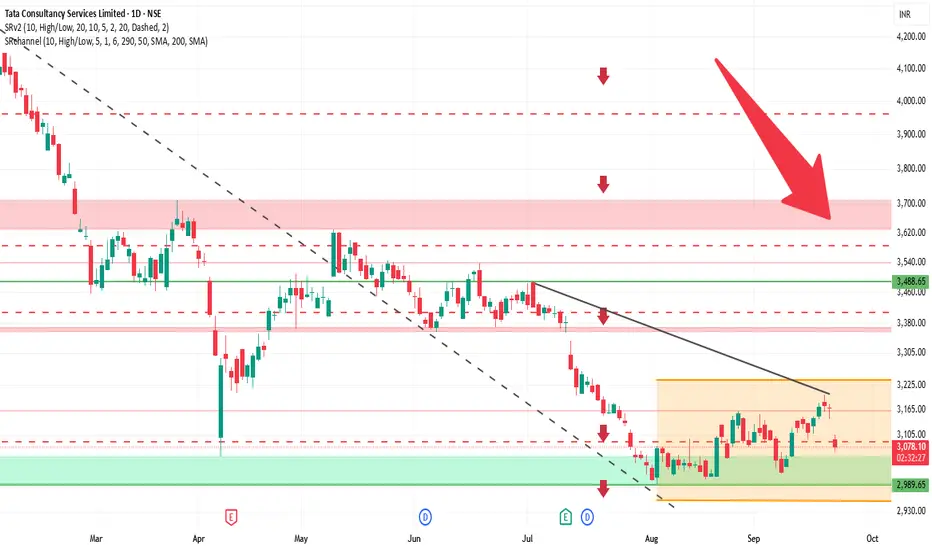
TCS 1D Time frame🔍 Current Price & Context
Trading around ₹3,089
Day’s range: ₹3,065 – ₹3,107
Previous close: ₹3,171
Market sentiment: Bearish, influenced by external factors affecting IT stocks.
📊 Technical Indicators
Moving Averages: Short-term averages are slightly above current price, acting as resistance.
RSI (14): ~30, indicating oversold conditions.
MACD: Negative, showing bearish momentum.
Stochastic Oscillator: Oversold, may suggest a short-term reversal.
CCI (20): Below zero, confirming bearish trend.
ROC (20): Negative, indicating declining momentum.
🧮 Strategy / Trade Ideas
Long Setup:
Entry near support (~3,050) if bullish reversal appears
Stop Loss: Below 3,000
Targets: 3,100 first, then 3,150
Short / Pullback Setup:
Entry if price fails near resistance (~3,100)
Stop Loss: Above 3,150
Targets: 3,050 first, then 3,000
✅ Summary
TCS on daily chart is bearish but oversold. Watch immediate support (~3,050) for potential reversal, and resistance (~3,100 – 3,120) for pullback risk. A breakout above resistance could target 3,150+, while failure of support may lead toward 3,000.
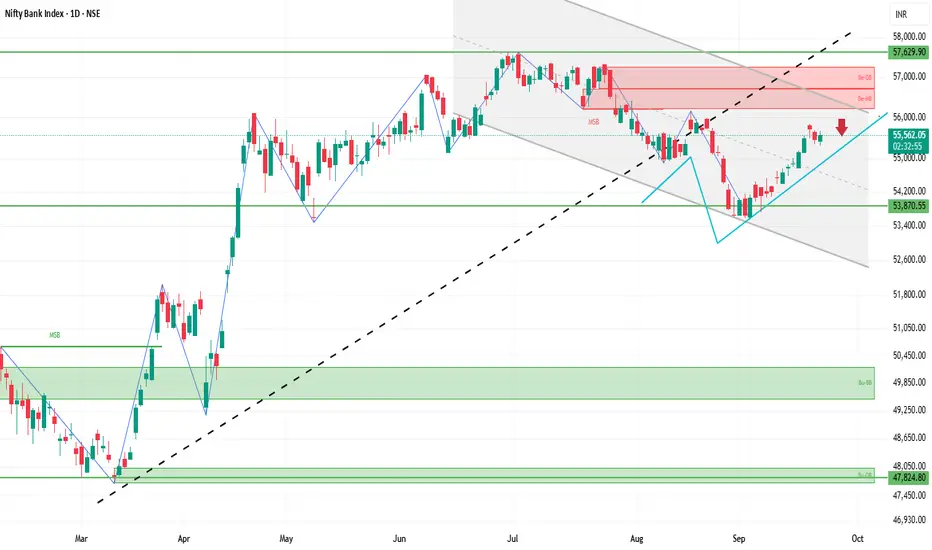
BANKNIFTY 1D Time frame🔍 Current Market Snapshot
Current Level: ₹55,541.30
Day’s Range: ₹55,315.55 – ₹55,666.35
52-Week Range: ₹47,702.90 – ₹57,628.40
Previous Close: ₹55,458.85
Market Sentiment: Neutral to mildly bearish
📊 Technical Indicators
Moving Averages: The BANKNIFTY index is trading slightly below its short-term moving averages, indicating potential resistance.
RSI (14): Approximately 50, suggesting a neutral stance with no clear overbought or oversold conditions.
MACD: Neutral, with the MACD line and signal line close together, indicating indecision in market momentum.
Stochastic Oscillator: Neutral, fluctuating around the midline, reflecting a lack of strong directional movement.
🧮 Strategy / Trade Ideas
Long Setup:
Entry: Consider entering near support levels (~₹55,300) if bullish reversal signals appear.
Stop Loss: Place below ₹54,800 to manage risk.
Target: First resistance around ₹55,800, then ₹56,200.
Short Setup:
Entry: If price fails to break above resistance (~₹55,800) and shows signs of reversal.
Stop Loss: Above ₹56,300.
Target: Downside toward ₹55,300, then ₹54,800.
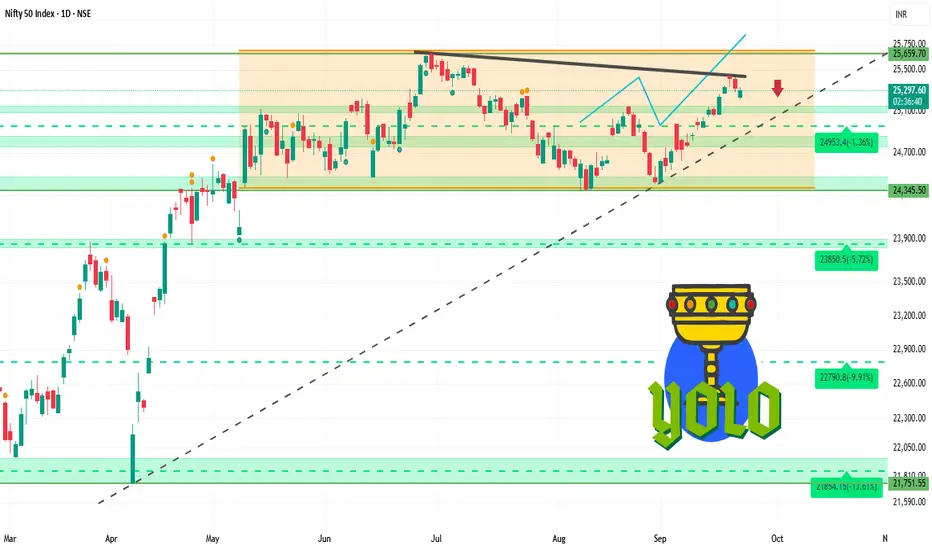
NIFTY 1D Time frame🔍 Current Market Snapshot
Current Level: ₹25,292.45
Day’s Range: ₹25,211.60 – ₹25,331.70
Previous Close: ₹25,327.05
Market Sentiment: Neutral to mildly bearish
📊 Technical Indicators
Moving Averages: The Nifty 50 index is trading slightly below its short-term moving averages, indicating potential resistance.
RSI (14): Approximately 50, suggesting a neutral stance with no clear overbought or oversold conditions.
MACD: Neutral, with the MACD line and signal line close together, indicating indecision in market momentum.
Stochastic Oscillator: Neutral, fluctuating around the midline, reflecting a lack of strong directional movement.
🧮 Strategy / Trade Ideas
Long Setup:
Entry: Consider entering near support levels (~₹25,200) if bullish reversal signals appear.
Stop Loss: Place below ₹24,800 to manage risk.
Target: First resistance around ₹25,400, then ₹25,700.
Short Setup:
Entry: If price fails to break above resistance (~₹25,400) and shows signs of reversal.
Stop Loss: Above ₹25,800.
Target: Downside toward ₹25,200, then ₹24,900.
INFY 1D Time frame📍 Current Price Action
Current Price: ~₹1,509
Day Change: about –1.5%
Daily Range: ₹1,500 – ₹1,515
⚙ Technical Indicators
RSI (14): ~57–60 → neutral to mildly bullish momentum
MACD: Positive → signals upward bias
Stochastic Oscillator: Near oversold zone → indicates possible bounce
ADX (14): ~26 → moderate trend strength
Money Flow Index (MFI): Mid-range → no extreme buying/selling pressure
📊 Moving Averages
Short-term (5, 10-day): Price trading slightly below → short-term weakness
Medium to Long-term (50, 100, 200-day): Price still above → long-term structure supportive
📉 Support & Resistance
Immediate Support: ~₹1,500
Next Support: ~₹1,480 – ₹1,470
Immediate Resistance: ~₹1,512 – ₹1,515
Breakout Target (if above resistance): ~₹1,530 – ₹1,540
🧠 Summary
INFY is neutral to mildly bullish on the daily chart. Support at ₹1,500 is crucial — holding above it keeps momentum intact. If the stock breaks above ₹1,515, it can push toward ₹1,530–1,540. On the downside, breaking below ₹1,500 may invite weakness toward ₹1,480–1,470.

SENSEX 1D Time frame📍 Current Price Action
Current Level: 81,548
Day’s Range: ~80,320 – 81,550
52-Week Range: 71,425 – 85,978
⚙ Technical Indicators
RSI (14): Around 43 → neutral to slightly bearish zone
MACD: Negative → mild downward pressure still visible
ADX (14): ~35-40 → moderate trend strength
Stochastic Oscillator: Near overbought zone → possible short-term pullback
Moving Averages:
Short-term (5, 10, 20-day): Mixed
Medium & long-term (50, 100, 200-day): Acting as resistance near highs
📊 Key Levels
Immediate Support: 80,800 – 81,000 zone
Immediate Resistance: 81,600 – 81,800 zone
Breakout Levels:
Above 81,800 → upside momentum could target 82,200+
Below 80,800 → downside may test 80,300 – 80,000
🧠 Summary
Sensex is currently at 81,548, near its resistance zone. Trend is neutral to mildly bullish in the short-term. Sustaining above 81,600–81,800 will confirm strength for further rally. A failure to hold could trigger a pullback toward 80,800–80,300.

BANKNIFTY 1D Time frame📍 Current Price Action
Level: ~54,670
Day’s Range: 54,402 – 54,757
52-Week Range: 47,703 – 57,628
⚙ Technical Indicators
RSI (14): ~60 → bullish momentum, not overbought yet
MACD: Positive → supports uptrend
Moving Averages:
Short-term (5, 10, 20-day): Bullish signals
Medium-term (50, 100-day): Supportive of trend
Long-term (200-day): Slight resistance near current level
Stochastic Oscillator: In overbought zone → strong momentum but risk of pullback
📊 Support & Resistance
Immediate Support: ~54,400
Immediate Resistance: ~54,750 – 55,000
Pivot Point: ~54,550
🧠 Summary
Bank Nifty is in a bullish short-term trend. Holding above 54,400 keeps momentum positive, while a breakout above 55,000 could open room for more upside. If resistance holds, the index may consolidate or retest lower supports.

NIFTY 1D Time frame📍 Current Price Action
Trading around 25,005 – 25,010
Day change: about +0.4%
⚙ Technical Indicators
Moving Averages (5, 10, 20, 50, 100, 200 day): All showing buy signals → bullish structure
RSI (14): In bullish territory, not overbought → healthy momentum
Stochastic Oscillator: Near overbought zone → indicates strength, but chance of a short pullback
MACD: Positive crossover → supports upward momentum
📊 Support & Resistance
Immediate Resistance: 25,000 – 25,100 zone
Immediate Support: 24,800 – 24,900 zone
If price sustains above 25,100 → next upside levels can open higher (towards 25,200+)
If it breaks below 24,900 → downside could test 24,700 levels
🧠 Summary
Nifty 50 is in a bullish daily trend, currently consolidating near psychological resistance at 25,000. As long as it holds above 24,900, the bullish momentum is intact. A breakout above 25,100 could extend the rally further.
Do you also want me to give the weekly time frame (1W) view for a bigger picture trend?

KOTAKBANK 1D Time frame📊 Price Action
Previous Close: ₹1,973.30
Day’s Range: ₹1,963.30 – ₹1,985.00
Volume: 1,694,935 shares
VWAP: ₹1,975.06
52-Week Range: ₹1,679.05 – ₹2,301.90
🔧 Technical Indicators
RSI (14): 55.59 — Indicates neutral to bullish momentum.
MACD: 5.67 — Suggests a positive trend.
ADX (14): 37.42 — Confirms a strong trend.
Stochastic RSI: 18.53 — Indicates oversold conditions.
CCI (14): 50.23 — Neutral, with potential for upward movement.
Ultimate Oscillator: 58.25 — Signals bullish momentum.
Rate of Change (ROC): 0.72 — Positive, indicating upward price movement.
Williams %R: -54.58 — Neutral, neither overbought nor oversold.
Bull/Bear Power (13): 13.35 — Indicates buying pressure.
📈 Moving Averages
MA5: ₹1,976.44 — Sell signal.
MA10: ₹1,973.57 — Buy signal.
MA20: ₹1,968.21 — Buy signal.
MA50: ₹1,956.95 — Buy signal.
MA100: ₹1,964.72 — Buy signal.
MA200: ₹1,979.20 — Sell signal.
Summary: Out of 12 moving averages, 8 indicate a buy signal, and 4 indicate a sell signal, suggesting a generally bullish trend.
📌 Support & Resistance Levels
Immediate Support: ₹1,963
Immediate Resistance: ₹1,985
🧠 Trend Analysis
Trend: Bullish
Momentum: Positive
Volatility: Moderate
Conclusion: Kotak Mahindra Bank's stock is exhibiting a bullish trend with positive momentum and moderate volatility. The technical indicators suggest potential for upward movement, with key support at ₹1,963 and resistance at ₹1,985. Traders may consider these levels for potential entry or exit points.

NIFTY_MID_SELECT 1D Time frameCurrent Level: 13,022.90
Daily Range: 12,967.10 – 13,087.35
52-Week Range: 10,382.55 – 13,537.80
Technical Indicators:
RSI (14): 56.75 – positive momentum
MACD: 9.37 – upward trend
Stochastic Oscillator: 75.03 – strong bullish momentum
Rate of Change (ROC): 2.59 – confirming positive movement
Trend & Levels:
Trading above Supertrend: 13,065.50 – bullish trend
Support: ~13,000 (next support ~12,900)
Resistance: ~13,100 (next target 13,200–13,300)
Summary:
The Nifty Midcap Select Index is showing a bullish trend with strong momentum and potential for further gains if current momentum continues.
