USDINR-Weekly Outlook-Venkat's BlogPast week saw the break of 83 and went on to hit the high of 83.42 and closed at 83.12. The buying interest continues as the market fears breach of 83.50. It is evident from the market action that the declines are used as opportunity to hedge the Imports. Now that the markets would be trying to grab anything below 83.00. As expected the potential breach on the upside happened and the spike towards 83.30 and beyond was achieved. Expect the range of 82.80-83.50 to hold for the week and there could be choppy moves within this range. A close outside this range requires re-assessment of risk/direction and target.
A few more observations:
As noted in the previous blog, continue to keep the following input for quick reference.
The 82.75-83.25(with error adjustments) zone is the Fib projection of July 2011 to July 2013. Alternatively, the Fib projection of the move from Jan 22(Low) to Oct 22(High) and Nov 22 low also suggest the projection as 82.92. Hence, the importance. If breached, we may see another spike towards 85.70. This range seem to have been broken and expect the pair to see buying interest on every decline. There is only a marginal hope that still weekly closing is not seen above 83.25.
Neither the moves in Dollar Index-DXY nor the equity have direct correlation
A decisive week ahead. Already we are witnessing the levels above the Top of the Triangle/Rectangle and the Oscillators in the weekly charts show indications of higher levels
Disclaimer: The views expressed here are personal and not connected to SYFX Treasury Foundation. The views are for learning and reference purpose only.
Search in ideas for "oscillator"

NIFTY-Weekly Outlook-Venkat's BlogThe past week saw a repeated attempt of 19460-480 range and got sold-off. The selling pressure is expected to continue till we see a spike above 19520-640 range on a closing basis. The Index made fourth bearish candle on weekly chart. It remains to be seen if this fall is account of profit booking or a reversal.
A few observations from the weekly charts are:
The index moved in a range of 229 points viz. between 19482 and 19253
The oscillators of different time frames are showing mixed signals
Monthly Option open interest to drive the direction of the market
Expected scenarios for the ensuing week
The Index closing below the crucial 19520 is a sign of weakness
The index breached the lower end of the channel and going forward the channel trendline would be a barrier which is around 19530
Additional interesting observations
Presently, the outlook appears negative. However, the pace of selling seems to have reduced as we see the index moving in a range of 230-250 points for the past 2 weeks
The support around 19250 is gaining importance as this level is tested twice during the last couple of weeks.
Index may find supports at 19250, 19140, 19040 and the index could face resistances at multiple levels19420,19530 and 19640
There has been a few Gaps created in this bull run
18818-18908 (28th Jun 23) far off for now
18972-19079 (29th July 23) far off for now
19189-19246 (3rd July 23) * at risk
Final Note
The Index has stayed well above the long-term trend line and the 200 DMA at 18315 and 55 DMA at 19237
Index has broken the lower end ascending channel at 19440
Whereas, in the daily charts we observe a descending channel with 300 points range with range from 19140-19440
Ensuing week is crucial for a tuff fight between the Bulls and Bears for control
The line of control is 19620 for the Bulls to regain the power and it needs to be in a quick with sharp move else we may see second bout of sell-off
Index made a Doji and fourth bearish weekly candle
The is scenario currently tilted in favour of Bears and is attempting to break the crucial support zone of 19250 for taking the Index below 19K
A close below 19420 suggest that the Index would Index drift towards 19030
Need to remain vigilant as drag can be on both sides and increased volatility due to Monthly option expiry
Expected to consolidate remain in the range of 19030-19630 and any close outside the range requires re-assessment of risk
Apparently there appears two distinct fault lines-the lower one at 19140 and the top one at 19620. There are chances of 200 points move if either of this is breached on a daily closing basis.
#Stay Safe
Disclaimer: The views expressed here are personal and not connected to SYFX Treasury Foundation. The views are for learning and reference purpose only.
silver short Breakdown from consolidation in the downtrend. looks like the lower supports will be tested and the momentum oscillators are also in the bearish territory.

Gail Breakout and retest Level around 113 has been an important resistance zone, (purple shaded area)
On 25th july there was a breakout through this level accompanied with higher volume
After that there was a pullback,
and retest of the level around 113, which has now turned into support
After the retest, vol also increased indicating bullish strength
Oscillators are also in favour of bulls
Level of 129.8 (white horizontal line) is the next resistance after 122.8 (previous high)
All the white lines marked are further resistance levels
Keep SL of 113, Keep RR Ratio of 1:1 or above
For a Short Term Trade keep tgt 124
Tgts can be increased to further resistance levels depending on risk profile

USDINR-Weekly Outlook-Venkat's BlogPast week saw continued buying interest and the pair hit the high of 82.93 and closed at 82.85. The buying interest continues as the market fears breach of 83 which might have catastrophic effect. It is evident from the market action that the declines are used as opportunity to hedge the Imports. Markets are confused on the logic of this magic numbers 81.70 & 83.00. This time around the pair is at a crucial juncture and the weekly charts show signs of potential breach on the upside if the pair stays above 82.05 on closing basis which may trigger a spike towards 83.30 and beyond. Expect the range of 82.55-83.30 to hold for the week and there could be choppy moves within this range. A close outside this range requires re-assessment of risk/direction and target.
A few more observations:
As noted in the previous blog, continue to keep the following input for quick reference.
Market is expecting 81.70-83.10 will be protected. If appears that the same kind of yo-yo moves may continue till one more quarter if we do not see a close below 81.70
The 82.75-83.25(with error adjustments) zone is the Fib projection of July 2011 to July 2013. Alternatively, the Fib projection of the move from Jan 22(Low) to Oct 22(High) and Nov 22 low also suggest the projection as 82.92. Hence, the importance. If breached, we may see another spike towards 85.70.
Neither the moves in Dollar Index-DXY nor the equity have direct correlation
A decisive week ahead. We are close to the Top of the Triangle/Rectangle and the Oscillators in the weekly charts show indications of higher levels
The narrowing of the Bollinger Bands suggest we can expect sharp moves sooner. 85+ or 80- is a strange puzzle.
Disclaimer: The views expressed here are personal and not connected to SYFX Treasury Foundation. The views are for learning and reference purpose only.

NIFTY-Weekly Outlook-Venkat's BlogThe past week saw a repeated attempt of 19620-650 range and got sold-off. The selling pressure is expected to continue till we see a spike above 19640-770 range on a closing basis. The Index made third bearish candle on weekly chart. It remains to be seen if this fall is account of profit booking or a reversal.
A few observations from the weekly charts are:
The index moved in a range of 233 points viz. between 19645 and 19412
The oscillators of different time frames are showing negative signals
Option open interest to drive the direction of the market
Expected scenarios for the ensuing week
The Index closing below the crucial 19520 is a sign of weakness
The only saving grace is that it is just hanging around the lower end of the channel
Index may find supports at 19320, 19180, 19040 and the index could face resistances at multiple levels19640,19770 and 19810
Additional interesting observations
The outlook for the Index presently a neutral bias as long as the range of 19300-19700 remains intact
There has been a few Gaps created in this bull run
18818-18908 (28th Jun 23) far off for now
18972-19079 (29th July 23) far off for now
19189-19246 (3rd July 23) * at risk
Final Note
The Index has stayed well above the long-term trend line and the 200 DMA at 18280 and 55 DMA at 19177
Index is moving in an ascending channel having a depth of about 700 points. The top of the channel at 20140 the lower end at 19440 and median at 19790 Currently the Index is below the mid-point of the channel,
Whereas, in the daily charts we observe a descending channel with 450 points range with range from 19440-19990
Ensuing week is crucial for a tuff fight between the Bulls and Bears for control
The line of control is 19700 for the Bulls to regain the power and it needs to be in a quick with sharp move else we may see second bout of sell-off
Index made an inside candle though it is a bearish one
The is scenario currently tilted in favour of Bears and is at the crucial support
Will the Bulls breathe fire like Indian Hokey team? Will be known by this week
A daily close below 19420 would see the Index drift towards 19030
Need to remain vigilant as drag can be on both sides
Expected to consolidate remain in the range of 19230-19730 and any close outside the range requires re-assessment of risk
Apparently there appears two distinct fault lines-the lower one at 19420 an the top one at 19720. There are chances of 200 points move if either of this is breached on a daily closing basis.
#Stay Safe
Disclaimer: The views expressed here are personal and not connected to SYFX Treasury Foundation. The views are for learning and reference purpose only.

EURUSD sellers prepare for entry, 1.0930 and US inflation eyedEURUSD bears appear running out of steam during the fourth weekly loss as it grinds near the key support confluence within a five-month-old bullish channel ahead of the US inflation. In doing so, the Euro pair seesaws between a three-week-old falling resistance line and a confluence of the 100-DMA and a rising support line from November 2022, respectively near 1.0970 and 1.0930. It’s worth noting that the MACD and RSI signal the return of the buyers but a clear downside break of 1.0930 could quickly challenge the bullish channel by poking the 1.0760 mark comprising the stated channel’s support line. In a case where the Euro bears ignore oscillators and break the 1.0760 support, May’s low of 1.0688 may act as an intermediate halt before dragging the quote toward the lows marked in February and January of 2023, close to 1.0515 and 1.0480 in that order.
On the flip side, a clear upside break of the aforementioned three-week-old descending resistance line, close to 1.0970 at the latest, becomes necessary for the EURUSD bull’s return. Following that, the tops marked in February and April, near 1.1035 and 1.1095 in that order will gain the market’s attention. In a case where the Euro buyers dominate past 1.1095, the yearly high marked in July around 1.1275 and the previously stated bullish channel’s top line, close to 1.1285, should lure the bids.
Overall, EURUSD is hitting strong support ahead of the key event that’s likely to underpin the US Dollar pullback, which in turn requires sellers to remain cautious before taking a fresh short position.

Possible long in EUR/CADThe pair is bouncing from the support. This is a key pivot level which has been tested several times in the past. The momentum oscillators are also showing a slight positive divergence. Longs have a clear risk management below the support level and we can see a substantial rally from this level.

USDINR-Weekly Outlook-Venkat's BlogPast week saw continued buying interest and the pair hit the high of 82.89 and cooled-off to close at 82.65. As has been continuously highlighted in the previous Blogs, it is evident from the market action that the declines are used as opportunity to hedge the Imports. Markets are confused on the logic of this magic numbers 81.70 & 83.00. This time around the pair is at a crucial juncture and the weekly charts show signs of potential breach on the upside if the pair stays above 82.95 on closing basis which may trigger a spike towards 83.25. Expect the range of 82.15-83.20 to hold for the week and there could be choppy moves within this range. A close outside this range requires re-assessment of risk/direction and target.
A few more observations:
As noted in the previous blog, continue to keep the following input for quick reference.
Neither the moves in Dollar Index-DXY nor the equity have direct correlation
The 82.75-83.25(with error adjustments) zone is the Fib projection of July 2011 to July 2013. Alternatively, the Fib projection of the move from Jan 22(Low) to Oct 22(High) and Nov 22 low also suggest the projection as 82.92. Hence, the importance. If breached, we may see another spike towards 85.70.
Market is expecting 81.70-83.10 will be protected. If appears that the same kind of yo-yo moves may continue till one more quarter if we do not see a close below 81.70
A decisive week ahead. We are close to the Top of the Triangle/Rectangle and the Oscillators in the weekly charts show indications of higher levels
The narrowing of the Bollinger Bands suggest we can expect sharp moves sooner. 85+ or 80- is a strange puzzle.
Disclaimer: The views expressed here are personal and not connected to SYFX Treasury Foundation. The views are for learning and reference purpose only.

NIFTY-Weekly Outlook-Venkat's BlogThe past week saw a sell-off on three out of five sessions. The selling pressure was more when the Index breached 19520. The Index made second bearish candle. It remains to be seen if this fall is account of profit booking or a reversal.
A few observations from the weekly charts are:
The index moved in a range of 499 points viz. between 19795 and 19296
The oscillators of different time frames are showing negative signals
Option open interest to drive the direction of the market
Expected scenarios for the ensuing week
The Index breaching the crucial 19520 and the Index making lower lows and lower highs after 18 weeks are signs of weakness
The only saving grace is that it bounced back from the lower end of the channel
Index may find supports at 19320, 19180, 19040 and the index could face resistances at multiple levels19630,19770 and 19810
Additional interesting observations
The outlook for the Index presently a neutral bias as long as the range of 19300-19700 remains intact
There has been a few Gaps created in this bull run
18818-18908 (28th Jun 23) far off for now
18972-19079 (29th July 23) far off for now
19189-19246 (3rd July 23) * at risk
Final Note
The Index has stayed well above the long-term trend line and the 200 DMA at 18230 and 55 DMA at 19063
Index is moving in an ascending channel having a depth of about 700 points. The top of the channel at 20070 the lower end at 19370 and median at 19720 Currently the Index is below the mid-point of the channel,
Whereas, in the daily charts we observe a descending channel with 450 points range with range from 19230-19680
Index still has an unfinished agenda of scaling 20K
Ensuing week is crucial for a tuff fight between the Bulls and Bears for control
The line of control is 19700 for the Bulls to regain the power and it needs to be in a quick with sharp move else we may see second bout of sell-off
A health consolidation would prove the strength of the move
A daily close below 19320 would see the Index drift towards 19030
Need to remain vigilant as drag can be on both sides
Expected to consolidate remain in the range of 19230-19730 and any close outside the range requires re-assessment of risk
Apparently there appears two distinct fault lines-the lower one at 19320 an the top one at 19720. There are chances of 200 points move if either of this is breached on a daily closing basis.
Daily close above 19770 required for further gains
#Stay Safe
Disclaimer: The views expressed here are personal and not connected to SYFX Treasury Foundation. The views are for learning and reference purpose only.

CONCEPT OF TWIN TRENDLINES - A BULLISH CASE CONCEPT OF TWIN TRENDLINE
Long term wealth is generated through capture of trending move in a stock. The skill is in reading the chart and determining whether the trend has commenced. There are several means which are widely used to find the trend:-
-Oscillators
-EMA and its slope.
-Darvas box
-HH & HL market structure
-Formation of pivots
-Elliot Wave
All above methods are effective and can be used to take trade. However, to effectively time the trade I have put forth this concept of twin trendline. This is not a holy grail and several variations of this concept can be seen on the charts. The cardinal rule for following twin trendline concept is that the price shouldn’t have broken the previous swing low on weekly charts for a bullish long.
At times price breaks the box only to fall back in the box. It is not necessarily a false breakout but price needs more time to complete accumulation thereby preparing for next move. Twin trendline works best in such cases. This concept with its variations is applicable on all timeframes and on all asset classes. The twin trendline works most of the time but sometimes when the correction is deep even triple trendlines can be seen.
The price before trend reversal goes through motions of divergence, basing, retracement and time corrections. The stock alternates between time and price corrections within the box. After an extended price correction or retracement the price moves along the trendline thereafter to give a breakout from the first trendline to form a false higher high structure and later only to continue the trend along second trendline. (See above example)
The example of exide industries chart classically depicts the twin trendline concept. Reflex point (WILL ELABORATE SEPARATELY AGAIN) is penultimate point on the first/second trendline which needs to broken for establishment of trend. When price is consolidating a reflex point can be seen along second trendline. This point then forms a crucial pivot to understand the turn around in the price structure. In instant case of Exide industries 215 is the crucial resistance level(False HH) which needs to broken and sustained till the price reaches the mean of pitchfork ie around 240 levels. This will definitively give a HH structure for the stock.
Confluence of factors – Box being broken which should be with momentum and on volumes, reflex point on second trendline being broken, the price touches the mean of pitchfork, formation of HH structure.(One needs to monitor the period of time for all these happenings).
Time to take trade. It is felt after this price correction there may be a time correction wherein price may fall back to the box. A doji/hammer followed by a weekly green candle would be a time to take trade for capturing long term move or big move.
RSI. On both monthly and weekly charts is pointing northwards which is sure sign that stock should catch momentum. It is found that low priced stocks take time to catch momentum burst which happens only intermittently.
The angle of twin trendlines also matter to understand the geometry of vibration as to whether the stock is trending. Acute the angle longer it will take to catch momentum, obtuse the angle faster will be the move. The time spent in the box is also a measure for trend qualification. Sometimes extended time correction in the box is owing to bad results, overall directionless market, sector rotation or some bad news. When stock is in momentum the price at times crosses the reflex point on first trendline only to continue the trend.
Summary - Watch market structure of twin trendlines, wait for price to cross reflex point on second trendline, price should form HH structure, validate it through pitchfork, wait for retracement back to box, wait for candle sticks pattern of a doji and momentum candle on weekly chart to take trade.
Views Welcome
Regards
Disclaimer : This post is for educational purposes only

NIFTY-Weekly Outlook-Venkat's BlogThe past week saw a reactive move and the Index could not hold above 19800 though it attempted twice. Every attempt to spike higher is being punished with selling. The Index made a bearish candle. However, it had not breached the previous week’s low. It remains to be seen if this fall is account of profit booking or a reversal.
A few observations from the weekly charts are:
The index moved in a range of 304 points viz. between 19867 and 19563
The oscillators of different time frames are showing mixed signals
Just one session left for the monthly closing candle and the Option open interest to drive the direction of the market
Expected scenarios for the ensuing week
The Index has taken sufficient time to consolidate between 19500 &19700 before breaking out
Index has come back to the original channel
Index may find supports at 19570, 19440,19320 and the index could face resistances at multiple levels19860,19970 and 20030
Additional interesting observations
The Index is still seen in positive territory and may remain positive till we see a weekly close below 19300
There has been a few Gaps created in this bull run
18818-18908 (28th Jun 23) far off for now
18972-19079 (29th July 23) far off for now
19189-19246 (3rd July 23) far off for now
Final Note
The Index has stayed well above the long-term trend line and the 200 DMA at 18167 and 55 DMA at 18943
Index is moving in an ascending channel having a depth of about 700 points. The top of the channel at 19990 the lower end at 19277 and median at 19620
Currently the Index is around the mid-point of the channel
Post Covid 19 crash in Mar 20, we have seen positive candles in the month of July. The story
so far has been showing similar trends continuing. With Just one session left for the monthly closing candle, we can hope that there may not be a negative candle.
The Index has achieved a fresh milestone and the formation in daily charts appear that of a flag and a W formation in the weekly, the target could be another 600-700 points.
Index still has an unfinished agenda of scaling 20200 and then 20500. When and How is the question
A consolidation would prove the strength of the move
A daily close below 19520 would see the Index drift towards 19230
Need to remain vigilant as drag can be on both sides
Expected to consolidate remain in the range of 19520-19920 and any close outside the range requires re-assessment of risk
Apparently there appears two distinct fault lines-the lower one at 19520 an the top one at 19920. There are chances of 200 points move if either of this is breached on a daily closing basis.
Daily close above 19770 required for further gains.
Disclaimer: The views expressed here are personal and not connected to SYFX Treasury Foundation. The views are for learning and reference purpose only.
AUDUSD portrays bearish triangle on Australia inflation, Fed decAUDUSD fades bounce off 200-EMA, reversing from a one-week-old falling resistance line, as Australian inflation and the Federal Reserve (Fed) Interest Rate Decision decorate the calendar. Given the downbeat oscillators, as well as the Aussie pair’s placement within a two-month-old bearish triangle, the quote stays on the seller’s radar. However, a clear downside break of the stated triangle’s bottom line, close to 0.6690, becomes necessary to convince bears, not to forget the need for a sustained close beneath the 200-EMA level of 0.6730. Following that, the late June low surrounding 0.6595 and the previous monthly bottom of near 0.6485 will gain the market’s attention. In a case where the Aussie pair remains bearish past 0.6485, the theoretical target of the bearish triangle confirmation, near 0.6240, should be logical to expect as the target for the short positions.
On the contrary, an upside break of the seven-day-old resistance line, around 0.6790 at the latest, will precede the 0.6800 round figure and the last weekly high of near 0.6850 could test the AUDUSD buyers. However, major attention will be given to the triangle’s top surrounding 0.6900, a break of which won’t hesitate to propel the Aussie pair toward the 0.7000 psychological magnet. Should the quote stays firmer past 0.7000, the mid-February peak of around 0.7030 may check the upside momentum ahead of directing the bulls to the yearly top close to 0.7160.
Overall, AUDUSD appears slipping off the bull’s radar but the sellers need validation from the triangle breakdown and the fundamentals.

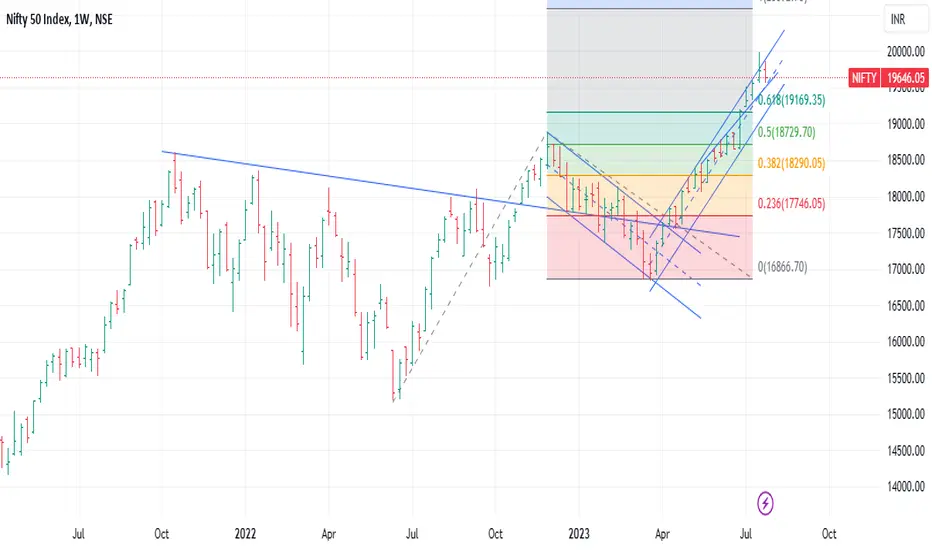
NIFTY-Weekly Outlook-Venkat's BlogThe past week saw a strong up move once it crossed 19600. A new ATP has been made at 19991, just short of the 20k mark. However, Friday’s saw a sharp down move to make the Index settle at 19745. The Index still made a bullish candle. It remains to be seen if this fall is account of profit booking or a reversal.
A few observations from the weekly charts are:
The index moved in a range of 429 points viz. between 19562 and 19991
The oscillators of different time frames are showing mixed signals
Monthly closing related Option open interest to drive the direction of the market
Expected scenarios for the ensuing week:
The Index has taken sufficient time to consolidate between 19500 &19700 before breaking out which is considered a good sign
Index may find supports at 19570, 19440,19320 and the index could face resistances at multiple levels19860,19970 and 20130
Additional interesting observations
The Index is entering positive territory and may remain positive till we see a weekly close below 19300
There has been a few Gaps created in this bull run
18818-18908 (28th Jun 23) far off for now
18972-19079 (29th July 23) far off for now
19189-19246 (3rd July 23) far off for now
A word of caution
Be aware of the Gaps made during the up move
Index is moving in an ascending channel having a depth of about 700 points. The top of the channel at 20020 and the lower end at 19320 and median at 19670
Currently the Index is above the mid-point of the channel
Post Covid 19 crash in Mar 20, we have seen positive candles in the month of July. The story so far has been showing similar trends continuing. Yet, It remains to be seen if this would continue in this year as well when actual closing happens by the end of the month which happens in the current week
The Index has achieved a fresh mile stone and the formation in daily charts appear that of a flag and a W formation in the weekly, the target could be another 600-700 points.
Index still has an unfinished agenda of scaling 20200 and then 20500. When and How is the question
A consolidation would prove the strength of the move
A daily close below 19520 would see the Index drift towards 19230
Need to remain vigilant as drag can be on both sides
There could be profit booking ahead of FED during the current week.
Expected to consolidate remain in the range of 19520-19920 and any close outside the range requires re-assessment of risk
Apparently there appears two distinct fault lines-the lower one at 19520 an the top one at 19920. There are chances of 200 points move if either of this is breached on a daily closing basis.
Disclaimer: The views expressed here are personal and not connected to SYFX Treasury Foundation. The views are for learning and reference purpose only.

SONACOMS BLAST!!! with strong inflow .sona coms is flying. Daily as well as charts are showing bullish patterns. Strong inflow from DII & FII. All indicators and oscillators are showing thier strength. Anyone can participate in the rally. All the best!

Key Dollar resistance zoneThis is a very important dollar index level, if this were to hold up then we can get some more rally in the gold and the other metals. Equities as well. But if dollar breaks through this level then we will possibly get some sharp corrections in the commodities and the equities as well. The bet still will be that the level will hold up, but the oscillators are bouncing from the oversold levels hence it could do some time correction before the next leg of fall.

long AUD/CADAUD/CAD at an excellent support level. This is the previous breakout level where the market had tested the level several tines before breaking out, thus it is a key level in terms of the support and resistance. Expect the pair to bounce from here as the oscillators on the hourly time frame are also looking oversold. Some mean reversion can be expected and this is the right level from where we can get it.

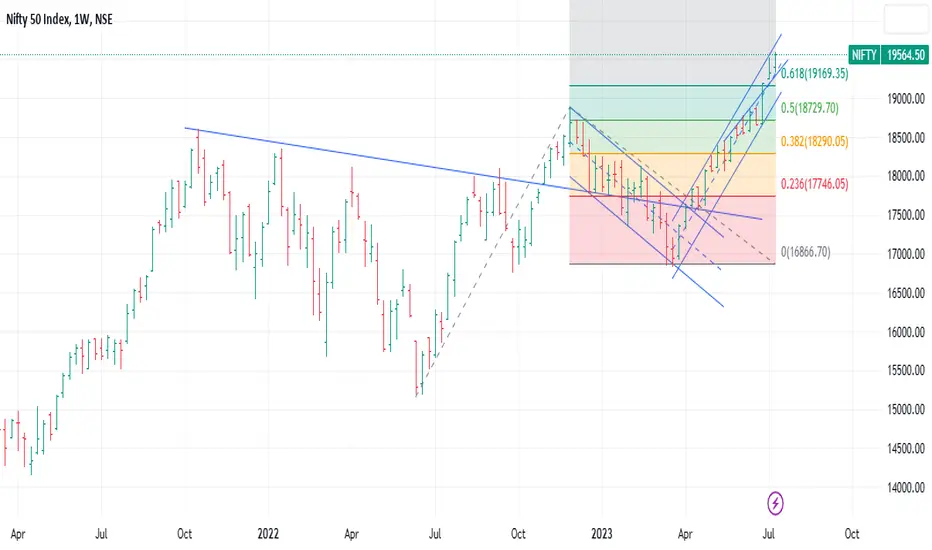
NIFTY-Weekly Outlook-Venkat's BlogThe past week saw Yo-Yo move between 19330 & 520 with selling pressure every time the Index attempted to cross 19500. Friday’s move matched with India’s pride moment of Chandrayan 3 and the Index scaled a new peak of 19595.
A few observations from the weekly charts are:
The index moved in a range of 268 points viz. between 19327 and 19595
The oscillators of different time frames are showing positive signals
Option open interest to drive the direction of the market
Expected scenarios for the ensuing week
The Index has taken sufficient time to consolidate between 19300 &19500 before breaking out which is considered a good sign
Index may find supports at 19420, 19340,19230 and the index could face resistances at multiple levels19670,19770 and beyond 19770 there could be a bout of stops getting triggered
Additional interesting observations
The Index is entering positive territory and may remain positive till we see a weekly close below 19100
There has been a few Gaps created in this bull run
18818-18908 (28th Jun 23)
18972-19079 (29th July 23)
19189-19246 (3rd July 23)
Final Note
The Index has stayed well above the long-term trend line and the 200 DMA at 18034 and 55 DMA at 18685
A word of caution
Be aware of the Gaps made during the up move
Index is moving in an ascending channel having a depth of about 700 points. The top of the channel at 19770 and the lower end at 19070 and median at 19420
Currently the Index is above mid-point of the channel
For the past 2 weeks the gains are around 275-300 points, which does not support a very big leap forward
Post Covid 19 crash in Mar 20, we have seen positive candles in the month of July. The story so far has been showing similar trends continuing. Yet, It remains to be seen if this would continue in this year as well when actual closing happens by the end of the month
The Index has achieved a fresh mile stone and the formation in daily charts appear that of a flag and a W formation in the weekly, the target could be another 600-700 points. When and How is the question
A consolidation would prove the strength of the move
Expected to consolidate remain in the range of 19420-19740 and any close outside the range requires re-assessment of risk
A daily close below 19420 would see the Index drift towards 19130
Need to remain vigilant as drag can be on both sides
There could be profit booking ahead of FED during the last week of July
#Stay Safe
Disclaimer: The views expressed here are personal and not connected to SYFX Treasury Foundation. The views are for learning and reference purpose only.
AUDUSD run-up hinges on 0.6700 break, market’s confidence in RBAThe odds of witnessing further AUDUSD upside appear dicey as a convergence of the 21-EMA and 50-EMA, around the 0.6700 round figure, challenges the bulls, together with the RBA’s inability to defend the hawkish bias. However, a three-month-old ascending support line, close to 0.6600 at the latest, limits the Aussie pair’s downside. Even if the quote drops below 0.6600, the late May swing high of around 0.6560 will test the bears before directing them to the yearly low marked in May around 0.6455.
It’s worth noting that the MACD signals seem bearish and the RSI (14) isn’t impressive enough to lure the AUDUSD buyers. If at all the RBA offers another hawkish surprise and propels the quote past the 0.6700 hurdle, the aforementioned oscillators and 38.2% Fibonacci retracement of its February-May downside, near 0.6730, will precede the 50% Fibonacci retracement level of 0.6810 to challenge the Aussie buyers. In a case where the quote remains firmer past 0.6810, the previous monthly high of near 0.6900 will act as the last defense of the bears.
Overall, AUDUSD is less likely to end up on the bull’s radar unless successfully crossing the 0.6700, as well as backed by the hawkish RBA decision.

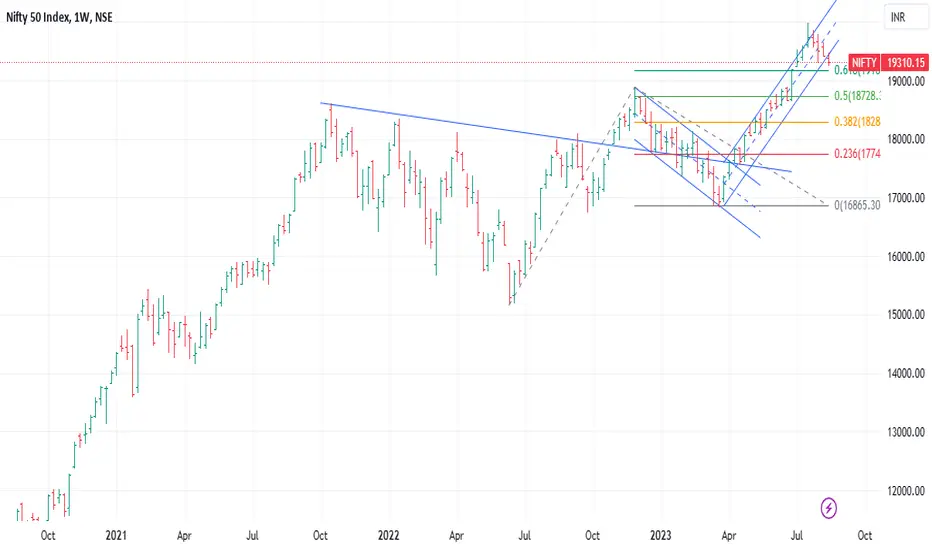
NIFTY-Weekly Outlook-Venkat's BlogThe past week saw a big breakout from the congestion zone of 18650 and 18760 and the Index finally crossed the big barrier at 18880 and posted a new ATH. As noted in the earlier Blogs, Index surpassed the target of 19170. The Index briefly attempted 19200 and closed at 19189.
A few observations from the weekly charts are:
The index moved in a range of 555 points viz. between 18646 and 19201
The oscillators of different time frames are showing positive signals
Option open interest to drive the direction of the market
Expected scenarios for the ensuing week
The Index has taken sufficient time to consolidate between 18600 &18750 before breaking out which is considered a good sign
The index has made yet another base at 18650-18750 range
Index may find supports at 19030,18880,18770 and the index could face resistances at multiple levels 19230, 19320,19410
Additional interesting observations
As observed in the previous blog index has cleared the monthly peak levels of the past viz. 18134(Feb 23 High), 18251(Jan 23 High), and 18251(Jan 23 High),18350(Jan 22 High)
The Index is entering positive territory and may remain biddish till we see a weekly close below 18760
The observations of the previous Blogs repeated for quick reference with fine tuning: On weekly charts the Index has formed an irregular Inv H&S with about 850-900 points from the neckline which targets around 18900. Actually the Index followed the Fib Projected level of 19170.
Final Note
The Index has stayed well above the long-term trend line and the 200 DMA at 17960
Index is moving in an Upward sloping channel with top around 19310 and support at 18720 with a Pivot at 19015
A word of caution
Index has made higher tweezer bottom at 18646 on weekly charts
A new trend seems to be emerging and even though a new peak has been achieved, the Index seem to achieve a fresh mile stone
July had seen a dream run. It remains to be seen if this would continue in the new month/quarter
Expected to remain in the range of 19030-19360 and any close outside the range requires re-assessment of risk
A daily close below 19030 would see the Index drift towards 18880
While the Index seem to penetrate the Upper BB which is considered as unusual. Last time it happened during the market crash on account of the pandemic
Need to remain vigilant as drag can be on both sides.
Technically 18350-410 zone if breached on a daily closing basis, we may see stops triggered
#Stay Safe
Disclaimer: The views expressed here are personal and not connected to SYFX Treasury Foundation. The views are for learning and reference purpose only.

ICICI PRUDENTIAL A technical bearish view message is a notification that is sent to investors when technical indicators suggest that a market or asset is likely to decline in price. These indicators can include moving averages, momentum oscillators, and chart patterns.

Possible Long NZD/USD Kiwi has come to a key pivot level and the oscillators are also oversold. There is a case for some mean reversion in the pair at this level. Stops can be below the support and the long positions probably can be hold over the weekend as well. It will be difficult to take this level out for the bears in first try.

#BEL#CapitalGoods - looks good.# Range Breakout.
# Good volumes.
# EMAs - All up.
# Oscillators - Buy.
