HindZinc...RSI indicates priceaction is showing weakness. Sell below 306 with the stop loss of 310. Targets are 300, 295, 290 and 286.
Search in ideas for "oscillator"


Torrent Power - Getting Power!Buy above 262 with the stop loss of 259. Targets are 266, 269, 272 and 275. Swing trade.

Classic bearish divergence, Sell 5700 with Strict SL of 5850 TrgClassic bearish divergence, Sell 5700 with Strict SL of 5850 Trgt Open

Negative divergence on hourly basis Sell @ 1255 SL 1275 Trg 1226Negative divergence on hourly basis Sell @ 1255 SL 1275 Trg 1226 -1200

Classic formation of negative divergence in BPCL Classic formation of negative divergence in BPCL stock tank from 546 to 511, can go short again in 535 range with SL 550 Trgt 500


Nifty : Shorting opportunity
One can go short in Nifty below 10130 levels, for a target of 9710 with Stop loss at 10170.
Various indicators (RSI, Money flow index)0 have given a negative divergence in the index. One has to wait for a confirmation of level below 10130 for a extremely fruitful entry.

Formation of bearish divergence on 30 min chartFormation of bearish divergence on 30 min chart, Intraday Sell 1245 with Strict SL of 1265 Trgt 1220-1200

Bullish divergence On RSIOscillators are most useful and issue their most valid trading signals when their readings diverge from prices. A bullish divergence occurs when prices fall to a new low while an oscillator fails to reach a new low. This situation demonstrates that bears are losing power, and that bulls are ready to control the market again—often a bullish divergence marks the end of a downtrend.

Kalyan Jewellers: Wave Y Still at Play?Disclaimer: This analysis is for educational purposes only and does not constitute investment advice. Please do your own research (DYOR) before making any trading decisions.
Bigger Picture
Kalyan Jewellers topped near 795.40 and has been in a prolonged corrective phase. The structure since then is not impulsive but rather corrective — pointing toward a Double Combo (W–X–Y) correction.
Wave Structure Breakdown
Wave W: A clean zigzag down into 399.40 , completing the first corrective leg.
Wave X: Extended choppy consolidation into 616.00 , best interpreted as a connector.
Wave Y: Currently unfolding as an A–B–C decline . If the pattern holds, another leg lower could complete the structure.
Technical Confluence
Support Zone: 399.40 remains a major demand area , historically respected by price. If retested, it could become the potential accumulation zone .
Projected Trendline Resistance: The descending line from 795.40 to 616.00 may evolve into a key resistance barrier on the next test.
RSI: Recent bounce came from oversold territory — a technical relief rally, not yet a trend change .
Alternate Possibility
If the 442.25 low already marked the end of Wave Y, the current rally could evolve into the start of a new impulsive sequence . Confirmation requires RSI strength above midline (50) and sustained closes beyond the projected descending trendline.
Takeaway
Kalyan Jewellers is most likely unfolding a Double Combo correction (W–X–Y) with Wave Y still in progress. Traders should watch the 399.40 demand zone as a decisive level. Holding it could set up the next bullish cycle, while a breakdown risks a deeper correction toward 336.05.

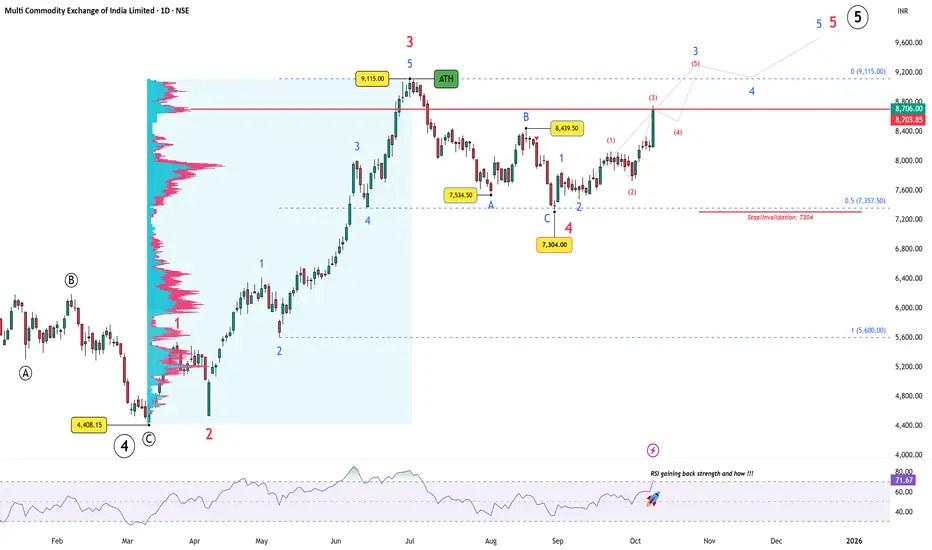
MCX: Riding the Bullion Buzz, One Wave at a TimeBack in July, MCX reached its peak at ₹9,115 — to complete an extended wave 3 which was accompanied by RSI divergence and fading momentum. A correction was expected, and the market delivered precisely that.
Price found support almost to the point — ₹7,304 , marking the completion of Wave 4 within the broader impulse. The retracement ended right at 0.5 Fibonacci level of wave 2 and wave 3, validating the initial projection.
Since then, structure has shifted to a bullish 1-2, 1-2 formation, suggesting that a new impulsive advance (Wave 3 of 5) is in progress. RSI has turned sharply higher — gaining back strength and how!!!
Meanwhile, the macro picture adds fuel. With gold and silver rallying relentlessly , trading volumes across the commodity space have surged — a direct tailwind for MCX’s business model. Rising activity in precious metals typically translates into higher revenue for the exchange, aligning both fundamentals and technicals toward the same bullish narrative.
Key Levels
Support : ₹7,304 (Wave 4 low)
Resistance : ₹9,115 (ATH)
Intermediate zone : ₹8,700–₹8,800 (FRVP resistance shelf)
As long as price holds above ₹7,304, MCX remains positioned for a continuation toward new highs in the coming weeks.
Disclaimer: This analysis is for educational purposes only and does not constitute investment advice. Please do your own research (DYOR) before making any trading decisions.
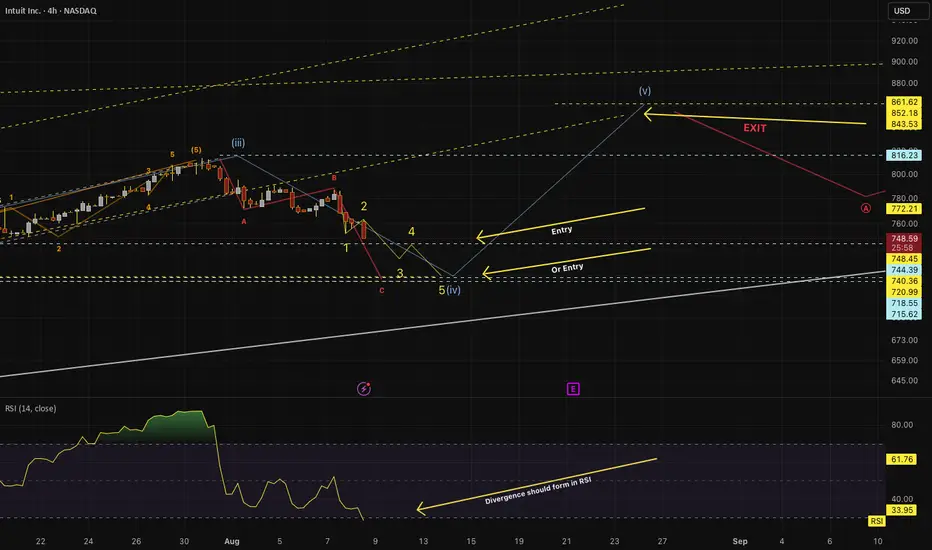
INTU next target around 850 once correction is overINTU has been correcting after finishing an Impulse sub wave.
It will end the correction in the Price band of 745-715.
Why such a big Price band to end the correction ?
Because it has to correct till 4th wave of earlier sub wave
and or resolve technical divergence with the price and RSI so the large band.
How can we trade then for a target of 850 ?
Wait for the price to enter the correction band of 745-715, the price may for the pattern as indicated by Yellow 1-2-3-4-5 wave pointing downwards.,
Wait for good candle stick formation in this band, like morning star pattern, pin bar+bullish candle or piercing candle pattern, now combine this with minimum back to back two positive divergences in RSI with price, entry should be with all condition met so that you are in high probability party., or any of the entry principles one has already developed and practicing.,
How to know if the current rise is impulsive or part of bigger B after entry is made with conditions met?
Once entered, if you can inspect in lower time frame to see if its impulsive(Elliott Wave impulsive pattern), then it is confirmed that price is impulsive towards the target, else one can exit with some profits., and again wait for the price to enter the band and enter with above said conditions.,
How much time it will take for correction to get over and target to reach ?
Time calculation is not part of this view , so the whole thing may take few weeks to couple of months to play out!
PS: This view is fundamental agnostic and it is price action view with Elliott Wave theory applied.,
I will make best efforts to call out if the rise is impulsive or not.,
NUVOCO can bounce back from lows?NUVOCO has been forming lower lows in both daily and weekly charts, while RSI is forming higher lows, which indicates a bullish divergence. A bounce back from the current levels is likely to retest, its previous swing low of 320ish levels.


LONG XAUUSD 13.01.2025BULLISH DIVERGENCE APPEARS
Liquidity Swept
Reversion confirmed
React at resistance level
LFG

BITCOIN FORMED BULLISH DIVERGENCE FUELING TO 75KScenario 1: CRYPTOCAP:BTC Moves Up with Strong Volume After a Rate Cut
Bullish Divergence Support: The bullish divergence suggests that #Bitcoin is gaining strength, indicating a potential upward move.
Volume Confirmation: If BTC moves up with solid volume post-rate cut, it could break through 74k and potentially head higher. Increased volume after the rate cut could be a sign that institutional or retail investors are confident in the rally, driving prices above previous resistance levels.
Target: If this scenario plays out, BTC could surpass the 74k mark, especially if the broader market sentiment is favorable post-rate cut.
Scenario 2: BTC Reaches 73k, Then Faces Another Correction
Resistance at 73k: If BTC reaches 73k but struggles to break above it, this would indicate a strong resistance zone. A pullback could follow as the market hesitates or prepares for another consolidation phase.
Correction Potential: In this case, CRYPTOCAP:BTC may correct before attempting another rally. This could be a short-term dip that sets the stage for a more significant breakout once the market rebalances.
Target: If the price reaches 73k but can't break it, then a pullback would likely bring BTC back into a lower range for a while before making another attempt at the next breakout.
Key Factors to Watch:
1. Volume: As you noted, volume is crucial. A strong volume push above resistance (like 73k) would favor Scenario 1.
2. Macro Events: The rate cut and overall macroeconomic factors could heavily influence the market. If the rate cut signals more liquidity or favorable conditions for risk assets like Bitcoin, Scenario 1 becomes more probable.
3. Market Sentiment: The overall sentiment in both crypto and traditional markets will play a role. If broader financial markets are stable or bullish, Bitcoin could push past the resistance levels.
Ultimately, monitoring the price action around the 73k and 74k levels, as well as volume trends, will help clarify which scenario is more likely.

Can Granules run a 20 up month in Sep?
Among the best Pharma chart as of now.
Only 13% in Aug under a monthly expansion.

Long Term Buy Opportunity - Kaveri SeedsKaveri Seeds looks like a good long term buy opportunity which is breaking out of a channel and is showing signs of starting a trending move

Endurance Technologies Ltd (NSE: ENDURANCETECH) Stock AnalysisKey Points:
Market Cap: ₹29,961 crore
Current Market Price (CMP): ₹2,130.05
Average PE Ratio: 44.03
Dividend Yield: 0.40%
52-Week High/Low: ₹2,318.80 / ₹1,357.00
Beta: 0.54
Technical Analysis:
Upward Trend: The stock has been moving upward, forming a cup pattern on the daily chart.
Support and Resistance:
Resistance: ₹2,318.80
Support Levels: ₹2,026.34 and ₹1,951, where it can potentially show a reversal.
Patterns: In the daily and weekly frames, the stock shows reversals from the 50 and 100 EMAs and has formed a double top pattern.
Investment Consideration:
Endurance Technologies appears to be a strong candidate for a mid-cap auto sector portfolio addition due to its consistent upward movement and favorable technical indicators.
Disclaimer:
This analysis is for educational purposes and not financial advice. Always conduct your own research and consult with a financial advisor before investing. The author is not SEBI registered and holds no responsibility for financial losses based on this analysis.
Conclusion:
Endurance Technologies Ltd shows promise with its technical uptrend and key support levels. Monitor for potential reversals at the support levels before adding to your portfolio.

Bullish of Piramal PharmaIts following a channel.. currently breaking out and might retest in coming days. DAILY RSI is 70 showing strength / Weekly RSI is 66 ( Showing strength) Monthly RSI 49.12 . Ideally I would want it to be above 50 but this is good and should get over 50 by the end of the month.. Price might jump to previous highs
