LIC HOUSING FIN RSI Bullish DivergenceNSE:LICHSGFIN Daily chart. RSI default making lower highs while price hitting lower lows, So this is actually a good RSI Classical Positive divergence. Stock might see an uptrend above 490. Stops would be below recent low (460) on daily candle closing basis.
Search in ideas for "oscillator"

TATA MOTORS CLASSICAL POISTIVE DIVERGENCE ON DAILYNSE:TATAMOTORS Classical positive divergence seen. if demand is seen (green candle) 1 can long with stop loss below recent low 280 on daily candle closing basis. Target 1:2 risk reward ratio.

Maruti Long TradeLong on Maruti @8837 (May futures price). Tight SL with good risk/reward ratio
MFI and OBV at very low levels
Ichimoku Chikou Span will hopefully emerge from congestion
Much of the market is overbought but Maruti has fallen significantly

Buy NIFTY for monthly positionGo for long on NSE:NIFTY F/O for this month. Supertrend, a reliable indicator has given a buy signal for today accompanied by MACD Bullish signal.
Buy NIFTY today aiming for a medium term target (Till April Expiry) of 10625(T1) & 11170 (T2).
A Stoploss of 10100 is highly recommended!

Short NCC as per Stochastic Divergence signal!NSE:NCC should continue with bearish phase next week. Bearish Stochastic divergence along with MACD bearish crossover are strong signals to take a short position on Monday. Sell at opening price (may open on higher side) or wait for price of 124-126 for better sale price entry. Target is of 116.5(T1) and 101.5(T2).

DRREDDY FallingIn a very similar to Nifty (I shared an idea on it just 4 hours back), there's an observation of Stochastic Triple Divergence in NSE:DRREDDY indicating a bear trend. A short position is recommended with a target of 2004(t1) & 1904(t2). A stoploss of 2100 is highly recommended. Selling range should be (2040-2070).

Torrent Power - Ready to break!Price action is consolidating and getting ready to break. Buy above 258 with the stop loss of 254. Targets are 262, 265 and 269.

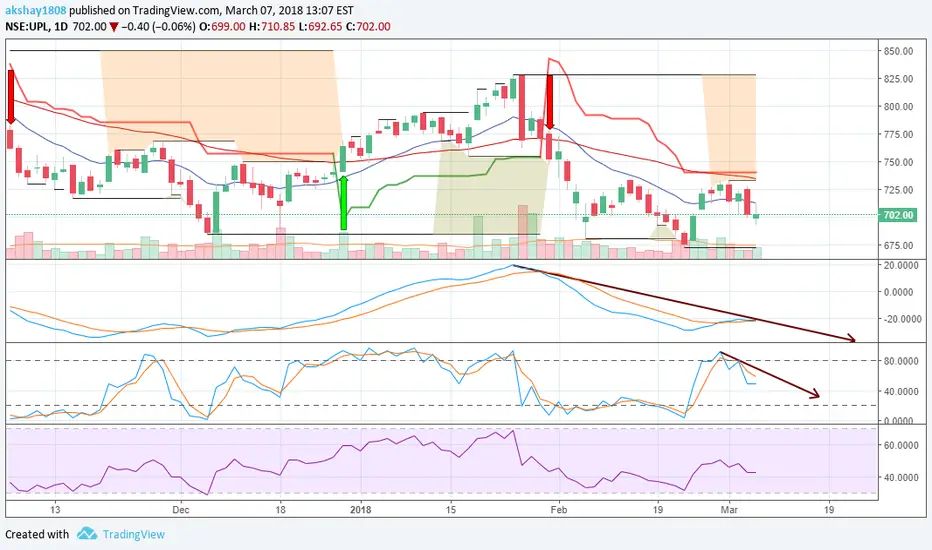
Short UPL as per MACD & Stochastic signalsNSE:UPL is one of those stocks where it seems bearish phase is yet not stopped. Fresh signal are given by MACD crossover as well Stochastic crossovers. Interestingly both are also giving bearish divergences (observe down arrow) which confirms our short selling call. Short Sell in range of 700-705. Targets will be 693(T1), 680(T2), 672(T3). A stop loss of 709 is highly recommended.
Mighty Nifty's next move!Price may retrace a little before continue to fall. If price sustain 10180, it will move towards 10200 and 10240. Resistance is seen at 10230 - 10240 levels. On the other hand, if price action didnt have strength for retracement, it will move towards 10120, 10080 and 10040.

ApolloHosp Studystudy: price making higher high & indicator making lower highs.
price movement - clueless.

Mighty Nifty - Dec 1 Trading Plan!Priceaction has formed regular bullish divergence. Buy above 10250 with the stoploss of 10220.
Targets are 10280, 10300 and 10320.
Sell below 10190 with the stoploss of 10220.
Targets are 10160, 10140 and 10120.


LIC Housing, Bouncing from support level.Weekly chart. Hammer after downtrend @ support level. Bullish candle after the hammer. Good risk reward ratio. Target 750 in 6-8 Weeks. Stop (Exit) below 595 on weekly candle closing basis.

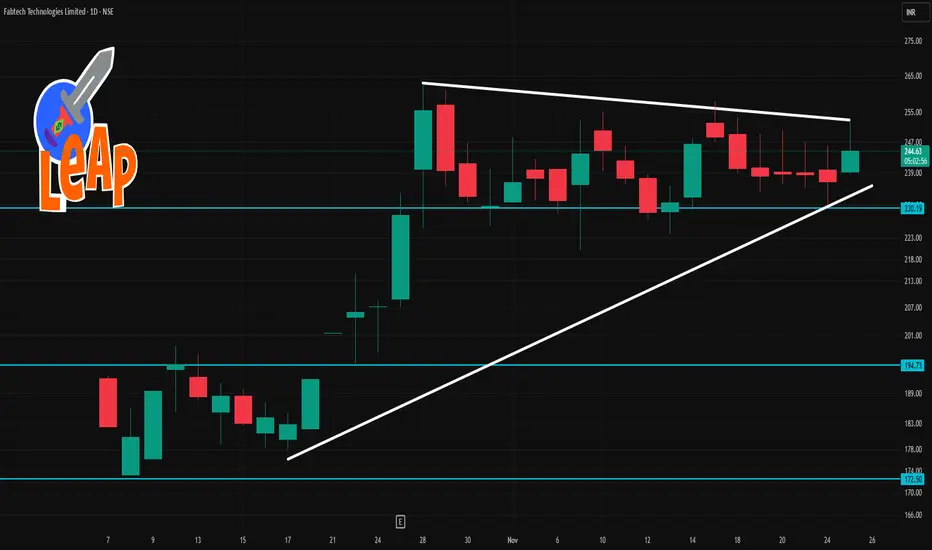
Fabtech 1 Day Time Frame 🔍 Technical Context
Moving averages (20-day, 50-day) are showing price above them, which suggests bullish bias.
Oscillators: RSI ~ 59-60 meaning moderate strength.
A recent source says the daily summary is “Neutral” on investing.com, indicating caution.
1-day pivot levels (classic) from Investing.com:
Pivot ~ ₹ 237.73
Resistance R1 ~ ₹ 240.46, R2 ~ ₹ 244.72, R3 ~ ₹ 247.45
Support S1 ~ ₹ 233.47, S2 ~ ₹ 230.74, S3 ~ ₹ 226.48
📊 Key Levels to Watch Today
Support Zone: ~ ₹ 233-235
If the stock approaches or dips into this area, watch for whether it holds or breaks.
Immediate Pivot / Mid-range: ~ ₹ 237-238
The pivot (~₹237.73) is a critical inflection point. A clear move above might bias upside; a break below may shift focus downward.
Resistance Zone: ~ ₹ 240-245
Upper resistance around ~₹240.46 to ~₹244.72. If momentum picks up and this zone is breached, next upside target ~₹247.45.
Lower Breakdown Level: ~ ₹ 230-227
If support in the ~233-235 zone fails, look toward ~₹230.74 and then ~₹226.48 as next real support.
LICHSGFIN 1 Day Time Frame 📍 Key Current Levels
The stock is trading around ₹ 550 (recent quotes ~₹ 548-550) on the NSE.
Pivot & major levels (from one source) on the daily:
Classic pivot: ~₹ 550.32
Support levels: ≈ ₹ 547.39 (S1), ≈ ₹ 542.02 (S2)
Resistance levels: ≈ ₹ 555.69 (R1), ≈ ₹ 558.62 (R2)
Longer-term moving averages: 50-day MA ≈ ₹ 559.47; 200-day MA ≈ ₹ 570.32 — both above current price, indicating downward pressure.
RSI and oscillator reading: RSI around ~41 (neutral/leaning oversold) per one data point.
🔍 Interpretation & What to Watch
With price below major moving averages (50 & 200 day), the bias remains bearish on the daily chart.
The pivot around ₹ 550 is a key level: holding above may help stabilise; falling below could signal more weakness.
Important support to watch: ~₹ 547 and then ~₹ 542. If these break, risk of further downside.
Key resistance: ~₹ 555-558 zone. A break up through that with volume could offer short-term upside.
The RSI being relatively low (though not deeply oversold) suggests potential for a rebound if positive trigger arises, but trend is not yet positive.
Because the broader trend remains negative, any bounce should be treated cautiously unless backed by strong volume and a clear breakout above that resistance zone.

MarketMonster A,B,SR - Access now on your TradingviewMARKET MONSTER IS THE ALL-IN-ONE MOST PROVEN SET OF TRADING INSTRUMENTS FOR TRADERS
Market Monster combines over 30 years of trading experience and dozens of indicators into one comprehensive package. It is the single best, most versatile indicator specially designed for Bitcoin but usable in all financial markets. The Market Monster does the majority of the leg work in interpreting the data, spitting out various symbols which will guide your trading. Not only will the Market Monster give you strong hands in a volatile market, it will also call every top and bottom and warn you of price traps. Whether you prefer oscillators, support and resistance lines, or examining moving averages, the Market Monster caters to all styles of trading while interpreting all of the data for you.
----------------
The MarketMonster Indicator Pack is a pre coded tuned version of indicators with accurate signals and added divergences.
MarketMonster Indicators are built over multiple indicators and ajusted how we like it with a nice design which gives some flare.
Layering the Indicators came from the original concept created on MarketMonster however all the indicators are free indicators on Trading View then re-coded how we like it.
MarketMonster (A) (B) & S/R Use a list of modified Indicators plus some hidden to avoid a total mess.
Here is an list of most of them. (Wavetrend , VWAP , MFI , RSI , Stoch & Divergence.)
MarketMonster-A is an EMA ribbon comprised of 8 EMAs that are blue/white during a bull market and gray during a bear market. The intersections of these lines can be very strong lagging indications, so we have programmed MarketMonster A to project symbols which correspond to various indications so you don’t have to manually interpret each bullish or bearish cross. It also gives a great visual of the trend, supplying you with strong mathematical support or resistance. MarketMonster-A was made to easily analyze, isolate, and anticipate macro trends.
Key Features:
* EMA Ribbons
* Symbolic Guidance
* Helps you identify and understand your trading environment
* Recommend Candles: Heiken Ashi.
MarketMonster-B is an all-in-one oscillator allowing for more quality indications than ever before. It combines five algorithms (some well-known, some custom) that have all been fine-tuned and smoothed for optimal analysis and trading results. When all of the algorithms converge, MarketMonster-B will project a “Green Dot & Blue Diamond" which will aid you in longing the dips in bull markets as well as temporarily exiting shorts in bear markets. The Green Dot is often accompanied by extreme sellers’ momentum and will warn you of potential market bottoms, giving you strong hands even when the night is at its darkest. MarketMonter-B certainly excels on the small time frames, but is a particularly deadly tool for isolating large swings in the market.
Key Features:
*6 Oscillators optimized and consolidated into one
*Green dot market bottoms
*Ultimate market barometer and trade initiator
*Recommended candles: heiken ashi or standard candlesticks
*Red dot market top.
Primary Triggers:
Green Dots – Leading buy signals that excel in sideways and upwards trends.
Red Dots - Leading sell signals that excel in sideways and downwards trends.
Blue Waves – You are looking for overbought and oversold readings for the most part here, but to get the most out of these waves.
Divergence - spot divergent price action which often foreshadows a future price move.
Yellow VWAP – We have incorporated the VWAP into an oscillator. It is the easiest algorithm on B to read. When it crosses up, you are long until the next cross down. When it crosses down, you are short until the next cross up.
Secondary Triggers:
MFI – The custom Money Flow oscillator gives a great visual of market conditions. When it is green, we say the grass is growing, the Bulls are grazing, and the strategy is to buy dips. When the MFI is red, buyers are dead, and the prevailing strategy is to short the peaks. You can filter many bad trades by paying attention to the MFI .
RSI – The RSI misses many opportunities on its own, but when used in tandem the other oscillators in B, can provide an extra layer of confidence via overbought and oversold readings.
Stochastic RSI – The Stochastic RSI is an indicator of an indicator. When it crosses the regular RSI , it paints green or red, signaling a bullish or bearish cross. No more manual scanning for RSI crosses! These events have greater importance on higher timeframes where the Stochastic RSI often paints red or green for weeks or months at a time. When the change in color finally occurs, that can be a strong indication to long or short.
Divergence Line -The Bearish divergence is the pattern that occurs when the price reaches higher highs, while the technical indicator makes lower highs. Although there is a bullish attitude on the market, the discrepancy means that the momentum is slowing. Therefore it is likely that there will be a rapid decline in price.
-The Bullish divergence occurs when prices fall to a new low while an oscillator fails to reach a new low. This situation demonstrates that bears are losing power, and that bulls are ready to control the market again—often a bullish divergence marks the end of a downtrend.

MarketMonster A,B,SR -Trade like a pro ,Dm me for access GuysMARKET MONSTER IS THE ALL-IN-ONE MOST PROVEN SET OF TRADING INSTRUMENTS FOR TRADERS
Market Monster combines over 30 years of trading experience and dozens of indicators into one comprehensive package. It is the single best, most versatile indicator specially designed for Bitcoin but usable in all financial markets. The Market Monster does the majority of the leg work in interpreting the data, spitting out various symbols which will guide your trading. Not only will the Market Monster give you strong hands in a volatile market, it will also call every top and bottom and warn you of price traps. Whether you prefer oscillators, support and resistance lines, or examining moving averages, the Market Monster caters to all styles of trading while interpreting all of the data for you.
----------------
The MarketMonster Indicator Pack is a pre coded tuned version of indicators with accurate signals and added divergences.
MarketMonster Indicators are built over multiple indicators and ajusted how we like it with a nice design which gives some flare.
Layering the Indicators came from the original concept created on MarketMonster however all the indicators are free indicators on Trading View then re-coded how we like it.
MarketMonster (A) (B) & S/R Use a list of modified Indicators plus some hidden to avoid a total mess.
Here is an list of most of them. (Wavetrend , VWAP , MFI , RSI , Stoch & Divergence.)
MarketMonster-A is an EMA ribbon comprised of 8 EMAs that are blue/white during a bull market and gray during a bear market. The intersections of these lines can be very strong lagging indications, so we have programmed MarketMonster A to project symbols which correspond to various indications so you don’t have to manually interpret each bullish or bearish cross. It also gives a great visual of the trend, supplying you with strong mathematical support or resistance. MarketMonster-A was made to easily analyze, isolate, and anticipate macro trends.
Key Features:
* EMA Ribbons
* Symbolic Guidance
* Helps you identify and understand your trading environment
* Recommend Candles: Heiken Ashi.
MarketMonster-B is an all-in-one oscillator allowing for more quality indications than ever before. It combines five algorithms (some well-known, some custom) that have all been fine-tuned and smoothed for optimal analysis and trading results. When all of the algorithms converge, MarketMonster-B will project a “Green Dot & Blue Diamond" which will aid you in longing the dips in bull markets as well as temporarily exiting shorts in bear markets. The Green Dot is often accompanied by extreme sellers’ momentum and will warn you of potential market bottoms, giving you strong hands even when the night is at its darkest. MarketMonter-B certainly excels on the small time frames, but is a particularly deadly tool for isolating large swings in the market.
Key Features:
*6 Oscillators optimized and consolidated into one
*Green dot market bottoms
*Ultimate market barometer and trade initiator
*Recommended candles: heiken ashi or standard candlesticks
*Red dot market top.
Primary Triggers:
Green Dots – Leading buy signals that excel in sideways and upwards trends.
Red Dots - Leading sell signals that excel in sideways and downwards trends.
Blue Waves – You are looking for overbought and oversold readings for the most part here, but to get the most out of these waves.
Divergence - spot divergent price action which often foreshadows a future price move.
Yellow VWAP – We have incorporated the VWAP into an oscillator. It is the easiest algorithm on B to read. When it crosses up, you are long until the next cross down. When it crosses down, you are short until the next cross up.
Secondary Triggers:
MFI – The custom Money Flow oscillator gives a great visual of market conditions. When it is green, we say the grass is growing, the Bulls are grazing, and the strategy is to buy dips. When the MFI is red, buyers are dead, and the prevailing strategy is to short the peaks. You can filter many bad trades by paying attention to the MFI .
RSI – The RSI misses many opportunities on its own, but when used in tandem the other oscillators in B, can provide an extra layer of confidence via overbought and oversold readings.
Stochastic RSI – The Stochastic RSI is an indicator of an indicator. When it crosses the regular RSI , it paints green or red, signaling a bullish or bearish cross. No more manual scanning for RSI crosses! These events have greater importance on higher timeframes where the Stochastic RSI often paints red or green for weeks or months at a time. When the change in color finally occurs, that can be a strong indication to long or short.
Divergence Line -The Bearish divergence is the pattern that occurs when the price reaches higher highs, while the technical indicator makes lower highs. Although there is a bullish attitude on the market, the discrepancy means that the momentum is slowing. Therefore it is likely that there will be a rapid decline in price.
-The Bullish divergence occurs when prices fall to a new low while an oscillator fails to reach a new low. This situation demonstrates that bears are losing power, and that bulls are ready to control the market again—often a bullish divergence marks the end of a downtrend.

MarketMonster A,B,SR - message me for AccessMARKET MONSTER IS THE ALL-IN-ONE MOST PROVEN SET OF TRADING INSTRUMENTS FOR TRADERS
Market Monster combines over 30 years of trading experience and dozens of indicators into one comprehensive package. It is the single best, most versatile indicator specially designed for Bitcoin but usable in all financial markets. The Market Monster does the majority of the leg work in interpreting the data, spitting out various symbols which will guide your trading. Not only will the Market Monster give you strong hands in a volatile market, it will also call every top and bottom and warn you of price traps. Whether you prefer oscillators, support and resistance lines, or examining moving averages, the Market Monster caters to all styles of trading while interpreting all of the data for you.
----------------
The MarketMonster Indicator Pack is a pre coded tuned version of indicators with accurate signals and added divergences.
MarketMonster Indicators are built over multiple indicators and ajusted how we like it with a nice design which gives some flare.
Layering the Indicators came from the original concept created on MarketMonster however all the indicators are free indicators on Trading View then re-coded how we like it.
MarketMonster (A) (B) & S/R Use a list of modified Indicators plus some hidden to avoid a total mess.
Here is an list of most of them. (Wavetrend , VWAP , MFI , RSI , Stoch & Divergence.)
MarketMonster-A is an EMA ribbon comprised of 8 EMAs that are blue/white during a bull market and gray during a bear market. The intersections of these lines can be very strong lagging indications, so we have programmed MarketMonster A to project symbols which correspond to various indications so you don’t have to manually interpret each bullish or bearish cross. It also gives a great visual of the trend, supplying you with strong mathematical support or resistance. MarketMonster-A was made to easily analyze, isolate, and anticipate macro trends.
Key Features:
* EMA Ribbons
* Symbolic Guidance
* Helps you identify and understand your trading environment
* Recommend Candles: Heiken Ashi.
MarketMonster-B is an all-in-one oscillator allowing for more quality indications than ever before. It combines five algorithms (some well-known, some custom) that have all been fine-tuned and smoothed for optimal analysis and trading results. When all of the algorithms converge, MarketMonster-B will project a “Green Dot & Blue Diamond" which will aid you in longing the dips in bull markets as well as temporarily exiting shorts in bear markets. The Green Dot is often accompanied by extreme sellers’ momentum and will warn you of potential market bottoms, giving you strong hands even when the night is at its darkest. MarketMonter-B certainly excels on the small time frames, but is a particularly deadly tool for isolating large swings in the market.
Key Features:
*6 Oscillators optimized and consolidated into one
*Green dot market bottoms
*Ultimate market barometer and trade initiator
*Recommended candles: heiken ashi or standard candlesticks
*Red dot market top.
Primary Triggers:
Green Dots – Leading buy signals that excel in sideways and upwards trends.
Red Dots - Leading sell signals that excel in sideways and downwards trends.
Blue Waves – You are looking for overbought and oversold readings for the most part here, but to get the most out of these waves.
Divergence - spot divergent price action which often foreshadows a future price move.
Yellow VWAP – We have incorporated the VWAP into an oscillator. It is the easiest algorithm on B to read. When it crosses up, you are long until the next cross down. When it crosses down, you are short until the next cross up.
Secondary Triggers:
MFI – The custom Money Flow oscillator gives a great visual of market conditions. When it is green, we say the grass is growing, the Bulls are grazing, and the strategy is to buy dips. When the MFI is red, buyers are dead, and the prevailing strategy is to short the peaks. You can filter many bad trades by paying attention to the MFI .
RSI – The RSI misses many opportunities on its own, but when used in tandem the other oscillators in B, can provide an extra layer of confidence via overbought and oversold readings.
Stochastic RSI – The Stochastic RSI is an indicator of an indicator. When it crosses the regular RSI , it paints green or red, signaling a bullish or bearish cross. No more manual scanning for RSI crosses! These events have greater importance on higher timeframes where the Stochastic RSI often paints red or green for weeks or months at a time. When the change in color finally occurs, that can be a strong indication to long or short.
Divergence Line -The Bearish divergence is the pattern that occurs when the price reaches higher highs, while the technical indicator makes lower highs. Although there is a bullish attitude on the market, the discrepancy means that the momentum is slowing. Therefore it is likely that there will be a rapid decline in price.
-The Bullish divergence occurs when prices fall to a new low while an oscillator fails to reach a new low. This situation demonstrates that bears are losing power, and that bulls are ready to control the market again—often a bullish divergence marks the end of a downtrend.
Comments

THE TRADING WHALES PRESENTS - MarketMonster-A,B,SR- Access NowMARKET MONSTER IS THE ALL-IN-ONE MOST PROVEN SET OF TRADING INSTRUMENTS FOR TRADERS
Market Monster combines over 30 years of trading experience and dozens of indicators into one comprehensive package. It is the single best, most versatile indicator specially designed for Bitcoin but usable in all financial markets. The Market Monster does the majority of the leg work in interpreting the data, spitting out various symbols which will guide your trading. Not only will the Market Monster give you strong hands in a volatile market, it will also call every top and bottom and warn you of price traps. Whether you prefer oscillators, support and resistance lines, or examining moving averages, the Market Monster caters to all styles of trading while interpreting all of the data for you.
MarketMonster-A is an EMA ribbon comprised of 8 EMAs that are blue/white during a bull market and gray during a bear market. The intersections of these lines can be very strong lagging indications, so we have programmed MarketMonster A to project symbols which correspond to various indications so you don’t have to manually interpret each bullish or bearish cross. It also gives a great visual of the trend, supplying you with strong mathematical support or resistance. MarketMonster-A was made to easily analyze, isolate, and anticipate macro trends.
Key Features:
* EMA Ribbons
* Symbolic Guidance
* Helps you identify and understand your trading environment
* Recommend Candles: Heiken Ashi.
MarketMonster-B is an all-in-one oscillator allowing for more quality indications than ever before. It combines five algorithms (some well-known, some custom) that have all been fine-tuned and smoothed for optimal analysis and trading results. When all of the algorithms converge, MarketMonster-B will project a “Green Dot & Blue Diamond" which will aid you in longing the dips in bull markets as well as temporarily exiting shorts in bear markets. The Green Dot is often accompanied by extreme sellers’ momentum and will warn you of potential market bottoms, giving you strong hands even when the night is at its darkest. MarketMonter-B certainly excels on the small time frames, but is a particularly deadly tool for isolating large swings in the market.
Key Features:
*6 Oscillators optimized and consolidated into one
*Green dot market bottoms
*Ultimate market barometer and trade initiator
*Recommended candles: heiken ashi or standard candlesticks
*Red dot market top.
Primary Triggers:
Green Dots – Leading buy signals that excel in sideways and upwards trends.
Red Dots - Leading sell signals that excel in sideways and downwards trends.
Blue Waves – You are looking for overbought and oversold readings for the most part here, but to get the most out of these waves.
Divergence - spot divergent price action which often foreshadows a future price move.
Yellow VWAP – We have incorporated the VWAP into an oscillator. It is the easiest algorithm on B to read. When it crosses up, you are long until the next cross down. When it crosses down, you are short until the next cross up.
Secondary Triggers:
MFI – The custom Money Flow oscillator gives a great visual of market conditions. When it is green, we say the grass is growing, the Bulls are grazing, and the strategy is to buy dips. When the MFI is red, buyers are dead, and the prevailing strategy is to short the peaks. You can filter many bad trades by paying attention to the MFI .
RSI – The RSI misses many opportunities on its own, but when used in tandem the other oscillators in B, can provide an extra layer of confidence via overbought and oversold readings.
Stochastic RSI – The Stochastic RSI is an indicator of an indicator. When it crosses the regular RSI , it paints green or red, signaling a bullish or bearish cross. No more manual scanning for RSI crosses! These events have greater importance on higher timeframes where the Stochastic RSI often paints red or green for weeks or months at a time. When the change in color finally occurs, that can be a strong indication to long or short.
Divergence Line -The Bearish divergence is the pattern that occurs when the price reaches higher highs, while the technical indicator makes lower highs. Although there is a bullish attitude on the market, the discrepancy means that the momentum is slowing. Therefore it is likely that there will be a rapid decline in price.
-The Bullish divergence occurs when prices fall to a new low while an oscillator fails to reach a new low. This situation demonstrates that bears are losing power, and that bulls are ready to control the market again—often a bullish divergence marks the end of a downtrend.
Leave a comment that is helpful or encouraging. Let's master the markets together

MarketMonster-B - All in one trading indicator MARKET MONSTER IS THE ALL-IN-ONE MOST PROVEN SET OF TRADING INSTRUMENTS FOR TRADERS
Market Monster combines over 30 years of trading experience and dozens of indicators into one comprehensive package. It is the single best, most versatile indicator specially designed for Bitcoin but usable in all financial markets. The Market Monster does the majority of the leg work in interpreting the data, spitting out various symbols which will guide your trading. Not only will the Market Cipher give you strong hands in a volatile market, it will also call every top and bottom and warn you of price traps. Whether you prefer oscillators, support and resistance lines, or examining moving averages, the Market Monster caters to all styles of trading while interpreting all of the data for you.
MarketMonster-B is an all-in-one oscillator allowing for more quality indications than ever before. It combines five algorithms (some well-known, some custom) that have all been fine-tuned and smoothed for optimal analysis and trading results. When all of the algorithms converge, MarketMonster-B will project a “Green Dot & Blue Diamond" which will aid you in longing the dips in bull markets as well as temporarily exiting shorts in bear markets. The Green Dot is often accompanied by extreme sellers’ momentum and will warn you of potential market bottoms, giving you strong hands even when the night is at its darkest. MarketMonter-B certainly excels on the small time frames, but is a particularly deadly tool for isolating large swings in the market.
Key Features:
*6 Oscillators optimized and consolidated into one
*Green dot market bottoms
*Ultimate market barometer and trade initiator
*Recommended candles: heiken ashi or standard candlesticks
*Red dot market top.
Primary Triggers:
Green Dots – Leading buy signals that excel in sideways and upwards trends.
Red Dots - Leading sell signals that excel in sideways and downwards trends.
Blue Waves – You are looking for overbought and oversold readings for the most part here, but to get the most out of these waves.
Divergence - spot divergent price action which often foreshadows a future price move.
Yellow VWAP – We have incorporated the VWAP into an oscillator. It is the easiest algorithm on B to read. When it crosses up, you are long until the next cross down. When it crosses down, you are short until the next cross up.
Secondary Triggers:
MFI – The custom Money Flow oscillator gives a great visual of market conditions. When it is green, we say the grass is growing, the Bulls are grazing, and the strategy is to buy dips. When the MFI is red, buyers are dead, and the prevailing strategy is to short the peaks. You can filter many bad trades by paying attention to the MFI .
RSI – The RSI misses many opportunities on its own, but when used in tandem the other oscillators in B, can provide an extra layer of confidence via overbought and oversold readings.
Stochastic RSI – The Stochastic RSI is an indicator of an indicator. When it crosses the regular RSI , it paints green or red, signaling a bullish or bearish cross. No more manual scanning for RSI crosses! These events have greater importance on higher timeframes where the Stochastic RSI often paints red or green for weeks or months at a time. When the change in color finally occurs, that can be a strong indication to long or short.

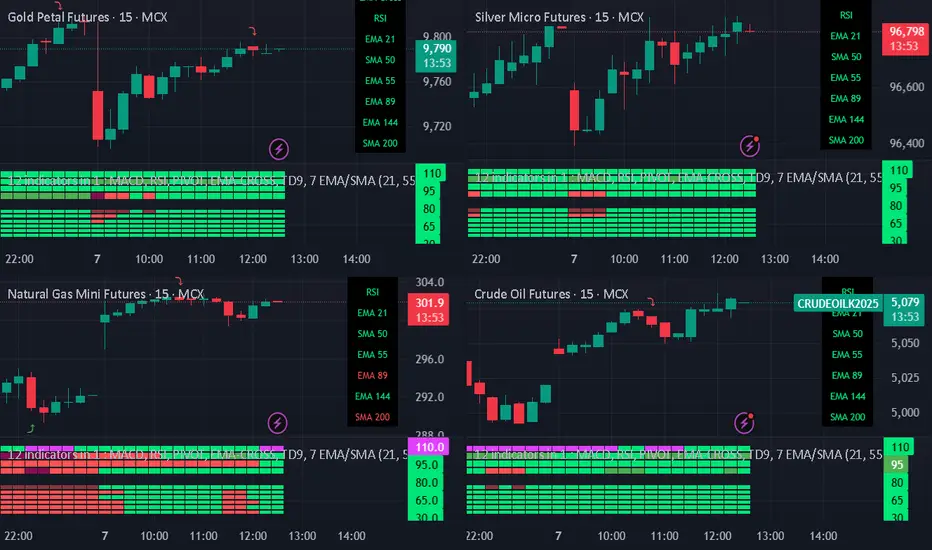
Best Commodity layoutBest Commodity layout
Crafting Your Optimal Commodity Technical Chart Layout in TradingView
The "best" commodity technical chart layout in TradingView is highly personalized, depending on your trading style, strategy, and the specific commodities you're analyzing. However, a well-structured layout should provide a clear, comprehensive view of price action and key technical indicators to aid in decision-making.
Here's a guide to creating an effective commodity technical chart layout in TradingView, incorporating common practices and versatile tools:
1. Choosing Your Main Chart Type:
Candlestick Charts: This is the most popular choice for most traders. Candlesticks provide detailed information about the open, high, low, and close (OHLC) prices for a specific period, making it easier to identify patterns and market sentiment.
Bar Charts: Similar to candlesticks, bar charts also display OHLC data but in a different visual format.
Line Charts: Useful for a quick overview of the overall trend, typically plotting the closing prices.
Heikin Ashi: These charts can help filter out market noise and make trends easier to identify by averaging price data.
Renko or Kagi Charts: These focus solely on price movement, ignoring time, and can be useful for identifying support and resistance levels.
Recommendation: Start with Candlestick charts for their detailed information. You can always switch to other types for different analytical perspectives.
2. Essential Technical Indicators for Commodities:
While the "best" set of indicators is subjective, here are some widely used and effective ones for commodity analysis in TradingView:
Moving Averages (MAs):
Types: Simple Moving Average (SMA) and Exponential Moving Average (EMA) are common. EMAs react faster to recent price changes.
Use: Identify trend direction, support/resistance levels, and potential crossover signals. Common periods include 20, 50, 100, and 200.
Layout: Add 2-3 MAs of different lengths directly onto your main price chart. For example, a 21-period EMA for short-term trends and a 50-period EMA for medium-term trends.
Volume Indicators:
Types: Volume (displays trading activity) and On-Balance Volume (OBV).
Use: Confirm the strength of price movements. A significant price move accompanied by high volume is generally considered more valid.
Layout: Typically displayed in a separate pane below the main price chart.
Oscillators (for identifying overbought/oversold conditions and momentum):
Relative Strength Index (RSI): Measures the speed and change of price movements. Values above 70 often indicate overbought conditions, while below 30 suggest oversold conditions. Standard period is 14.
Moving Average Convergence Divergence (MACD): Shows the relationship between two moving averages of an asset's price. It consists of the MACD line, signal line, and histogram.1 Used for trend identification and momentum.
1.
medium.com
medium.com
Stochastic Oscillator: Compares a particular closing price of an asset to a range of its prices over a certain period. Also used to identify overbought/oversold conditions.
Commodity Channel Index (CCI): Identifies cyclical trends and can signal overbought/oversold levels.
Layout: Oscillators are usually placed in separate panes below the main chart. You might choose 1 or 2 that best suit your strategy (e.g., RSI and MACD).
Volatility Indicators:
Bollinger Bands: Consist of a middle band (typically an SMA) and two outer bands representing standard deviations. They help identify volatility and potential price breakouts or mean reversion.
Keltner Channels: Similar to Bollinger Bands but use Average True Range (ATR) for the outer bands. Can be used for breakout and trend-following strategies.
Average True Range (ATR): Measures market volatility. Useful for setting stop-loss orders.
Layout: Bollinger Bands and Keltner Channels are overlaid on the main price chart. ATR is usually in a separate pane.
Trend-Following Indicators:
Ichimoku Cloud (Ichimoku Kinko Hyo): A comprehensive indicator that defines support/resistance, identifies trend direction, and provides trading signals. It includes several components like the Kumo (Cloud), Tenkan-sen, and Kijun-sen.
Donchian Channels: Plots the highest high and lowest low over a set period. Useful for identifying breakouts and trend direction.
Layout: Ichimoku Cloud and Donchian Channels are overlaid on the main price chart.
Recommendation for a Balanced Layout:
Main Chart: Candlesticks, 2-3 EMAs (e.g., 21, 50, 200), Bollinger Bands or Keltner Channels.
Pane 1 (below main): Volume.
Pane 2 (below main): RSI (14) or MACD.
Pane 3 (optional): CCI or ATR if your strategy heavily relies on them.
3. Drawing Tools:
Effective use of drawing tools is crucial for technical analysis:
Trendlines: Connect swing highs or lows to identify the direction and strength of trends.
Support and Resistance Levels: Horizontal lines drawn at key price levels where the price has historically struggled to break above (resistance) or fall below (support).
Fibonacci Retracement and Extension Levels: Help identify potential support/resistance levels and price targets based on Fibonacci ratios.
Channels: Parallel trendlines that can define a price range.
Chart Patterns: Use tools to identify patterns like head and shoulders, triangles, flags, and pennants.
Layout Tip: Keep your most frequently used drawing tools easily accessible in the TradingView drawing panel.
4. Multi-Timeframe Analysis & Multi-Chart Layouts:
Analyzing commodities across different timeframes can provide a broader market perspective. TradingView allows you to set up multi-chart layouts (the number of charts available depends on your subscription plan).
Common Setup:
Chart 1 (Long-Term): Weekly or Daily chart to identify the major trend.
Chart 2 (Medium-Term): 4-hour or Daily chart for more detailed trend analysis and identifying key levels.
Chart 3 (Short-Term): 1-hour or 15-minute chart for entry and exit signals.
Synchronization: TradingView allows you to synchronize symbols, crosshair, interval, and drawings across multiple charts in a layout, which can be very efficient.
5. Customization and Saving Your Layout:
Appearance: Customize chart colors (background, candles, grids), scales, and lines to your preference for better visual clarity and reduced eye strain. Access these via Chart Settings (the gear icon).
Saving Layouts: Once you have a setup you like, save it as a chart layout in TradingView. You can create multiple layouts for different commodities, strategies, or analytical purposes.
Indicator Templates: Save combinations of indicators as templates for quick application to new charts.
Tips for the "Best" Layout:
Keep it Clean: Avoid cluttering your chart with too many indicators. Focus on a few that you understand well and that complement your strategy.
Consistency: Use consistent settings for your indicators across different charts and timeframes.
Practice: The "best" layout is one that works for you. Experiment with different indicators and setups on a demo account or through backtesting to see what yields the best results for your trading style.
Stay Informed: Be aware that some commodities (e.g., agricultural products) can be influenced by seasonal patterns or specific reports (like USDA reports for crops, EIA for oil). While not a direct part of the "chart layout," integrating this knowledge with your technical analysis is crucial. TradingView has features to display key events like earnings reports or dividends, which can be relevant. Some community scripts on TradingView even offer overlays for planting and harvesting seasons for agricultural commodities.
By following these guidelines and experimenting to find what suits your individual needs, you can create a powerful and effective commodity technical chart layout in TradingView. Remember to regularly review and refine your layout as your trading strategies evolve.