ASHOK LEYLAND SHORTPOWER OF TRENDLINE RESISTANCE AND DOJI CANDLE ON TRENDLINE PLUS BEARISH DIVERGENCE SEEN WITH STOCHASTICS GO SHORT UPPER TRENDLINE IS STOP LOSS NOTE: RESULT IS DUE TODAY PLAN ACCORDINLGY RESULT MAY IMPACT STOCK TI MAYBE A GAMBLE :)
NOTE: FOR EDUCATION ONLY NO ADVICE
Search in ideas for "stochastic"

Nifty trend analysisA clear inverted head and shoulder pattern have occured in Nifty on daily chart.
There is also a upside crossover of stochastics and the %R is also moving in the upside.
** Hit like, if you like my idea.**
Britannia forming Morning star Pattern at major support & VolumeHi Traders,
Britannia forming Morning star Pattern at major support with good Volume.
Bullish View on stock due to below point:
1) Britannia has taken support at major support (22250-2400) ,which was major consolidation / support zone in Jan -Feb 2018 times. See chart for more detail.
2) It has form reversal pattern of morning star candlestick pattern with good volume.
What Indicator are says:
1) RSI out of oversold position & RSI above 40 will take stock out of bear control.
2) Stochastics RSI has make advance breakout , which tell bull control in near term. See chart for more detail.
Target :
T1 : 2620 (Book 50-70 % as per risk capacity)
T2 : 2730 -2830 zone. (Book remaining 20 % profit)
T3: 2930 zone (Hold remaining 10 % & can add new position if stock sustain good period of time above 200 sma)
Strict Stoploss : 2300 low of Morning star pattern
Happy Learning );
Disclaimer : This is post only for educational purpose . Do your analysis before taking position or trading.

KARUR KA GUROOR (part 2)COULDN'T FIND ANY VOLUME CANDLES IN TRADING VIEW.
ELSE IT WOULD HAVE APPEARED EVEN MORE BEAUTIFULLY.
1- SMALLER CANDLES
2- LESSER VOLUMES
3- STOCHASTICS- < 20
4- NEAR A SUPPORT
{PS - If no volume candles...view the heikenashi candles. It is also showing beautiful bullish reversal}

Short Tata Communications ; Very high ResistanceIt is encountering very high resistance line when drawn from historical data.
High RSI, and high slow stochastics supports shorting.
This is my individual opinion . Not an investment suggestion
Downside Target 550

Kajaria Ceramics : Positional ShortAfter a sustained upmove, stochastics is showing bearish divergence on weekly charts. Its a perfect short on positional basis for a target of 515/500/485/470. On daily charts it has already given bearish crossover. Weekly charts shows a bearish engulfing kind of pattern. If Nifty corrects then counters which has seen highest upmove in recent times will see a correction. Its safe bid to short it with a stoploss of 560 on closing basis.

Short INFY730FEBCEStock is likely to give a MACD bearish crossover on daily charts. Its forming rounding top kind of pattern on daily charts. Stochastics have fallen below 80 which gives early signs of trend reversal. IT major may retest the levels of 710/700/680 in near to short term. Short INFY 730 FEB CE for 22/25 rupees. Hold it till expiry for 20% ROI return. You may book profit once the premium decays below 50/60% or as per your choice.

Tatamotors a good long term candidate?Tatamotors gave a very good breakout near 172 levels and seen the 186-188 levels after making head and shoulders in daily charts. However it declined 6-7 points on last trading session. Is it a technical correction or heading for a major slump? Head and shoulders and Fib extension suggests an possible upside of 205-207 whereas slow stochastics suggests a bearish view.
But basis the current trend, Tatamotors is an good potential midtterm long candidate with a target of 200-205. Good to go long on declines near subsequent Fibonacci retracement levels 178/175 or upon recovery. Hedge your positions properly to avoid damage to your portfolio. I would recommend check with your financial advisor before taking a trade.

Nifty looking bearish this weekSeeing the diversion in Stochastics & RSI in daily chart, it seems that Nifty is going to fall further around 120-150 pts. Also it has broken its steep trendline (short-term) and has closed below the trend.
CMP-11520, TGT- 11400-11360, SL- 11580-11600.

Maruti - Long Entry - Positional TradeLong entry in Maruti 27th Sep Futures at 9166 on 31st August
- CMP is now at 50% retracement of the rise from 8255.5 (21st May) to 9929 (24th July). To me this seems like the ABC retracement of Wave-V is over and a new Wave-I could be starting. Some consolidation could happen of course, before it rises. (See Daily Chart on right)
- The Daily chart shows very significant level of support at CMP. Plus this is currently also at the bottom of the Ichimoku Cloud which provided support on 31st August. (See chart on right)
- The Weekly Chart low in mid-August bounced off the top of the Ichimoku Cloud and is now resting on the Kijun Sen Line. (See chart on left)
- Daily Stochastics have been gradually rising since mid-August from extremely low levels
- So there seem to be a confluence of factors supporting my decision to go long
- Max Call OI is at 9500 and 10000 with significant additions at 9300 strike. Max Put OI is at 9000 strike. (31st August). These numbers could form the basis for setting targets and SL
- Immediate targets could be around 9450-9500 and SL below 9000 or even 8800 on closing basis
- I have been closely tracking and trading Maruti since the last week of May. It seems to be following the Elliot Wave structure very clearly till now on the Daily Charts. Based on my earlier analysis posted here, my positional trades turned out very profitable.

ITC 5 day trendITC closed below 5 day trend, may show levels of 297.6 and 295.2 with a sl of 304.55
And stochastics is also lying just below oversold region.

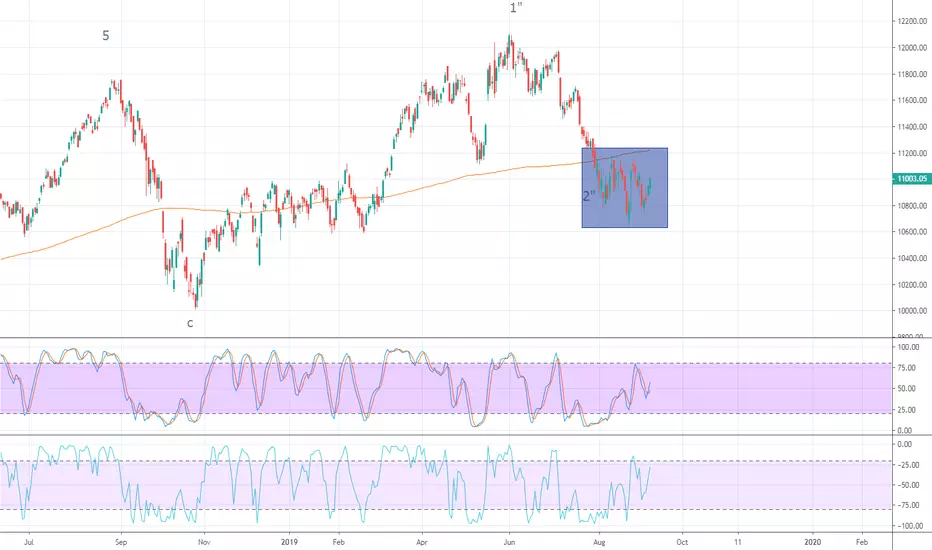
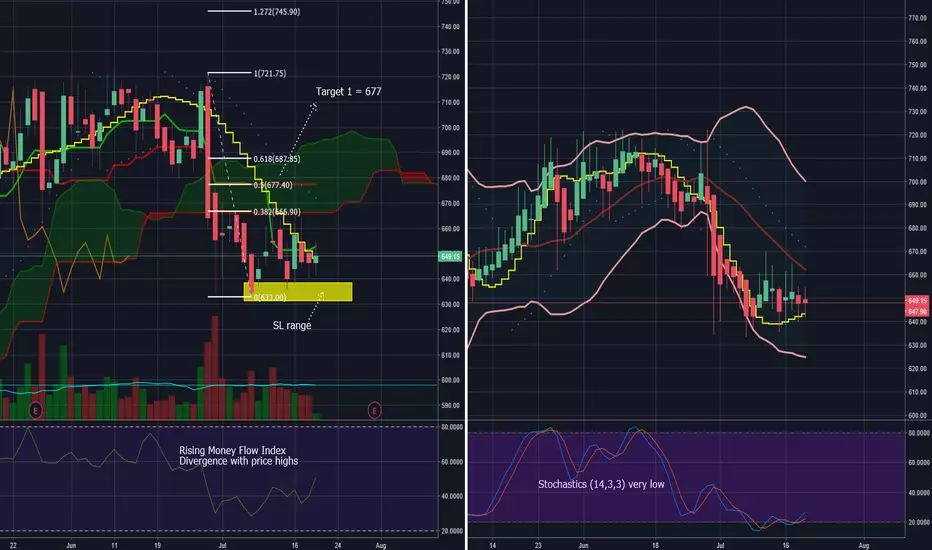
Tech Mahindra - Long- Rising MFI on daily chart
- Low Stochastics
- July futures daily candles taking support at 144 EMA of 635 since 29th June
Entered July Futures long at 629
Maruti - Positional LongMaruti seems like good long positional trade. I am long in futures market since 8900.In my previous chart I had explaind that I was waiting for a bounce from about 8873. On 3rd July I entered long.
Immediate Target ~9600. SL below 9000. Maruti put OI has max addition at 9000 strike and call OI has max addition between 9400-9700 strike. These could form the basis of SL & Target. Also ref to the fibonacci levels on the chart for target/SL.
- Daily chart shows that 200 MA was support for some time. Now it has decisively bounced off that line (purple line on chart)
- Today's daily candle (4th July) has touched the Upper Bollinger Band (2 std dev). That usually results in the candles climbing along the upper band for some days.
- Daily chart shows Chikou Span emerging clear from all congestion on the Ichimoku Chart. ADX is 13 which is low but that has great scope to go up. And D+ has clearly crossed over D-
- The Weekly chart shows this week's developing candle has taken support at the top edge of the Senkou Span in the Ichimoku Cloud and the Stochastics are crossing the 50 line. That looks good.
There could be some retracements obviously (so please be careful) but I will hold my long position for some time since I am going by the weekly and daily charts only and have traded long (with some profit booking) since May 30th when I posted my earlier Maruti chart.

USDCAD - H1 - Long - Opportunity with Good Risk RewardIn Hourly, price closed near the price range that acted as a support during the day.
1. USDCAD did a breakout and then pulled back to 1.30790 Levels on weekly charts.
2. Price has a nearby support of 61.8 % Fibo Level on Weekly.
3. Stochastics - Oversold on Hourly.
Lastly, risk and reward is pretty favorable, I will wait to see how it reacts at the opening and take a call.
----- Note ------
Position Size: 2% Risk or less ALWAYS. CANNOT RISK MORE.
Support/ Resistance/BUY/SELL/SL/TP Prices are ALWAYS RANGES and Not Exact Prices

HCLTech - Short based on Pin BarReasons for shorting:
- HCLTECH has retraced 0.618% of the drop from 23rd April to 5th June
- There seems to be a Pin Bar/Doji forming on the daily chart
- Daily chart Money Flow Index is very high near 80 level
- Stochastics high on daily chart & falling on 30 min chart
This is a rather high risk trade given the rise in Nifty but I am taking it.

YES BANK - Time to go longGood time to go long for a positional trade. SL below 325 on closing basis. Then just wait for a surge up. Targets could be 341/351/365/370 etc (futures prices July contract).
- Yes has been taking support at the 100 MA for the past 4-5 weeks.
- Stochastics look good.
- MACD (daily chart) showing signs of a bullish crossover
- Inverted Head & Shoulder formation still valid with price at the shoulder currently. Neckline is at about 370 (futures price July contract)
Ref to:

May go long in adani ports if tomorrow goes in green After five bearish trading sessions adani port has shown buying interest and after going down to 357, the stock came up to 366 which is a strong come back which may lead the stock to go upto 385 in two, three sessions. The RSI indicator has also made bullish divergence on the charts and stochastics crossover has also made it a good buy ith a stop loss of 357.

GodrejInd - NeutralLong above 565 with stoploss below 550.
Target 580,600
Short below 550 with stoploss at 560 for a target of 545, 540
Stochastics in overbought zone.
Bullish divergence seen.
But RSI is near to resistance zone of 50.

Adani ports - ShortSell below 374 with stoploss above 384
for a target of 368/360/353
Spinning Top in the resistance zone
RSI is facing resistance in 50
Stochastics in overbought zone

It is time to Buy HDFC for 3-4 DaysSwing Trading by Bollinger Band,Rsi and Stochastics Rsi with the help of Support and Trend.

Probably a bullish week aheadThe last two candles form roughly a bullish harami type of pattern, but it's not exact - because last candle's body is not completely within the previous candle's body.
But, as you can see RSI and Stochastics have turned bullish as well, so it probably is a bullish harami pattern.

IDEA gives an ideaBounce from support, pin bar... Bullish hidden divergence in Stochastics and RSI.
Can be accumulated in this zone with stoploss below the support line..
Initial resistance near the black line and second target is for short term.

AXISBANK buy setupGoing by the Bollinger Bands and stochastics on 1D, 1H and 15m TF we are seeing an early signals of breakout. Breakout could take place either before or after a pullback. We will wait for the confirmation before we take position.
Buy AXISBANK above 535
T1: 550
T2: 570
SL: 527
