HDFC Bank ltd // 3hour Support and ResistanceAs of May 5, 2025, here are the key support and resistance levels for HDFC Bank Ltd. (NSE: HDFCBANK) based on the 3-hour chart:
📊 3-Hour Pivot Points
Level Value (₹)
S3 1,689.18
S2 1,701.12
S1 1,714.03
Pivot 1,725.97
R1 1,738.88
R2 1,750.82
R3 1,763.73
These levels are calculated based on the previous day's high, low, and close prices and are used to identify potential support and resistance zones.
📈 Technical Indicators
Relative Strength Index (RSI): 72.46 (Strong Uptrend)
Stochastic RSI: 0.92 (Strong Uptrend)
Commodity Channel Index (CCI): 130.18 (Strong Uptrend)
Money Flow Index (MFI): 86.61 (Strong Uptrend)
These indicators suggest a strong bullish momentum, indicating potential upward movement if buying interest continues.
📌 Summary
Immediate Support: ₹1,689.18
Immediate Resistance: ₹1,738.88
Medium-Term Outlook: Bullish, with strong momentum indicators and positive moving averages.
Please note that technical analysis is subject to change based on market conditions. It's advisable to monitor these levels regularly and consider consulting with a financial advisor for personalized investment advice.
Search in ideas for "stochastic"

RR KABEL LTDAs of May 5, 2025, here are the key support and resistance levels for R R Kabel Ltd. (NSE: RRKABEL) based on recent technical analyses:
📊 Classic Pivot Points (1-Day View)
Support Levels:
S3: ₹880.40
S2: ₹901.70
S1: ₹924.85
Resistance Levels:
R1: ₹969.30
R2: ₹990.60
R3: ₹1,013.75
Pivot Point: ₹946.15
These levels are derived from the price range of the previous trading day and are commonly used to identify potential reversal points in the market.
📈 Moving Averages & Indicators
Simple Moving Averages (SMA):
5-Day: ₹915.44 (Buy)
10-Day: ₹911.38 (Buy)
20-Day: ₹907.79 (Buy)
50-Day: ₹891.27 (Buy)
100-Day: ₹896.50 (Buy)
200-Day: ₹1,012.39 (Sell)
Exponential Moving Averages (EMA):
5-Day: ₹918.88 (Buy)
10-Day: ₹913.53 (Buy)
20-Day: ₹906.36 (Buy)
50-Day: ₹898.08 (Buy)
100-Day: ₹928.24 (Sell)
200-Day: ₹1,003.36 (Sell)
The alignment of these averages suggests a bullish short-term to medium-term outlook, with some indicators signaling bearish trends in the long term.
📉 RSI & Momentum Indicators
Relative Strength Index (RSI): 65.27 (Buy)
Stochastic RSI: 68.79 (Buy)
MACD: 7.38 (Buy)
Average Directional Index (ADX): 35.19 (Buy)
These indicators suggest a strong bullish momentum, indicating potential upward movement if buying interest continues.
📌 Summary
Immediate Support: ₹880.40
Immediate Resistance: ₹969.30
Medium-Term Outlook: Bullish, with strong momentum indicators and positive moving averages.

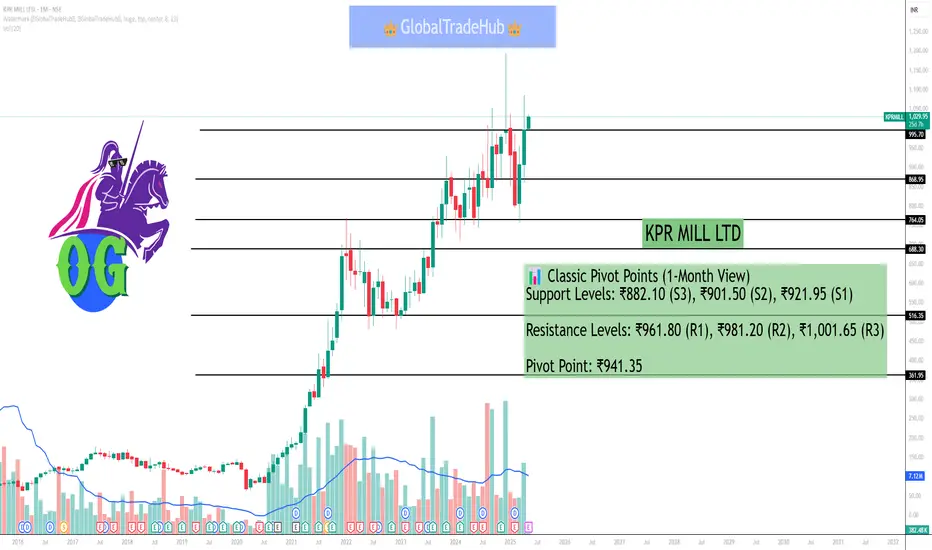
KPR MILL LTDAs of May 5, 2025, here are the key support and resistance levels for KPR Mill Ltd. (NSE: KPRMILL) based on recent technical analyses:
📊 Classic Pivot Points (1-Month View)
Support Levels: ₹882.10 (S3), ₹901.50 (S2), ₹921.95 (S1)
Resistance Levels: ₹961.80 (R1), ₹981.20 (R2), ₹1,001.65 (R3)
Pivot Point: ₹941.35
These levels are derived from the previous month's price range and are commonly used to identify potential reversal points in the market.
📈 Moving Averages & Indicators
Simple Moving Averages (SMA):
5-Day: ₹971.43
10-Day: ₹963.19
20-Day: ₹985.48
50-Day: ₹993.04
100-Day: ₹952.26
200-Day: ₹901.74
Exponential Moving Averages (EMA):
5-Day: ₹925.25 (Buy)
10-Day: ₹933.29 (Buy)
20-Day: ₹952.39 (Sell)
50-Day: ₹968.62 (Sell)
100-Day: ₹951.72 (Sell)
200-Day: ₹904.76 (Buy)
The alignment of these averages suggests a mixed short-term to medium-term outlook, with some indicators signaling bullish trends and others indicating bearish tendencies.
📉 RSI & Momentum Indicators
Relative Strength Index (RSI): 42.56 (Neutral)
Stochastic RSI: 59.15 (Buy)
MACD: 8.04 (Buy)
Average Directional Index (ADX): 32.45 (Buy
These indicators suggest a neutral to slightly bullish momentum, indicating potential upward movement if buying interest increases.
📌 Summary
Immediate Support: ₹882.10
Immediate Resistance: ₹961.80
Medium-Term Outlook: Neutral to slightly bullish, with mixed signals from moving averages and momentum indicators.
Bharti Airtel Ltd // 2hour Support and ResistanceAs of May 3, 2025, here are the key 2-hour support and resistance levels for Bharti Airtel Ltd (NSE: BHARTIARTL):
📊 2-Hour Support and Resistance Levels
Level Price (₹) Type
Support 1 1,590.27
Support 2 1,561.57
Support 3 1,549.38
Resistance 1 1,618.97
Resistance 2 1,606.78
Resistance 3 1,635.48
These levels are derived from the classic pivot point method and are crucial for traders to monitor, as movements beyond these points may indicate potential changes in the stock's trend.
🔍 Technical Indicators
As of the latest available data:
Relative Strength Index (RSI): 39.84, indicating neutral momentum.
Stochastic RSI: 11.36, suggesting potential for upward movement.
Commodity Channel Index (CCI): -155.75, reflecting bearish momentum.
Money Flow Index (MFI): 62.2, indicating an uptrend.
These indicators suggest a neutral to slightly bullish outlook for the stock.
📈 Strategy Considerations
Bullish Scenario: If the stock price maintains above the support levels, particularly Support 1 at ₹1,590.27, it may continue its upward movement towards Resistance 1 at ₹1,618.97.
Bearish Scenario: A drop below Support 1 could signal a potential reversal or consolidation phase.
Please note that these levels are based on historical data and should be used in conjunction with other technical analysis tools and market conditions.

Tata Power Corporation Ltd // 3hour Support and ResistanceAs of May 3, 2025, here are the key 3-hour support and resistance levels for Tata Power Company Ltd (NSE: TATAPOWER):
📊 3-Hour Support and Resistance Levels
Level Price (₹) Type
Support 1 349.81
Support 2 348.43
Support 3 346.76
Resistance 1 352.86
Resistance 2 354.53
Resistance 3 355.91
These levels are derived from the classic pivot point method and are crucial for traders to monitor, as movements beyond these points may indicate potential changes in the stock's trend.
🔍 Technical Indicators
As of the latest available data:
Relative Strength Index (RSI): 44.03, indicating neutral momentum.
Stochastic RSI: 0, suggesting oversold conditions.
Commodity Channel Index (CCI): -133.29, reflecting bearish momentum.
Money Flow Index (MFI): 56.07, indicating neutral buying and selling pressure.
These indicators suggest a neutral to slightly bearish outlook for the stock.
📈 Strategy Considerations
Bullish Scenario: If the stock price maintains above the support levels, particularly Support 1 at ₹349.81, it may continue its upward movement towards Resistance 1 at ₹352.86.
Bearish Scenario: A drop below Support 1 could signal a potential reversal or consolidation phase.
Please note that these levels are based on historical data and should be used in conjunction with other technical analysis tools and market conditions.

Tata Motors Ltd //1day Supoort and ResistanceAs of May 3, 2025, here are the key 1-day support and resistance levels for Tata Motors Ltd (NSE: TATAMOTORS):
📊 1-Day Support and Resistance Levels
Level Price (₹) Type
Support 1 703
Support 2 690
Support 3 683
Resistance 1 724
Resistance 2 731
Resistance 3 744
These levels are derived from the classic pivot point method and are crucial for traders to monitor, as movements beyond these points may indicate potential changes in the stock's trend.
🔍 Technical Indicators
As of the latest available data:
Relative Strength Index (RSI): 47.9, indicating neutral momentum.
Stochastic RSI: 0.33, suggesting a downtrend.
Commodity Channel Index (CCI): 32.01, reflecting neutral momentum.
Money Flow Index (MFI): 65.42, indicating an uptrend.
These indicators suggest a neutral to slightly bullish outlook for the stock.
📈 Strategy Considerations
Bullish Scenario: If the stock price maintains above the support levels, particularly Support 1 at ₹703, it may continue its upward movement towards Resistance 1 at ₹724.
Bearish Scenario: A drop below Support 1 could signal a potential reversal or consolidation phase.
Please note that these levels are based on historical data and should be used in conjunction with other technical analysis tools and market conditions.

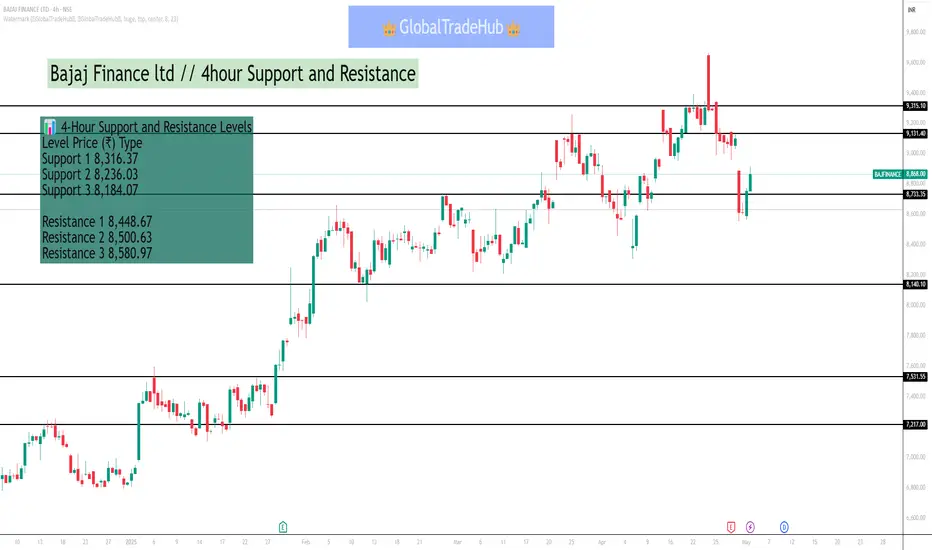
Bajaj Finance ltd // 4hour Support and ResistanceAs of May 3, 2025, Bajaj Finance Ltd (NSE: BAJFINANCE) is exhibiting the following key support and resistance levels on a 4-hour timeframe:
📊 4-Hour Support and Resistance Levels
Level Price (₹) Type
Support 1 8,316.37
Support 2 8,236.03
Support 3 8,184.07
Resistance 1 8,448.67
Resistance 2 8,500.63
Resistance 3 8,580.97
These levels are derived from the classic pivot point method and are crucial for traders to monitor, as movements beyond these points may indicate potential changes in the stock's trend.
🔍 Technical Indicators
As of the latest available data:
Relative Strength Index (RSI): 64.48, indicating an uptrend.
Stochastic RSI: 0.6, suggesting upward momentum.
Commodity Channel Index (CCI): 199.12, reflecting a strong uptrend.
Money Flow Index (MFI): 75.33, indicating strong buying pressure.
These indicators suggest a bullish trend, with the stock trading above its 20-day and 50-day Simple Moving Averages (SMA), and the 100-day and 200-day SMAs indicating an uptrend.
📈 Strategy Considerations
Bullish Scenario: If the stock price maintains above the support levels, particularly Support 1 at ₹8,316.37, it may continue its upward movement towards Resistance 1 at ₹8,448.67.
Bearish Scenario: A drop below Support 1 could signal a potential reversal or consolidation phase.
Please note that these levels are based on historical data and should be used in conjunction with other technical analysis tools and market conditions.
#CNXINFRAThe Nifty Infrastructure Index on April 28, 2025, closed at 8,589.30, marking a decline of 135.35 points or 1.55% from the previous day. The chart shows a bearish trend with the index breaking below key support levels around 8,651.55 and 8,486.6, indicating potential further downside towards 8,307.7 or lower. The RSI at 59.02 and Stochastic %K at 5.17 suggest the index is nearing oversold territory, which could signal a possible short-term bounce if buying momentum increases.

"Bank Nifty Faces Resistance as Sellers Dominate"The Bank Nifty index closed at 54,239.05, down 1.74% today. Here's a detailed technical analysis based on daily and weekly charts:
Daily Chart Analysis:
Moving Averages: The 20-day EMA is at 52,732.58, indicating a bearish trend as the index is trading below this level.
Volume: The trading volume was 109.62M, showing moderate activity.
Stochastic Oscillator: The current value is 73.21, suggesting the index is nearing overbought territory.
Support and Resistance: Immediate support is at 54,176.45, while resistance is at 55,350.55.
Weekly Chart Analysis:
Trend: The weekly chart shows a descending channel breakout, targeting 57,450+.
Indicators: The RSI (Relative Strength Index) is neutral, while MACD (Moving Average Convergence Divergence) signals a potential bullish crossover.
Pivot Points: Key levels include:
Support: 53,447.67 (S2), 52,605.13 (S3).
Resistance: 55,249.73 (R2), 56,092.27 (R3).

BANK NIFTY 50700BANK NIFTY 50700
Price Action: Bank Nifty closed at 51,502.70, down 0.18%
RSI (14): Neutral at 53.92.
MACD: Showing a buy signal.
Stochastic RSI: Overbought at 99.29, suggesting caution.
ADX: Indicates a weak trend

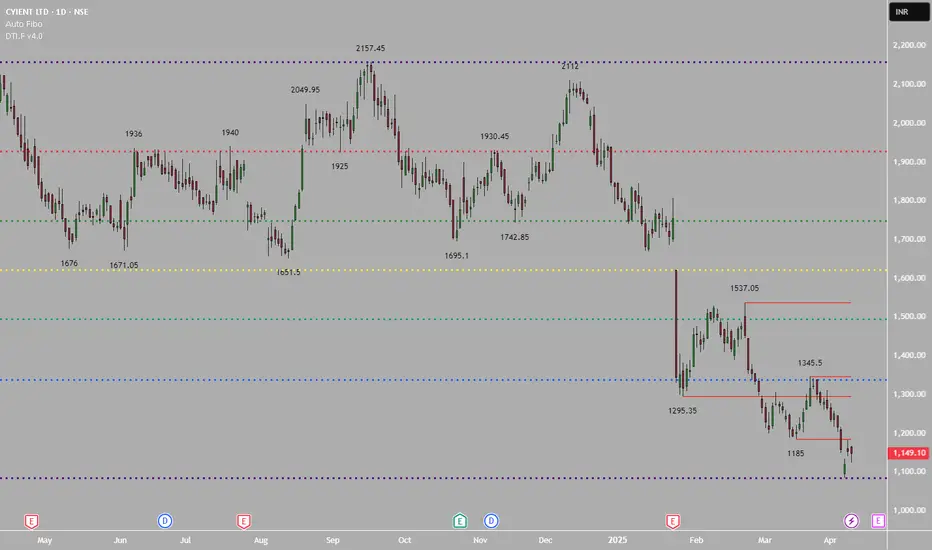
A 20% Potential Techno Funda IdeaHDFC Mutual Fund Picks 0.56% equity on April 7 which also marks a 52 week Low and terminates the selling. Subsequently the companies has announced launch of a Semiconductor Subsidiary which is a Fundamental positive news. Elliot wave has marked its Wave 5 on the downside. Stochastic has given a buy signal now a rise above 40 on the Rsi will trigger buying and give a target of around 1350 from the current price of 1150 rewarding a 20% return. So Buy.
BANK NIFTY 50700BANK NIFTY 50700
Price Action: Bank Nifty closed at 51,502.70, down 0.18%
Technical Indicators:
RSI (14): Neutral at 53.92.
MACD: Showing a buy signal.
Stochastic RSI: Overbought at 99.29, suggesting caution.
ADX: Indicates a weak trend

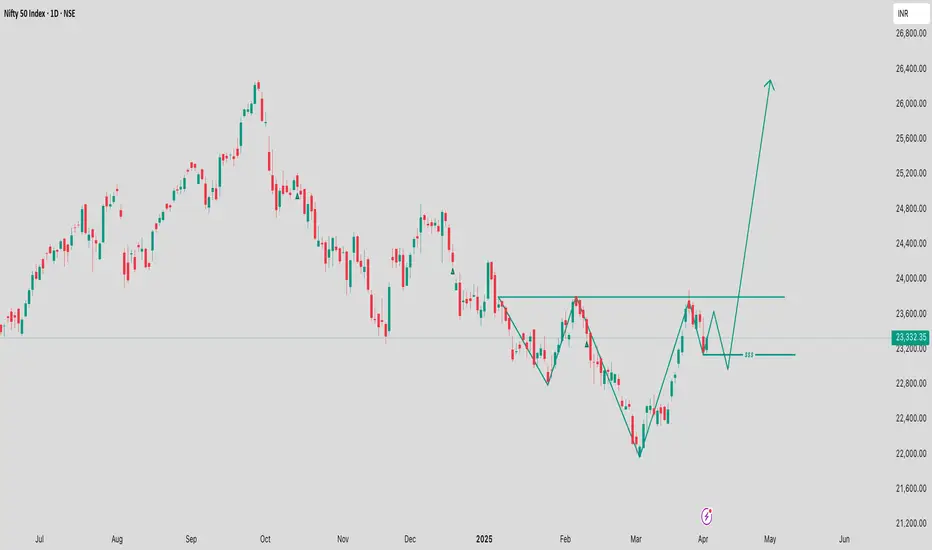
NIFTY 50 Price analysis## Current NIFTY 50 Price
As of the latest data, the NIFTY 50 is trading at **23,332.35**, reflecting a gain of **+166.65 (0.72%)**.
**Short-Term Technical Outlook**
- **Resistance levels**: Immediate resistance is observed at **23,566**, with potential upside targets at **23,640**, **23,715**, and **23,810** if sustained. A decisive close above **23,800** could propel the index toward **24,500**
- **Support zones**: Key support lies in the **23,300–23,200** range, with a breakdown below **23,413** signaling short-term bearish momentum
- **Volatility**: Recent sessions saw a sharp decline to **23,486**, breaking an ascending channel pattern on lower timeframes
**Long-Term Technical Outlook**
- **Bullish scenario**: Sustaining above **23,850** may trigger a rally toward **24,000**, **24,210**, and **24,500**, with a stop-loss at **23,700**
- **Bearish risk**: A breakdown below **22,300** could indicate further downside
**Technical Indicators**
- **RSI (14)**: Neutral at **47.54**, suggesting balanced momentum
- **MACD**: Signals a buy with a value of **17.59**
- **Moving Averages**: Mixed signals, with short-term SMAs (5, 10, 20) indicating sell pressure, while longer-term SMAs (50, 100, 200) remain bullish
- **Stochastic indicators**: Overbought conditions in STOCH (99.214) contrast with oversold STOCHRSI (23.768)
**Fundamental and Sentiment Factors**
- **FII/DII activity**: Foreign Institutional Investors (FIIs) bought **₹2,240 crore** recently, while Domestic Institutional Investors (DIIs) sold **₹696 crore**. Monthly trends show FII outflows (**₹4,744 crore**) offset by strong DII inflows (**₹27,421 crore**)
- **External drivers**: A weakening U.S. dollar (DXY at **104.3**) and declining U.S. Treasury yields support rupee appreciation, potentially aiding market gains
**Valuation Metrics**
- **P/E ratio**: **21.2**
- **Dividend yield**: **1.33%**
- **Market cap**: **₹1,86,04,127 crore**
**Strategic Recommendation**
Investors may consider a **buy-on-dips strategy** for long-term positions, leveraging current valuations. Short-term traders should monitor **23,566** (upside trigger) and **23,413** (downside threshold) for directional cues
LTIMindtree – Key Levels & Market Outlook📌 LTIMindtree (NSE: LTIM) – Key Levels & Market Outlook
LTIMindtree (LTIM) is currently holding above the critical support zone of ₹4,470-₹4,450. If the stock sustains above this level and breaks past the ₹4,680-₹4,710 resistance zone, it could trigger an upside move toward ₹4,870+. However, a breakdown below ₹4,450 may lead to further downside pressure.
🔍 Technical Indicators:
📊 Ichimoku Cloud: The stock is trading near the cloud resistance; a breakout above ₹4,710 would confirm bullish momentum.
📈 VWAP (Volume Weighted Average Price): Price is currently hovering near VWAP, suggesting accumulation at lower levels.
📉 Stochastic RSI: Near 55, indicating neutral momentum; a move above 70 would confirm strong bullish strength.
📊 Open Interest & Delivery Volume: Increasing delivery volume suggests accumulation, supporting a potential breakout above resistance.
📌 Key Levels to Watch:
✅ Support Zone: ₹4,470-₹4,450
📍 Resistance Zone: ₹4,680-₹4,710
🚀 Upside Target: ₹4,870+
⚠ Breakdown Risk: Below ₹4,450, the stock may see downside toward ₹4,380.
A sustained move above ₹4,710 could accelerate buying momentum, leading toward ₹4,870+, while failure to hold ₹4,450 could invite selling pressure. Keep an eye on IT sector trends, global market cues, and institutional activity for further confirmation.

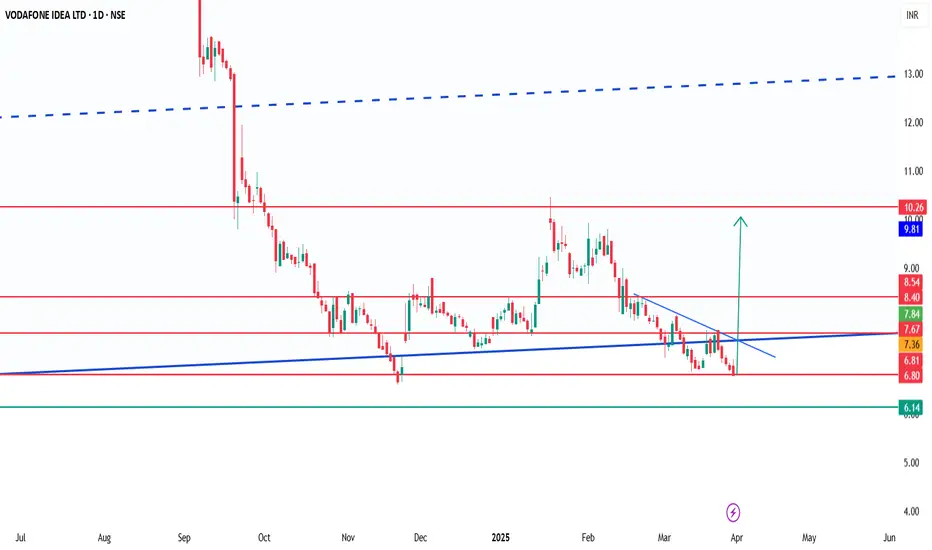
Vodafone Idea – Key Levels & Market Outlook📌 Vodafone Idea (NSE: VODAFONE) – Key Levels & Market Outlook
Vodafone Idea (VODAIDEA) is currently trading near a strong support level at ₹6.80. If this level holds, the stock could see a potential breakout once it crosses the ₹7-₹8 resistance zone, paving the way for an upside move toward ₹10. However, a breakdown below ₹6.80 may lead to further weakness.
🔍 Technical Indicators:
📊 Bollinger Bands: The stock is near the lower band, indicating a potential bounce if buying momentum picks up. A breakout above ₹8 could confirm strength.
📈 ADX (Average Directional Index): Currently around 20, suggesting a weak trend; a rise above 25 would confirm bullish strength.
📉 Stochastic Oscillator: Hovering near the oversold zone (below 25), signaling a possible reversal if demand increases.
📊 Volume & Open Interest: Rising volume on up-moves and increasing delivery percentage could confirm accumulation by investors.
📌 Key Levels to Watch:
✅ Support Level: ₹6.80
📍 Resistance Zone: ₹7.00-₹8.00
🚀 Upside Target: ₹10.00
⚠ Breakdown Risk: Below ₹6.80 could lead to a slide toward ₹6.50 or lower.
A decisive move above ₹8 could trigger fresh buying, pushing prices toward ₹10. However, failure to hold ₹6.80 might invite selling pressure. Keep an eye on market sentiment, telecom sector updates, and volume trends for confirmation.
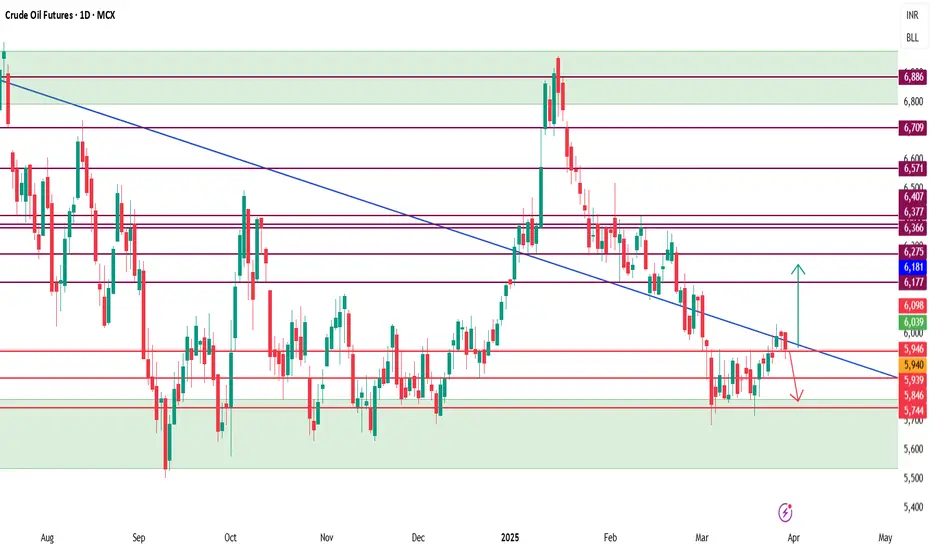
Crude Oil Futures (MCX) – Key Levels & Market Outlook📌 Crude Oil Futures (MCX) – Key Levels & Market Outlook
Crude Oil Futures (MCX) is currently trading near a strong support level at ₹5900. If this level holds, we could see a potential recovery towards ₹6000-₹6100, with further upside momentum targeting ₹6200-₹6300. However, a break below ₹5900 may invite further downside pressure.
🔍 Technical Indicators:
📊 Bollinger Bands: Price is testing the lower band near ₹5900, suggesting a possible bounce if supported by buying interest. A breakout above ₹6100 could signal increased bullish momentum.
📈 ADX (Average Directional Index): Currently around 22, indicating a weak trend. A rise above 25 would suggest stronger directional movement.
📉 Stochastic Oscillator: In the oversold zone (below 20), signaling a potential reversal if buying pressure increases.
📊 Open Interest & Volume: Increasing OI with price recovery could confirm strength, while declining OI on rallies may indicate weak buying conviction.
📌 Key Levels to Watch:
✅ Support Level: ₹5900
📍 Resistance Zone: ₹6000-₹6100
🚀 Upside Targets: ₹6200-₹6300
⚠ Breakdown Risk: Below ₹5900 could lead to a decline toward ₹5800 or lower.
A break above ₹6100 could fuel bullish momentum toward ₹6200-₹6300, while a failure to hold ₹5900 may result in extended selling pressure. Keep an eye on global crude demand, inventory data, and geopolitical developments for additional confirmation.
XAUUSD|US session trading strategy
📊From the daily structure, EMA5/10 maintains a golden cross slope of 45 degrees upward, the price runs along the upper Bollinger track, the ADX indicator>35 confirms the strength of the unilateral trend, and the K-line pattern shows an accelerated N-shaped structure.
📊From the 4-hour chart, it successfully stood at the 2906 Fibonacci extension level (161.8%), which is also the upper edge of the previous wave energy accumulation area, completing the technical transformation from resistance to support.
📊Wave structure: From the low point of 2877, the impulse wave structure (i-ii-iii-iv-v) is formed. It is currently in the extension stage of the iiith wave, which is in line with the positive momentum diffusion characteristics of MACD.
🔴Upper resistance level:
-First: 2940-2942
-Second: 2950-2958
🟢Lower support level:
-First: 2906-2915
-Second: 2890-2895
✅Long strategy
-Entry conditions: Stabilize after falling back to 2906-2915 (RSI>50 and golden cross of stochastic indicator required)
-Stop loss setting: Stop loss after breaking below 2895 (Daily EMA20)
-Target space: Gradually look up to 2940-2950-2958, risk-return ratio>1:3

TIMETECHNO Trade Set upBased on the latest available data, the price action analysis for Time Technoplast Ltd (TIMETECHNO) indicates a bearish trend in the short to medium term:
1. The stock closed at ₹364.05 on February 14, 2025, showing a significant decline of 5.58% from the previous day's close.
2. TIMETECHNO is trading below its key moving averages, including the 5-day, 20-day, 50-day, 100-day, and 200-day averages, suggesting a strong bearish trend.
3. The stock has experienced a substantial drop of 14.85% over the past month, significantly underperforming the broader market (Sensex) which only declined by 1.19%.
4. Technical indicators are predominantly bearish:
- RSI (14) is at 43.459, indicating selling pressure.
- MACD (-6.03) is showing a sell signal.
- Stochastic (28.399) and Williams %R (-76.223) are both in the selling zone.
5. The stock reached an intraday low of ₹362.15 on February 14, 2025, reflecting continued selling pressure.
6. Volume analysis shows that the latest trading volume (2,470,000 shares) is above the 5-period average volume (2,301,000 shares), suggesting increased selling activity.
7. The Chaikin Money Flow (CMF) indicator shows a bullish trend reversal, which could potentially signal a change in the current bearish momentum.
However, there are a few potential positive signals to consider:
1. The Awesome Oscillator indicates a bullish reversal with a weaker twin peak formation.
2. The stock is trading near its recent lows, which might attract value investors or lead to a potential bounce.
3. The RSI (Fast) on February 18, 2025, is at 92.53, indicating overbought conditions but also suggesting strong upward momentum.
Given these mixed signals, traders should closely monitor the stock for any potential trend reversals or continuation of the current bearish trend. The overall price action suggests caution, with a bearish bias in the short term.

HIMATSEIDE Trade set up with 17RHimatsingka Seide Ltd (HIMATSEIDE) has shown strong bullish price action recently. The stock closed at 183.95 on February 4, 2025, which is 20.47% below its 52-week high of 231.30 set on December 11, 20243. The stock has been exhibiting positive momentum with several bullish indicators:
Breakout: HIMATSEIDE has shown a rounding bottom breakout, indicating potential for significant upside12.
Volume: The stock has been trading with rising price and increasing volume, signaling strong buying interest4.
Technical indicators:
The stock has made a new six-month high with good volume.
It has shown a positive breakout from Keltner Bands, MA Envelope Bands, and Bollinger Bands.
The MACD indicator shows a bullish crossover and is sustaining above the signal line.
Trend strength: The Average Directional Index (ADX) indicates a nice uptrend.
Momentum: Both Slow Stochastic and Money Flow Index (MFI) are in overbought territory, but the uptrend appears strong, suggesting potential for further upward momentum.
However, investors should note that the stock's PE ratio of 21.09 is considered high, and its P/B ratio of 1.27 is also on the higher side. Additionally, historical data shows that HIMATSEIDE has given negative returns in February for 20 out of 26 years, with an average negative change of -7.06%.
Given these factors, while the current price action is bullish, investors should carefully consider the potential risks and historical performance before making investment decisions.

ETH - Potential Bullish Signs (Weekly) ETH forming some potential bullish signs on the weekly chart. These can take a few months to play out. We would like to see a bullish cross on the 21SMA and 50SMA. We would like to see the continuation on the stochastic RSI cross. We would like to see a break over the white trendline in the 3100 range. Lets see if the bullish hammer candle is in play with that long wick that was bought up in this past weekends sell off, closing Sunday. I would keep a tight stop loss around the 200SMA (Yellow).

USDJPYGiven the current data on the USD/JPY chart, there are a few indicators suggesting a potential selling opportunity:
Oversold Condition: The Stochastic Oscillator is at 29.59, indicating the pair is in oversold territory. This often suggests a potential reversal or upward movement, but it can also mean that selling pressure might continue if the trend doesn't reverse soon1.
Trendlines: The auto trendlines might suggest a continued downtrend, especially if the current support level is broken.
Volume: The trading volume is moderate, which means there is enough market interest to sustain the current trend.
However, it's important to consider other factors such as economic news, market sentiment, and any upcoming events that might impact the currency pair. Always use risk management strategies and consider multiple indicators before making a trading decision.

EURJPYThe chart hints at a bearish trend due to the descending channel and relatively high volumes, suggesting strong trader interest. The stochastic oscillator values indicate that there's a momentum in play, which traders can leverage for potential entry or exit points. Monitoring these key levels and trends can help in making informed trading decisions.

USDCHFThis chart depicts the USD/CHF currency pair on a daily (1D) timeframe. It's showing a notable upward trend, demonstrated by the purple dashed lines that form a channel holding the price movement. Trading volume currently sits at 86.98K.
Current Price: 0.90735 (with a high of 0.90800, low of 0.90308)
Stochastic Oscillator: Blue line at 34.36, and orange line at 24.40, suggesting current momentum.
Timeframe: Trends tracked from July to February 2025.
In essence, the overall analysis suggests a bullish trend with reasonable momentum
