High probability trading : Antony Waste Handling Cell LtdNSE:AWHCL
Antony Waste Handling Cell Ltd:
Fundamentals: Majorly waste management company based in Delhi and NCR region. Swacch Bharat Mission adds up great value to the company.
Technical: Price has given Gap down opening few days before this is due to major investor has sold his position in the company. However,the theory says that the Gap will be closed in further days which we are accepting and taking a long position
MAJOR REASON FOR HIGH PROBABILITY TRADING
EMA: The stock is very close to its 100 days EMA
Stochastics: Stochastic is in an oversold region which shows that we can go long position on this. (Below 20-Oversold)
For all these reasons we consider it as High probability trading.
Long position can behold till 395 and Stop loss is at 340 level with making Risk to Reward Ratio of 2 which is good money management in trading.
Search in ideas for "stochastic"

Shorting JupiterSell above - 399.85
1st target - 347.85
2nd target with trailing sl - 330.55
Stop loss - 434.55 or as per your appetite
Just Paper Trade.

“Allovir” A LONG Story.Buy below .6698
Target 1 = .7167
Target 2 = .7604(only with trailing stop loss)
Stop loss = .6235
And like I always say do not believe in what I say or post, sometimes I don’t believe myself. It’s not a suggestion/recommendation/advice to buy/sell
Just paper trade.
GG.

Axis Bank Short OppurtunitySell Price above 1122
Stop 1153.80
Target 1043.15
Just for Educational Purposes not a recommendation/suggestion
Maybe try Paper trade

CHOLAFIN Technical & Trade AnalysisCHOLAFIN Technical & Trade Analysis
1️⃣ Price Action
CHOLAFIN surged +4.31% to close at ₹1,583.10, marking a strong bullish candle on the daily chart. Price action shows a clean breakout attempt, with momentum reclaiming higher zones. The stock is now eyeing ₹1,662 → ₹1,737 → ₹1,845 as upside targets, while support holds near ₹1,536 – ₹1,490 – ₹1,463.
Key Levels:
🔴 Resistance: 1,609 | 1,635 | 1,681
🟢 Support: 1,536 | 1,490 | 1,463
________________________________________
2️⃣ Volume Analysis
Breakout is strongly backed by heavy volume. On breakout day, traded volume stood at 3.34M shares, almost 3.89× its 20-day average (1.15M shares). Such abnormal activity indicates institutional participation, confirming this is not a random spike but a move with strong backing.
________________________________________
3️⃣ Technical Indicators
✅ RSI: 65 → Bullish but not overbought yet
✅ MACD: Daily & Weekly bullish crossover confirmed
✅ CCI: 152 → Shows overbought momentum, supports trend
✅ Stochastic: 97 (Daily) → High momentum zone, short-term overheated
⚡ Multi-timeframe View: Daily & Weekly bullish, Monthly still sideways → Good for swing traders, long-term investors should stagger entries
________________________________________
4️⃣ Trade Setup
📈 Daily Closing Basis Trade
Entry: ₹1,588.20
SL: ₹1,513.77
Target 1: ₹1,662.63
Target 2: ₹1,737.06
⚖️ Risk–Reward: ~1:2 | Momentum strongly in favor
📊 Swing Trade Setup
Entry: ₹1,588.20
SL: ₹1,489.40
Target 1: ₹1,687
Target 2: ₹1,785
🚀 Higher potential: ₹1,845 (Fib extension)
Intraday Pullback level: 1560
Swing Pullback level: 1577
________________________________________
5️⃣ Investment Outlook
📈 Bullish Case – Why CHOLAFIN may go up
Strong bullish candle with massive volume (3.89× avg.)
RSI breakout with MACD crossover
Sectoral momentum in NBFC/finance space
Strong support zone near 1,490–1,460 ensures limited downside
📉 Bearish Case – Watch out for
Overheated stochastic (near 97) may cause short-term pullback
Resistance around ₹1,681–1,735 is critical supply zone
Broader market weakness could stall momentum
________________________________________
⚡ Final Outlook
Momentum: Strong | Trend: Bullish | Risk: Low | Volume: High
________________________________________
💡 Learning Note
This setup is a classic high-volume breakout trade → when price action, RSI, MACD, and volume align, probability of success is high. NBFC sector plays like CHOLAFIN can deliver strong short-term swing moves when backed by 3–4× volume spikes.
________________________________________
📈 Chart Pattern Analysis
CHOLAFIN on the daily timeframe has given a Double Bottom / Inverse Head & Shoulders–type breakout, a classic bullish reversal setup. The two key lows were formed near the ₹1,470–1,490 zone, showing strong demand absorption at that level. The neckline breakout came around ₹1,544–1,550, confirmed with a big green candle and 3.89× average volume, which validates institutional participation. This breakout indicates that sellers failed to push the stock lower twice, and buyers have now taken control, shifting momentum firmly to the upside. Based on the pattern projection and Fibonacci extensions, the upside potential extends towards ₹1,684 → ₹1,760 → ₹1,800, aligning with the 1.0 and 1.272 Fib levels.
________________________________________
⚠️ Disclaimer – Please Read Carefully
The information shared here is meant purely for learning and awareness. It is not a buy or sell recommendation and should not be taken as investment advice. I am not a SEBI-registered investment advisor, and all views expressed are based on personal study, chart patterns, and publicly available market data.
Trading — whether in stocks or options — carries risk. Markets can move unexpectedly, and losses can sometimes exceed the money you have invested. Past performance or past setups do not guarantee future results.
If you are a beginner, treat this as a guide to understand how the market works — practice on paper trades before risking real money. If you are experienced, always assess your own risk, position sizing, and strategy suitability before entering trades.
Consult a SEBI-registered financial advisor before making any real trading decision. By engaging with this content, you acknowledge full responsibility for your trades and investments.
💬 Found this useful?
🔼 Give this post a Boost to help more traders discover clean, structured learning.
✍️ Drop your thoughts, questions, or setups in the comments — let’s grow together!
🔁 Share with fellow traders and beginners to spread awareness.
👉 “If you liked this breakdown, follow for more clean, structured setups with discipline at the core.”
🚀 Stay Calm. Stay Clean. Trade With Patience.
Trade Smart | Learn Zones | Be Self-Reliant 📊

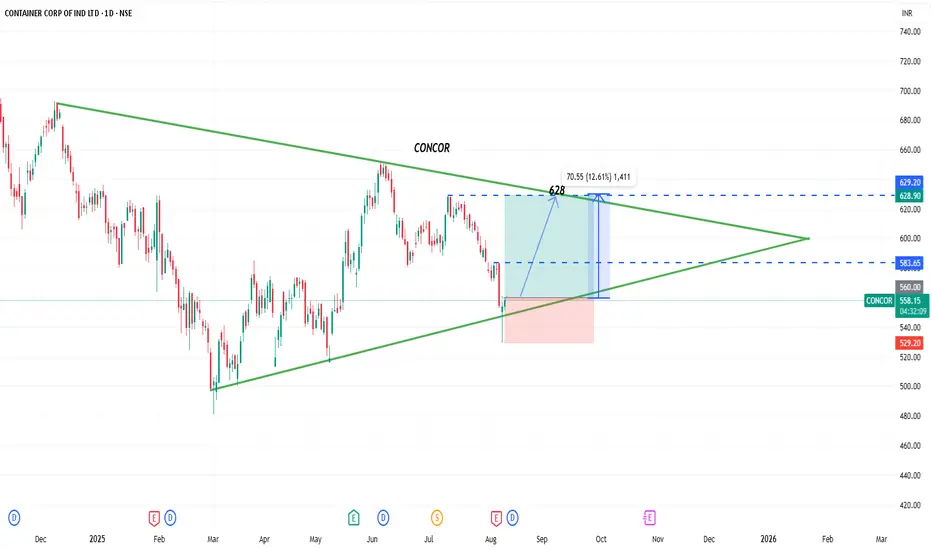
CONCOR triangle inside - longPivot: ₹735.65
Support: ₹729.20, ₹723.15, ₹716.70
Resistance: ₹741.70, ₹748.15, ₹754.20
Price near SMAs: CONCOR is hovering around key moving averages—breakouts or breakdowns here could define direction.
MACD vs Stochastic: Watch which momentum dominates—MACD has turned slightly positive, while Stochastic remains bullish.
RSI-Neutral Zone: Any decisive move above 50 (bullish) or below 40 (bearish) could shift sentiment.
Support/Resistance: Keep an eye on the ₹640–645 support band; a breakout past ₹735–740 could aim toward ₹750+.
SBI: Bullish Breakout SBI’s Board Meeting Today
• The SBI board is meeting on July 16 to discuss capital-raising plans, including issuing Basel III-compliant bonds. This is key to reinforcing the bank's capital adequacy for FY26
• The agenda has attracted market attention, and SBI shares are in focus amid these announcements
Planned QIP for Equity Capital
• SBI intends to raise up to ₹250 billion (~$2.9 billion) via a Qualified Institutional Placement, making it potentially India’s largest QIP ever
• This initiative is part of a broader ₹450 billion capital-raising plan across public-sector banks in FY26
Market Performance Snapshot (as of July 15 close):
Share Price: Around ₹816–₹817 on July 15
Valuation Metrics:
P/E ratio: ~9.4×
P/B ratio: ~1.6×
Dividend yield: ~1.95–1.97%
Technical Overview (Daily Chart – July 16, 2025)
All timeframes (up to daily) show a Strong Buy consensus, with 12 moving averages and 9–10 technical indicators flashing bullish signals on the daily chart.
Key Indicators (daily):
✅ RSI(14): ~62 (Buy)
✅ MACD: +1.85 to +2.26 (Buy)
✅ ADX(14): ~31–36 (Trending Up)
✅ Stochastics: ~64–70 (Buy)
✅ Williams %R: ≈ −27 (Buy)
CCI: +99–116 (Buy region)
Buy near current pivot zone (~816) or on a minor dip (~810–812) which aligns with support at the 50‑200 day MAs.
Targets:
Primary: R1 (~818) → R2 (~821)
Extended: 825–830+ on breakout and 860
Stop‑Loss:
Place just below key MA support: ~805–810 (below 100 and 200‑day moving averages).
Disclaimer: lnkd.in

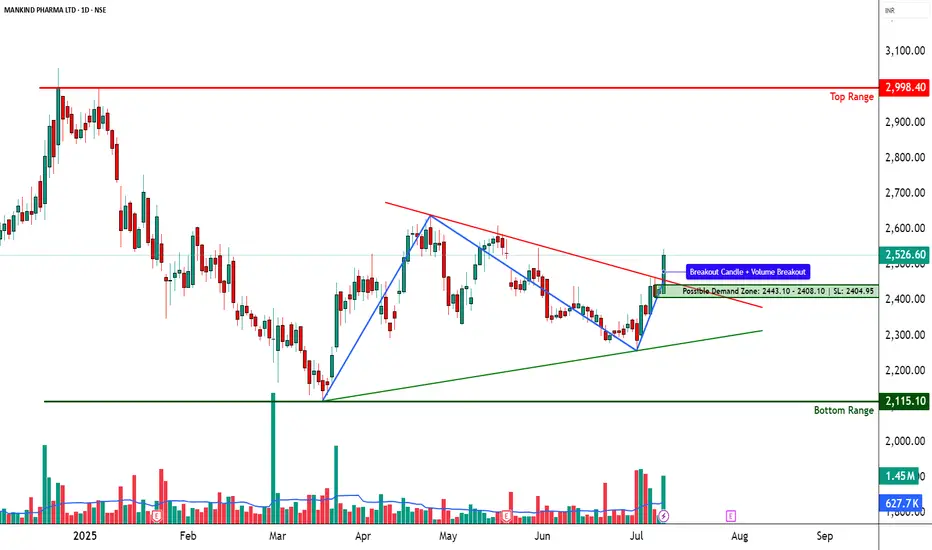
MANKIND PHARMA – Descending Triangle Breakout________________________________________________________________________________📈 MANKIND PHARMA – Falling Trendline Breakout | Strong Reversal Candle | Volume Spike
🕒 Chart Type: Daily Chart
📆 Date: July 9, 2025
________________________________________________________________________________
📌 Price Action:
MANKIND PHARMA has executed a decisive breakout above a falling trendline on the daily chart, breaking out of a multi-week descending structure. The price action had been consolidating within a triangular pattern, and on July 9, it registered a powerful wide-range bullish candle, closing at 2526.60 — well above the recent consolidation highs. This move came from a structured base with two strong pivot lows and now places the stock back into a strong bullish trajectory. The breakout is not random; it’s backed by structure, momentum, and confirmation — suggesting potential for a trend continuation if sustained.
________________________________________________________________________________
📊 Chart Pattern:
The chart shows a descending triangle breakout with compression near the apex. This setup builds pressure and usually resolves in the direction of volume. The move out of this pattern has occurred with authority, marked by a clean range expansion and bullish follow-through above resistance. This is a momentum-confirming breakout, which opens up room toward testing higher resistance zones.
________________________________________________________________________________
🕯️ Candlestick Pattern:
Strong Bullish Candle
Open = Low (Intraday strength)
Buy Today, Sell Tomorrow-type price action
Aligned with Volume Spike and Trendline Breakout
________________________________________________________________________________
🔊 Volume Analysis:
The breakout is accompanied by more than 2x the 20-day average volume, signaling real participation — not just speculative noise. Delivery volumes are notably strong, and volume came after a phase of tight consolidation, which indicates a possible transition from quiet accumulation to active participation by stronger hands.
________________________________________________________________________________
📈 Technical Indicators:
RSI (Daily): 66 – strong, trending up
MACD: Bullish crossover, both on Daily and Weekly
CCI: 220 – highly bullish momentum territory
Stochastic: 94 – overbought but confirming momentum
SuperTrend & VWAP: Clearly bullish
Bollinger Band: Price is expanding beyond upper band — volatility expansion in motion
________________________________________________________________________________
🧱 Support & Resistance:
🔻 Supports:
2448.27 – Immediate support (previous breakout zone)
2369.93 – Structure base support
2322.27 – Last defense before breakout invalidation
Bottom Range / Demand Zone: 2115.1 – Long-term accumulation zone
🔺 Resistance Zones:
2574.27 – First supply zone; watch for price reaction
2621.93 – Medium-term resistance; previously rejected here
2700.27 – Higher timeframe swing resistance
Top Range: 2998.4 – Long-term resistance; breakout confirmation if crossed
________________________________________________________________________________
👀 What’s Catching Our Eye:
What stands out is the confluence breakout — trendline, structure, volume, and indicators are all pointing in the same direction. The BB squeeze, RSI breakout, and strong candle together make this a multi-signal setup — rarely do we get such alignment across tools.
________________________________________________________________________________
🔍 What We’re Watching For:
Will the price hold above 2448–2526 for the next couple of sessions? If yes, this breakout can see momentum continuation toward 2574+. Any low-volume pullback toward the trendline or support zone could be a low-risk re-entry. If it fails to hold above the breakout candle, momentum could fade.
________________________________________________________________________________
✅ Best Buy Level for Equity (Low Risk Idea):
Entry: Above 2543.60 (post-breakout confirmation or clean retest of 2448–2455 zone)
Stop Loss: 2404.95 (on a closing basis)
Risk Reward Strategy: 1:1 initially, trail for 1:2+ if volume expands
Avoid chasing: Let the price validate with sustained volume above breakout
________________________________________________________________________________
💼 Sector Tailwinds:
The pharmaceutical sector is seeing renewed investor interest post-COVID, with growing focus on specialty products, chronic therapy lines, and export-led growth. MANKIND is among the strongest consumer-pharma brands with consistent results and brand recall — adding fundamental strength to this technical breakout.
________________________________________________________________________________
⚠️ Risk to Watch:
A close below 2448 could invalidate this setup
The overbought Stochastic means minor pullbacks or shakeouts are possible
Don’t chase — always confirm the breakout with a retest or follow-through candle
Over-positioning during volatility can lead to poor R:R trades
________________________________________________________________________________
🔮 What to Expect Next:
If this breakout holds, we may see follow-through toward 2574.27 in the short term. Strong volume above 2540+ can unlock upside toward 2621+. However, if the price closes below 2448, we may be dealing with a failed breakout — a scenario to strictly avoid. Watch next 2–3 sessions for clarity.
________________________________________________________________________________
🧠 How to Trade MANKIND PHARMA (For Educational Use Only):
🔹 Breakout Trade Plan
Entry: Above 2543.60
Stop Loss: 2404.95 (Closing basis)
Pullback Entry: Into 2448 zone with bounce candle
Risk-Reward: Start with 1:1, then trail to 1:2+
Position Sizing: Risk-calibrated, never go all-in
________________________________________________________________________________
⚠️ Disclaimer (Please Read):
• This chart is shared for educational purposes only and is not investment advice.
• I am not a SEBI-registered advisor.
• The information provided here is based on personal market observation.
• No buy/sell recommendations are being made.
• Please do your own research or consult a registered financial advisor before making any trading decisions.
• Trading involves risk. Always use proper risk management.
________________________________________________________________________________
💬 Found this helpful?
What’s your ideal approach to this setup — breakout entry or pullback into zone?
Drop your thoughts or questions in the comments below ⬇️
🔁 Share this post with your trading community
✅ Follow STWP for clean technical setups backed by price action and volume
🚀 Let’s trade with patience, logic, and clarity!
Be Self-Reliant | Trade with Patience | Learn with Logic
________________________________________________________________________________
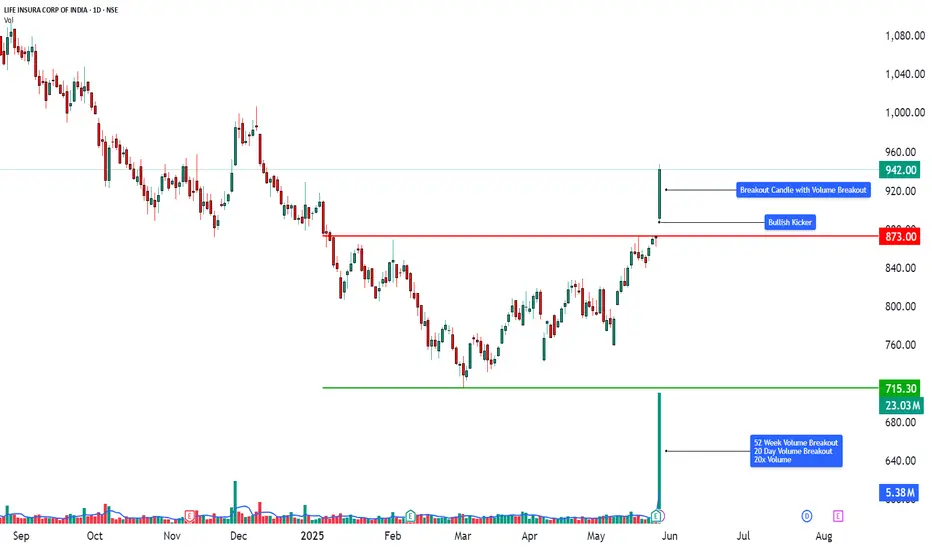
Technical Analysis | Powerful Price Action with Volume Breakout📈 LIFE INSURANCE CORPORATION OF INDIA (LICI) – TECHNICAL ANALYSIS
📆 Date: May 28, 2025
🔍 Timeframe: Daily
________________________________________
Price Action:
LICI surged over 8.12% in today’s session, registering a breakout after weeks of sideways consolidation. The breakout candle was wide-bodied, closing near the day’s high, and supported by a 20-day volume breakout – signaling fresh bullish momentum and accumulation at lower levels.
________________________________________
Chart Pattern / Candlestick Pattern:
• Sideways Consolidation Breakout
• Strong Bullish Candle (Buy Today, Sell Tomorrow setup)
• 52-Week Volume Breakout
• RSI Breakout
• BB Squeeze Exit – Volatility Expansion Phase
• Bollinger Band Expansion + Momentum Surge
• Multiple bullish candlestick patterns across all timeframes = multi-frame trend alignment.
• Gap-Up + Kicker + Long White Candle combo increases conviction of momentum breakout.
• Heikin Ashi continuity indicates a trend in motion without signs of reversal.
________________________________________
Technical Indicators:
• RSI (Daily): 79 – Bullish territory
• MACD: Bullish crossover active
• Stochastic: 97 – Overbought but confirms momentum
• CCI: 206 – Strong upside acceleration
• Volume: 23.03M – Very high vs. 2.24M average, confirms breakout
________________________________________
Support & Resistance Levels:
• Immediate Resistance: ₹964
• Next Resistance: ₹986
• Major Resistance: ₹1024
• Immediate Support: ₹904
• Secondary Support: ₹866
• Major Support: ₹844
• Weak Support Zone: ₹760–₹720
________________________________________
Chart Overview:
This visual representation highlights:
🔸 Clear resistance break with powerful volume
🔸 Bullish momentum confirmed by multiple indicators
🔸 20-day volume breakout indicating accumulation
🔸 Layered resistance levels between ₹964–₹1024
🔸 Tight squeeze breakout offering high R:R setups
________________________________________
Educational Breakdown:
This trade setup showcases:
• Breakout Confirmation: Price + Volume + Momentum Alignment
• Band Expansion: Beginning of volatility trend
• Momentum Shift: From sideways to bullish trend
• Volume Behavior: Institutional interest clearly visible
• Support Layering: Gives fallback levels for pullback traders
Such a chart is a perfect case study in breakout trading, especially post-consolidation and on high volume days.
________________________________________
How to Trade LICI (for learning purpose):
• Entry Example: ₹942.00
• Stop Loss: ₹844.00 (Risk: ₹98.00)
• Target 1: ₹964.00 (Reward: ₹22.00)
• Target 2: ₹986.00 (Reward: ₹44.00)
• Target 3: ₹1024.00 (Reward: ₹82.00)
• Sample Quantity: 50 shares
• RR Ratio: Short-term ~1:0.5; Swing ~1:1 or more
• Aggressive Traders: Can trail stop-loss as price approaches ₹986
• Conservative Traders: Wait for dip toward ₹904 or ₹866 zones
________________________________________
This breakout setup is ideal for swing trades, backed by strong volume and momentum indicators. However, since the RSI and Stochastic are in the overbought zone, traders should manage risk through stop-losses or wait for minor retracements for safer entries.
⚠️ Risk Management Tip: Always trade with a clearly defined stop loss. Avoid entering positions impulsively. It is advisable to start with a smaller quantity and increase your exposure only if the price action confirms the continuation of the trend. Capital protection should always be the priority.
📢 Disclaimer
This content is created purely for educational and informational purposes. It is not intended as investment advice, stock recommendations, or trading tips. Trading and investing in the stock market involves risk. Please consult with a SEBI-registered financial advisor before making any investment decisions. The author/creator is not registered with SEBI and shall not be held responsible for any losses incurred based on this information. Always do your own research and use proper risk management.
👉 If you found this analysis helpful, don’t forget to Follow, so you never miss out on a trade-worthy setup, breakout opportunity, or valuable educational insight again. Stay updated and trade smarter! 💡📈
"🚀 Castrol Stock Analysis: Bullish Signals & Targets📈 NSE:CASTROLIND Technical Analysis (Week Ending 16th Feb 2024)
Closing Price: 💵 207.70
Parabolic SAR: ✅ Buy Signal @ 186.55
EMA & MA Crossover: 🔄 Pending (Bullish Trend Support Expected Soon)
MACD:
MACDR: 📊 6.95 (Crossing Signal)
Histogram: ➕ Positive @ 0.05
Stochastics RSI: 🔄 K51.90 ➡️ D35.58 (Oversold Zone Exit)
%R (Williams Percent Range): 📈 Upward Trend @ 21.52
Fisher Transform: 🐟 0.58 (Bullish Crossover Mid-Range)
🎯 Targets:
First Target: 🎯 213.55 (Recent High)
Second Target: 🎯 220.40 (Fibonacci 1.618 Level)
🛑 Stop Loss: ⚠️ 199.50 (Fibonacci 0.618 Level)
⚠️ Disclaimer: This analysis is for informational purposes only and should not be construed as financial advice. Market conditions are dynamic; trade responsibly based on your own due diligence.
#Castrol #TechnicalAnalysis #StockMarket #NSE #TradingView #Investing #Finance #Stocks #BullishTrends #TradingSignals #MarketAnalysis #FibonacciLevels #StochasticsRSI #MACD #ParabolicSAR

Trade Smart in Turbulent Times in SyngeneNSE:SYNGENE , a leading global discovery, development and manufacturing organization catering to the pharmaceutical and biotech industries, is under the spotlight for this week's technical analysis.
Entry Logic 🎯:
The stock has recently crossed its 50-day moving average (MA) of INR 799, additionally breaching the Fibonacci retracement level of 0.382 at INR 810 . These factors, combined with potential bullish crossovers in Exponential Moving Average Divergence (EMD) and Moving Average Convergence Divergence ( MACD) (12,26,9), lay down a fertile ground for upward movement. The ideal entry point would be upon a strong opening above I NR 810.2 or INR 811.60 (0.5 Fibonacci level).
Target Levels 🎯:
Target 1: INR 823.45
Target 2: INR 843.70
These targets are set based on historical resistance zones and projected upward momentum.
Exit Logic 🚪:
An exit should be considered if momentum drops or reverses before reaching the target levels, or upon hitting the targeted price points for desired profits.
Stop Loss ⚠️:
A stringent stop loss is advised at INR 786. This is a slightly aggressive level aimed at limiting losses should the market sentiment change abruptly.
Technical Indicators 📊:
MACD: Awaiting a bullish crossover to substantiate entry.
Stochastics: Recent crossover observed, bullish sign.
RSI: Also in bullish crossover territory.
%R: Currently in oversell territory - positive.
Fisher 9: Indicating strong buy signal.
Market Sentiment 🌐:
With the broader Indian market expected to exhibit volatility in the forthcoming week, caution is advisable. The high PE ratio of 64.44 and a modest EPS of 12.06 underscore a relatively high valuation, with a low payout ratio of 4.16.
Recommendation 📝:
Syngene International presents a potentially lucrative short-term swing trading opportunity for aggressive traders. The anticipated bullish momentum, if actualized, could render fruitful returns; albeit the inherent market risks necessitate a robust exit strategy and a firm stop loss.
Disclosures and Disclaimers 📢:
This analysis is for informational purposes only and not to be construed as a solicitation or an offer to buy or sell any securities or related financial instruments. The report is based on historical data and prevailing market conditions; the future may unfold differently. All investors are advised to conduct their independent research or consult a financial advisor before making any investment decisions.

TCS : Complete Price action analysisTCS is in a very good support zone.
Trend Line: On daily Time Frame price is on the Trendline which acts as a support.
EMA Support: Price is taking Support on 100days EMA
Candle Stick: Hammer Pattern is formed after the fall from high price which indicates a reversal.
Stochastics: Has just moved from an oversold region which indicates further buying.

CUMMINSIND ::: NEUTRALINSTRUMENT: CUMMINSIND
TIME FRAME: DAY
OTHER TIME FRAMES FOR CONFIRMATION:
1HR, 2HR, 3HR, 4HR, DAY & WEEK
INDICATORS AND THEIR TRENDS:
PSAR: BEARISH
STOCHASTICS: BULLISH
SUGGESTED TREND: SIDEWAYS
END OF DAY PRICE ACTION SUGGESTS BEARISH TREND
CMP: 377.50
SELL BELOW: 372.88
SL: 373.92
TARGET 01: 370.30
TARGET 02: 369.14
My analysis is that CUMMINSIND is expected to stay in a sideways trend for some time. Very good jobbing opportunity in this counter. Expecting it to bounce around 368.35 to388.35. A trend can be established only after a breakout of either of the levels. On the monthly time frame, this counter is expected to be bullish only above 395.50.
RISK DISCLOSURE
Technical analysis of FOREX and INDIAN MARKETS. We are not SEBI REGISTERED ANALYSTS the views expressed here are for our record purposes only. Please consult your personal financial advisor before investing. We are in no way responsible for your profits/losses what so ever.

Power of Stoch RSI indicator in RANGE BOUND Market.NIFTY: 9576.95 (value at 3:29:59 PM) , Settled Value: 9588.05
Power of Stoch RSI indicator along with Pearson's Regression Channel in RANGE BOUND Market.
The Stochastics RSI indicator is used in technical analysis and provides a Stochastic Calculation of the RSI (Relative Strength Index)
which is another momentum based Lead indicator . The main difference here being that,
the Stoch RSI measures the RSI, relative to its RSI’s high and low range over the specified period of time.
It is important to remember that the Stoch RSI is an Indicator of an Indicator making it two steps away from price.
RSI is one step away from price and therefore a stochastic calculation of the RSI is two steps away.
This is important because as with any indicator that is multiple steps away from price,
Stoch RSI can have brief disconnects from actual price movement.
That being said, as a range bound indicator,
the Stoch RSI's primary function is identifying crossovers as well as overbought and oversold conditions.
RSI indicator & Stochastic Oscillator is based on PRICE (CLOSE) . But Stochastic RSI is based on RSI .
Intraday Res: 9604, 9615 , 9643, Weekly Res.: 9616, 9640 - 9658 (HZ) , 9703 (NIFTY SPOT Value)
IN CHART: "Intraday Res" wrongly published As "95004......"
Intraday Sup: 9556, 9538 , 9509. Weekly Sup.: 9538, 9515 - 9497 (BZ), 9450 (NIFTY SPOT Value)
"HZ" & "BZ" => Trend Finding Zone, (Either REVERSAL or Continuation to another Magnitude)
ICHIMOKU analysis: In Last Week Trading Between Tenkan-Sen (9635.05) & Kijun-Sen (9525.47) line & Above CLOUD High Band (9311.59).
any crossover confirm Breakout of "PEARSON's Channel" in either Side.
Volatility: Annual volatility Increased (Weekly Chart).
Short term trend LONG.
PS: If you like Ideas/Analysis, please Like/Share & keep motivated.
Disclaimer: Only For STUDY. For taking Trade Decision Consult Financial Advisor.

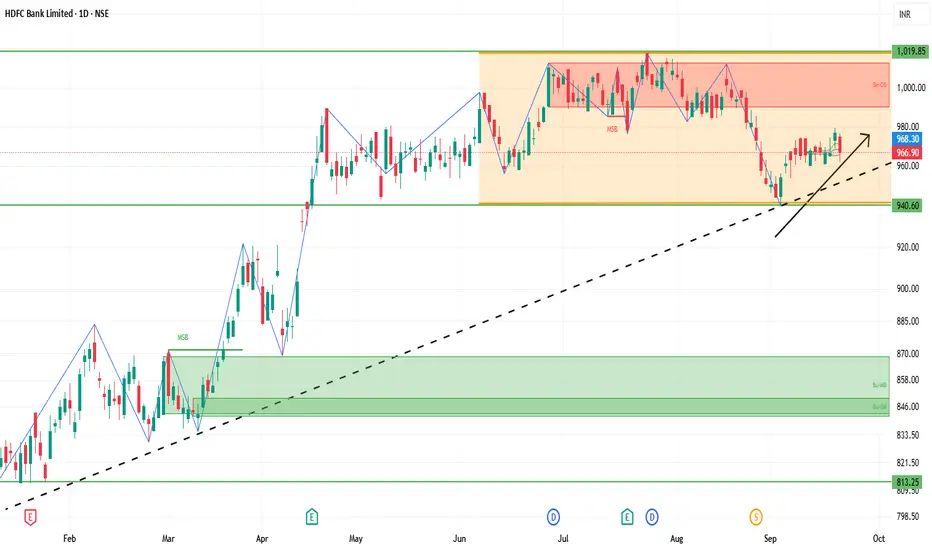
HDFCBANK 1D Time frame📊 Current Snapshot
Current Price: Around ₹967
Day Range: ₹962 – ₹976
52‑Week Range: High ~ ₹1,018, Low ~ ₹805
Volume: Slightly above recent average, showing decent trading interest
🔍 Support & Resistance
Immediate Resistance: ₹975 – ₹983
Higher Resistance: ₹989 – ₹990
Immediate Support: ₹960 – ₹954
Lower Support: ₹946
⚙️ Indicators & Trend
RSI / Stochastic: Neutral to slightly bearish, indicating mild selling pressure
Pivot Level: Around ₹968 – ₹969, meaning price is near equilibrium
Moving Averages: Mixed signals; short-term MAs under slight pressure, long-term trend still intact
🎯 Possible Scenarios
Bullish Case: Break and sustain above ₹980 → next target ₹990+
Bearish Case: Fail at resistance → pullback toward ₹960‑₹954; below ₹954 → possible drop to ₹946
⚠️ Key Points
Resistance zones are tight and need strong volume for a breakout
Price near pivot levels may lead to short-term sideways movement or volatility
Confirmation from trading volume is important for trend sustainability
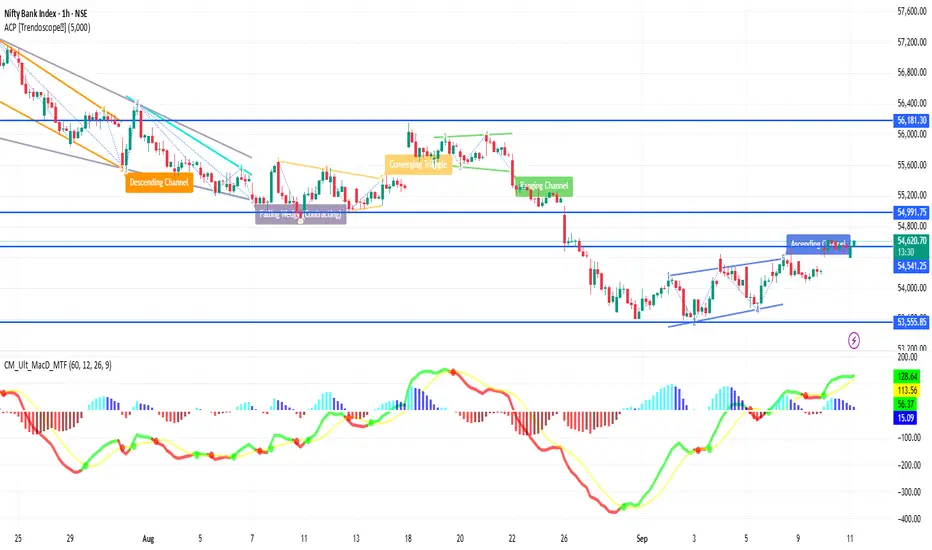
BANKNIFTY 1H Time frameBankNifty 1H Snapshot
Current Price: ~54,581
Recent Range: ~54,400 – 54,700
Bias: Slightly bullish, holding above short-term support
📈 Key Levels
Immediate Resistance: 54,650 – 54,700
Next Resistance: 54,800 → if broken, can open upside momentum
Immediate Support: 54,450
Deeper Support: 54,300 → then 54,000
🔎 Indicators (1-Hour)
RSI: Mid-60s → bullish but not yet extreme
MACD: Positive crossover → supports buying momentum
Stochastic: Near overbought → watch for minor pullback
🧭 Outlook
Bullish Case: Sustained above 54,600 → next push toward 54,700-54,800
Bearish Case: Slip below 54,450 → opens weakness toward 54,300
Overall Bias: Moderately bullish while holding above 54,450
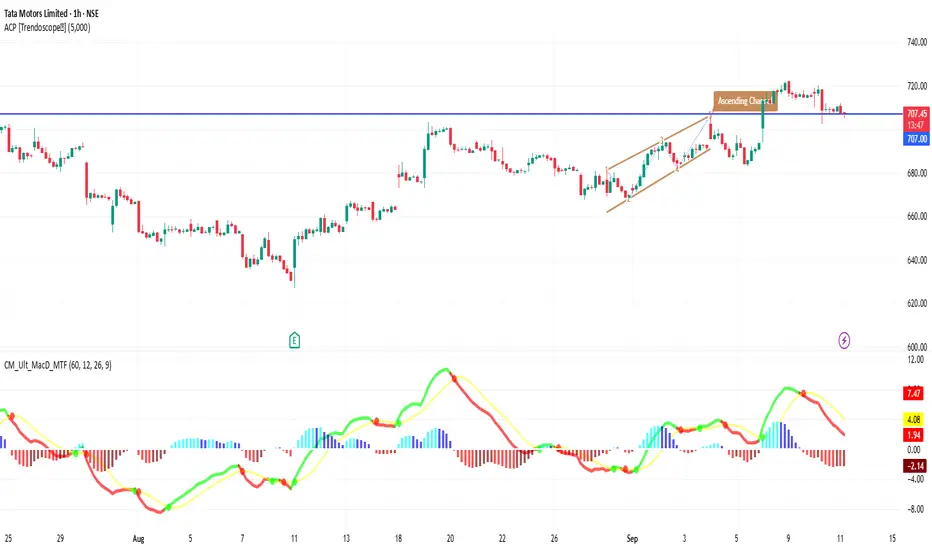
TATAMOTORS 1H Time frameMarket Snapshot
Current Price: ~₹708
Intraday Range: ~₹706 – ₹712
Bias: Sideways to mildly bullish
📈 Moving Averages (1H)
20-hour MA: ~₹707 → acting as short-term support
50-hour MA: ~₹704 → supportive level below
200-hour MA: ~₹699 → strong base, long-term intraday support
All moving averages are aligned above each other → bias is bullish.
🔎 Indicators
RSI (14, hourly): ~59 → Momentum positive, not overbought
MACD (1H): Bullish crossover, showing upward momentum
ADX: ~20 → Trend strength is still weak to moderate
Stochastic: Near overbought → caution for minor pullback
🔧 Key Levels
Support: ₹705 → first support, then ₹700 as stronger base
Resistance: ₹712 → immediate resistance, next at ₹715
🧭 Short-Term Outlook
Bullish Case: Break above ₹712–715 zone could push price toward ₹720+.
Bearish Case: Failure at resistance + RSI overbought may drag it back to ₹705 or even ₹700.
Overall Bias: Slightly bullish, but resistance is close and strong.
Yatharth Hospital & Trauma Care Services Ltd. 4 Hour View4-Hour Time-Frame View – Technical Snapshot
While many platforms don’t provide a dedicated 4-hour technical summary, we can still glean insights from related intraday data—particularly from platforms like Investing.com (5-hour view) and TopStockResearch’s 4-hour-specific metrics.
Investing.com (5-Hour, closest available proxy)
Technical Summary (5-Hour): Strong Buy
Overall Summary (5 Hrs → Strong Buy) indicates strong upward momentum even over shorter intraday frames
TopStockResearch (4-Hour TSR Strength Index)
This platform provides a more granular “4-Hour” breakdown:
TSR Strength Index: Strong Bullish — YATHARTH is more bullish than 97–98% of stocks
Indicators:
RSI: ~69–70 → Buy
MACD: ~20 → Buy
ADX: ~36 → Buy
Stochastic: ~42 → (Neutral or Buy range)
ROC: ~4–5 → Buy
Supertrend: ~647 → indicating upward trend
Williams %R: Slightly negative (near overbought region)
CMF (Chaikin Money Flow): Positive (~0.13) → Buying pressure
PSAR: ~674
These inputs together reinforce a strong bullish bias over the 4-hour window
Pivot Levels (Intraday / 4-Hour Range)
TopStockResearch provides intraday pivot level analysis:
Current Price (~₹749) is trading above all primary resistance levels—including R3 (Classic), Camarilla R4, Fibonacci R3, Woodie’s R2, and DeMark R1, signaling a robust intraday breakout

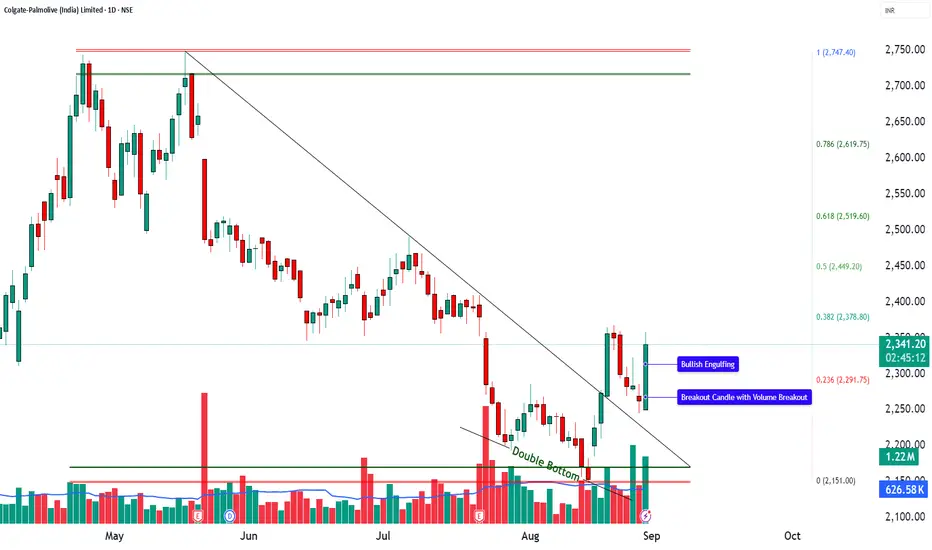
COLPAL | Double Bottom Retest + Volume Breakout🚀 COLPAL | Double Bottom Retest + Volume Breakout
📌 Pattern Setup:
🔹 Double Bottom retest spotted
🔹 Bullish Engulfing candle at support
🔹 Breakout candle with strong volume surge
📊 Technical Snapshot:
RSI: 58 → Healthy momentum
MACD: Bullish crossover
CCI: 107 → Strong positive bias
Stochastic: 89 → Overbought but strong
Volume: 1.22M vs 626k avg → ⚡ Breakout confirmed
🛠 Levels to Watch:
🔼 Long Entry: Above 2357.9
🔽 Stoploss: Below 2243
🎯 Targets: 2472 | 2587
📉 Pullback Buy Zone: 2291–2273
❌ Invalidation: Below 2207
⚡ Resistance Levels: 2382 | 2424 | 2490
⚡ Support Levels: 2274 | 2208 | 2167
🎯 Fibonacci Zones: 2378 → 2449 → 2519 → 2619 → 2747
💡 View:
COLPAL is breaking out from a Double Bottom Retest with strong volume & bullish signals. Sustaining above 2358 could open the gates towards 2472 – 2587 in the short term.
👉 Bias: Bullish till 2207 holds.
⚠️ Disclaimer – Please Read Carefully
The information shared here is meant purely for learning and awareness. It is not a buy or sell recommendation and should not be taken as investment advice. I am not a SEBI-registered investment advisor, and all views expressed are based on personal study, chart patterns, and publicly available market data.
Trading — whether in stocks or options — carries risk. Markets can move unexpectedly, and losses can sometimes exceed the money you have invested. Past performance or past setups do not guarantee future results.
If you are a beginner, treat this as a guide to understand how the market works — practice on paper trades before risking real money. If you are experienced, always assess your own risk, position sizing, and strategy suitability before entering trades.
Consult a SEBI-registered financial advisor before making any real trading decision. By engaging with this content, you acknowledge full responsibility for your trades and investments.
💬 Found this useful?
🔼 Give this post a Boost to help more traders discover clean, structured learning.
✍️ Drop your thoughts, questions, or setups in the comments — let’s grow together!
🔁 Share with fellow traders and beginners to spread awareness.
👉 “If you liked this breakdown, follow for more clean, structured setups with discipline at the core.”
🚀 Stay Calm. Stay Clean. Trade With Patience.
Trade Smart | Learn Zones | Be Self-Reliant 📊
Laxmi Organic Industries Ltd. 1 Day View1-Day Technical Overview & Key Levels
Daily Technical Indicators (Investing.com – Aug 28, 2025)
Overall sentiment: Neutral on the daily timeframe
Indicators:
RSI(14): ~32.74 — signals Sell (approaching oversold)
MACD: –2.49 — Sell
Stochastic: ~35.07 — Sell
Many indicators lean bearish, though the summary remains neutral
Moving Averages (Investing.com – Aug 28, 2025)
Mixed signals:
Sell from MA5, MA10, MA20, MA50.
Buy from MA100, MA200.
Overall: 4 buy vs 8 sell signals from various MAs
Pivot Points & Intraday Levels (Investing.com – Aug 28, 2025)
Classic Pivot:
Support: S1 = ₹207.57, S2 = ₹207.24, S3 = ₹206.83
Pivot: ₹207.98
Resistance: R1 = ₹208.31, R2 = ₹208.72, R3 = ₹209.05
Fibonacci Pivot:
Similar zone: S1 ≈ ₹210.54, Pivot ≈ ₹207.98, R1 ≈ ₹216.99
Suggested Next Steps
Watch price action around ₹205–210 for reversal setups (bullish engulfing, RSI bounce).
A sustained break above ₹213–215 could open the way toward ₹220+.
Conversely, failure to hold ₹205–208 might trigger deeper correction toward ₹200 or below.
Consider combining daily with intraday (hourly/15-minute) to capture momentum early.

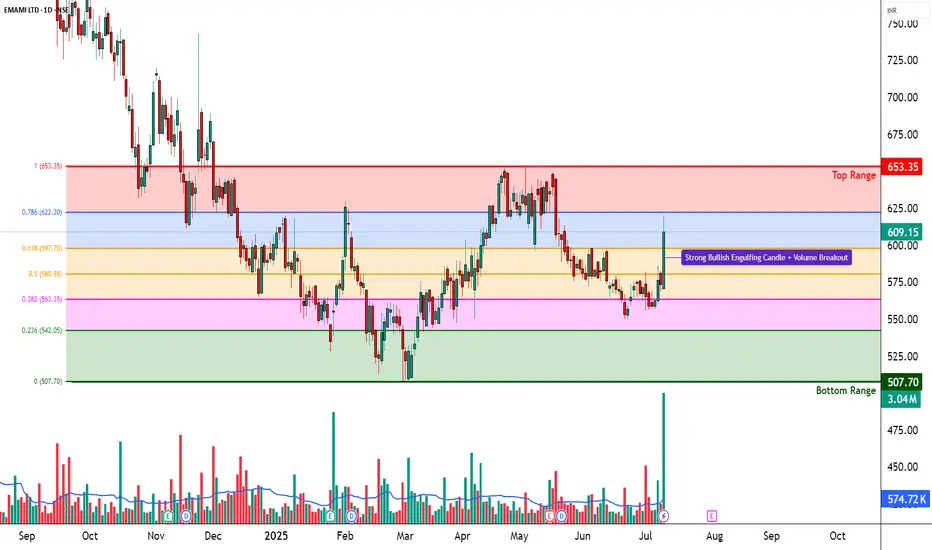
EMAMI LTD – Strong Bullish Breakout | Volume Spike________________________________________________________________________________
📈 EMAMI LTD – Strong Bullish Breakout | Volume Spike | Structure-Based Trade Idea
🕒 Chart Type: Daily Chart
📆 Date: July 9, 2025
________________________________________________________________________________
📌 Price Action:
EMAMI LTD has delivered a decisive breakout from its recent compression phase after trading sideways between 570–585 for several sessions. On July 9, the stock posted a wide-range bullish candle, closing at 609.15, backed by high delivery and breakout volume. The candle formed with an open = low structure, a strong intraday move, and solid closing near the high, confirming buyer dominance. This marks a shift in control from range-bound consolidation to potential momentum continuation.
________________________________________________________________________________
📊 Chart Pattern:
This breakout is from a Box Compression Zone, where the stock had been moving within a tight band. This is a textbook bullish compression breakout, often seen before short-term trend expansions. The range contraction, followed by a sudden expansion with volume, signals that smart money may be entering. Though not a VCP, the narrowing of ranges followed by a strong candle reflects controlled buildup and release of bullish pressure.
________________________________________________________________________________
🕯️ Candlestick Pattern:
Bullish Engulfing
Open = Low Candle
Momentum Continuation Candle
The current candle also fits the "Buy Today, Sell Tomorrow" setup logic, especially useful for short-term intraday/momentum traders from an educational lens.
________________________________________________________________________________
🔊 Volume Analysis:
Volume on July 9 crossed 3x the 20-day average, showing an institutional-grade breakout. What's more important is that this move comes after multiple low-volume sessions, which indicates that the base was silent before this burst — classic sign of accumulation followed by breakout. The presence of a BB squeeze and volume compression breakout confirms the start of a volatility expansion phase.
________________________________________________________________________________
📈 Technical Indicators:
RSI (Daily): 65 – strong and rising
MACD: Bullish crossover on Daily, but flat on Weekly/Monthly
CCI: 319 – strong bullish momentum reading
Stochastic: 85 – in a bullish zone, showing follow-through possibility
SuperTrend & VWAP: Bullish bias confirmed
BB Squeeze: Compression off, likely start of expansion
These indicators align well to show a breakout backed by momentum and volume expansion.
________________________________________________________________________________
🧱 Support & Resistance:
🔺 Resistance Zones to Watch:
629.23 – First key level where supply may come in
649.32 – Major resistance from previous swing
678.63 – Long-term resistance zone
Top Range: 653.35 – Official top of the recent consolidation base
🔻 Support Levels:
579.83 – Immediate support post-breakout
550.52 – Minor swing base
530.43 – Deeper demand level from which recent trend started
Bottom Range (Demand Zone): 507.70 – Long-term structural support
________________________________________________________________________________
👀 What’s Catching Our Eye:
What stands out in this chart is the confluence of breakout signals — RSI breakout, engulfing candle, Bollinger squeeze off, and high delivery volume — all firing together. The open-low bullish bar is not just random price movement; it's a statement from buyers that they're ready to defend this zone.
________________________________________________________________________________
🔍 What We’re Watching For:
We’re watching if EMAMI can sustain above 609–620 for the next couple of sessions. A consolidation above this zone will indicate strength. On the flip side, any rejection and close back below 579.83 will raise flags. We're also watching for any mild retest toward 580–585 on low volume, which can offer a secondary low-risk entry opportunity.
________________________________________________________________________________
✅ Best Buy Level for Equity (Low Risk Idea):
Breakout Entry: Above 620 with follow-through or retest confirmation
Pullback Buy: Into the 579.83–585 support zone with a strong bounce candle
Stop Loss: 560.33 (structure-based, on closing basis)
Risk-Reward Lens: Start with a 1:1 target; trail for 1:2+ based on structure — avoid fixed upside projections
________________________________________________________________________________
💼 Sector Tailwinds:
The FMCG and personal care space is seeing renewed demand due to rising rural consumption, price stability in raw materials, and stronger brand-led companies gaining market share. EMAMI, with a wide product portfolio, is well-positioned to benefit. Fundamentally, the stock is also recovering from long-term price compression — aligning well with the recent breakout.
________________________________________________________________________________
⚠️ Risk to Watch:
A close below 579 will invalidate the breakout setup
Indicators are strong but slightly stretched, so chasing blindly can invite volatility
The price must confirm above 620+ for the trend to gain broader legs
Always wait for follow-through before committing fresh capital
________________________________________________________________________________
🔮 What to Expect Next:
If EMAMI sustains above 609–620, the stock could gradually move toward 629.23 and test higher levels like 649.32. But if it fails to hold above the breakout candle, we may see a pullback to 580–585. Either way, price and volume in the next 2–3 sessions will confirm whether this is a false breakout or the start of a real trend.
________________________________________________________________________________
🧠 How to Trade EMAMI LTD (For Educational Use Only):
Breakout Plan (Hypothetical Setup):
🔹 Entry: Above 620 only if follow-through confirmation candle appears
🔹 Stop Loss: 560.33 (on closing basis)
🔹 Pullback Buy: Into 580–585 with same SL, if bullish reversal shows
🔹 Risk-Reward: 1:1 minimum; trail for more
🔹 Position Sizing: Use capital allocation based on risk tolerance — never go all-in on breakout
________________________________________________________________________________
⚠️ Disclaimer (Please Read):
• This chart is shared for educational purposes only and is not investment advice.
• I am not a SEBI-registered advisor.
• The information provided here is based on personal market observation.
• No buy/sell recommendations are being made.
• Please do your own research or consult a registered financial advisor before making any trading decisions.
• Trading involves risk. Always use proper risk management.
________________________________________________________________________________
💬 Found this helpful?
What would be your ideal trade in EMAMI — breakout follow-through or support pullback?
Drop your thoughts in the comments below ⬇️
🔁 Share this with your trading community
✅ Follow STWP for clean technical setups backed by price action and volume
🚀 Let’s trade with patience, logic, and clarity!
Be Self-Reliant | Trade with Patience | Learn with Logic
________________________________________________________________________________
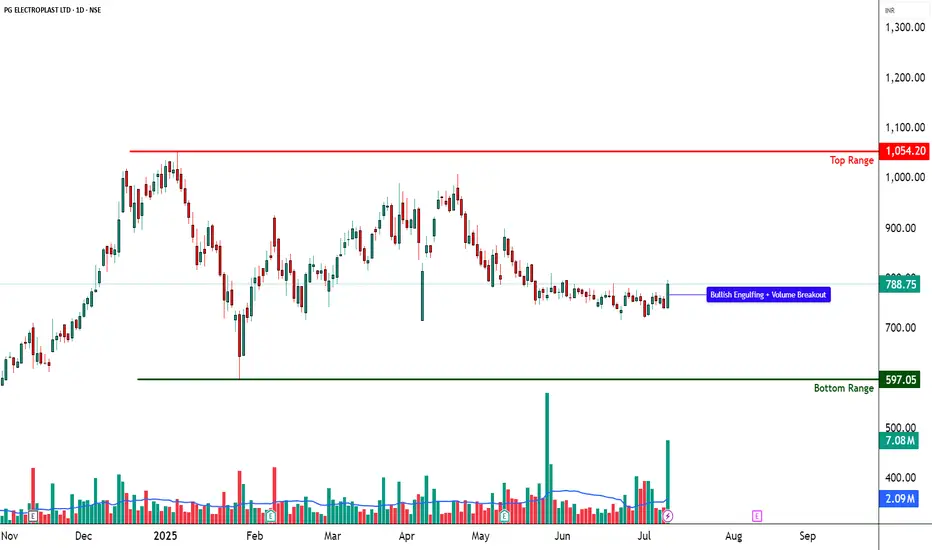
PG ELECTROPLAST – Volume Breakout from Tight Base________________________________________________________________________________
📈 PG ELECTROPLAST – Volume Breakout from Tight Base | Bullish Momentum Brewing
🕒 Chart Type: Daily Chart
📆 Date: July 9, 2025
________________________________________________________________________________
📌 Price Action:
PG ELECTROPLAST LTD has shown an impressive breakout from a tight base, rising from the 735–755 congestion zone with a wide-range bullish candle on July 9. The candle had an open = low structure, closed near the high, and was backed by massive volume. This signals clear buying strength and suggests that bulls are stepping in after a period of low volatility and sideways movement. The stock had been trading in a narrow band and has now broken out with strong conviction, hinting at the beginning of a possible trend reversal or a short-term momentum rally.
________________________________________________________________________________
📊 Chart Pattern:
The chart displays a tight base breakout from a multi-week compression zone. While not a textbook wedge or flag, the narrowing range combined with flat moving averages suggested the stock was coiling up for a move. The breakout candle pierced the upper end of the range, with volume confirming that it wasn't a false push. This kind of price behaviour often leads to trend expansion — especially when confirmed by broader volume activity.
________________________________________________________________________________
🕯️ Candlestick Pattern:
Bullish Engulfing Candle
Open = Low Structure
Strong Bullish Range Candle
This combination, particularly when seen after a base, is a strong signal of fresh buying interest. It also fits the “Buy Today, Sell Tomorrow” short-term momentum logic, especially for educational model trades.
________________________________________________________________________________
🔊 Volume Analysis:
The breakout was supported by a 10-day volume breakout, with volumes spiking over 3x the average. This is not just intraday noise — it reflects strong delivery participation and genuine interest. Volume spike at breakout is a key sign of smart money involvement. Moreover, the spike occurred from a compressed base, which adds further weight to the strength of the breakout.
________________________________________________________________________________
📈 Technical Indicators:
RSI (Daily): 56 — rising from neutral territory, not yet overbought
MACD: Bullish crossover active on Daily & Monthly
Stochastic: 90 on Daily – indicates strong upward momentum
CCI: 155 – overbought but in a bullish continuation zone
Bollinger Bands: Price broke out of a tight squeeze zone — start of volatility expansion phase
BB Squeeze + Bullish VWAP: Adds confirmation that the trend is beginning to expand
________________________________________________________________________________
🧱 Support & Resistance:
🔺 Resistance Levels:
810.43 – First resistance to watch above current price
832.12 – Prior swing level; price may pause or consolidate here if momentum continues
867.33 – Longer-term resistance zone, marked as a level of interest
Top Range: 1054.2 – Long-term weak resistance zone that triggered the previous major selloff
🔻 Support Levels:
753.53 – Closest support below breakout
718.32 – Well-tested swing level; acted as floor in recent range
696.63 – Important structural support
Bottom Range (Demand Zone): 597.05 – Major long-term support, last zone from where price rallied strongly
________________________________________________________________________________
👀 What’s Catching Our Eye:
The combination of price compression, bullish engulfing breakout, and high volume participation makes this setup stand out. Volume is not just high — it’s clean and backed by structure. The candle formation, RSI breakout, and BB squeeze all come together, creating a powerful setup for momentum continuation. This kind of alignment is rare and usually signals smart money entry.
________________________________________________________________________________
🔍 What We’re Watching For:
The most critical zone is the 796.90 breakout level. If price sustains above it for the next couple of sessions, the structure remains intact. We’re also watching for a possible retest toward the 753–755 zone — if the stock pulls back there on low volume and bounces again, it may offer a low-risk entry setup. Continuation beyond 810 could build momentum, but we will rely on risk-reward and price behaviour — not predictions.
________________________________________________________________________________
✅ Best Buy Level for Equity (Low Risk Idea):
Breakout Entry: Above 796.90, only on follow-through or sustained closing above breakout zone
Pullback Entry: Into the 753.53–755 support zone if the price stabilizes and shows a bullish reversal
Stop Loss: Structure-based, below 736.95 (on closing basis)
Risk-Reward Thinking: Look for 1:1 initially, then trail the stop as the move develops; no fixed projections — price action will guide the outcome
________________________________________________________________________________
💼 Sector Tailwinds:
PG ELECTROPLAST operates in the electronics and contract manufacturing sector — two spaces getting a major boost from PLI schemes, China+1 shift, and rising domestic demand. India’s push toward import substitution, rising middle-class consumption, and government incentives are all helping businesses like PG scale up. This provides a strong macro tailwind to any technical strength seen on charts.
________________________________________________________________________________
⚠️ Risk to Watch:
If price slips back below 753, the breakout weakens
A close below 736.95 negates the breakout setup and could invite selling pressure
Indicators are showing strength, but slightly stretched — so expect volatility and avoid over positioning
Never trade based only on breakout excitement — always wait for confirmation and manage risk first
________________________________________________________________________________
🔮 What to Expect Next:
If the price holds above 796.90, the path toward 810.43 may open up quickly. Sustained volume and consolidation near highs would indicate strength, while sharp rejection could signal a trap. A minor pullback to support zones (753–755) could offer a second opportunity if structure holds. The next few candles will tell us whether this breakout becomes a trend or just a temporary spike.
________________________________________________________________________________
🧠 How to Trade PG ELECTROPLAST (For Educational Use Only):
Breakout Plan (Hypothetical):
🔹 Entry: Above 796.90 (only if price sustains)
🔹 Stop Loss: 736.95 (closing basis; risk-controlled)
🔹 Trade Logic: Use position sizing as per capital and SL distance
🔹 Risk-Reward: Look for 1:1 minimum, trail for 1:2+ if structure expands — don’t fix targets, let the chart lead
🔹 Pullback Buy: Into 753–755 zone with same SL (if structure supports)
________________________________________________________________________________
⚠️ Disclaimer (Please Read):
• This chart is shared for educational purposes only and is not investment advice.
• I am not a SEBI-registered advisor.
• The information provided here is based on personal market observation.
• No buy/sell recommendations are being made.
• Please do your own research or consult a registered financial advisor before making any trading decisions.
• Trading involves risk. Always use proper risk management.
________________________________________________________________________________
💬 Found this helpful?
Where would you look for a trade in PG — breakout follow-through or pullback into the support zone?
Share your thoughts or questions in the comments ⬇️
🔁 Share this with your trading community
✅ Follow STWP for clean technical setups backed by price action and volume
🚀 Let’s trade with patience, logic, and clarity!
Be Self-Reliant | Trade with Patience | Learn with Logic
________________________________________________________________________________
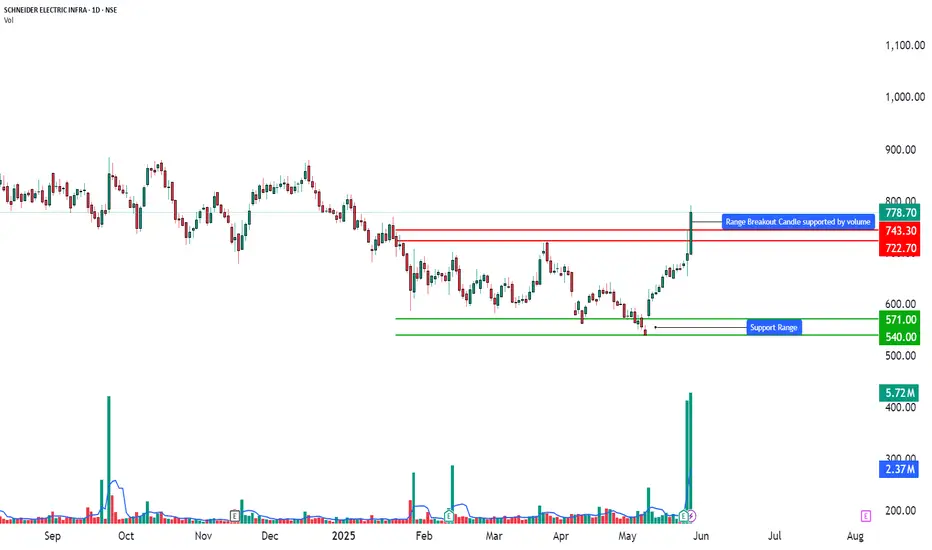
Technical Analysis - 52-Week Volume Breakout📈 SCHNEIDER ELECTRIC INFRA – TECHNICAL ANALYSIS
📆 Date: May 28, 2025
🔍 Timeframe: Daily
________________________________________
Price Action:
Schneider Electric Infra soared over 11.5% today with a strong bullish candle breaking above recent consolidation levels. This wide-range breakout candle marks a 20-day and 52-week volume breakout, indicating heavy accumulation and institutional participation. The price surged from support near ₹570 to close around ₹778.70, confirming bullish momentum.
________________________________________
Chart Pattern / Candlestick Pattern:
• Breakout Setup
• 52-Week High Breakout
• Bullish Candle with strong body and large volume
• BB Squeeze Breakout (Volatility Expansion Expected)
• Bollinger Band Expansion
• Volume Spike – highest in over a year
• Daily Chart: Bullish Initiation pattern on Heikin Ashi
• Weekly Chart: Bullish Continuation pattern formed
• Monthly Chart: Spinning Top, but with bullish undertones confirmed by volume
• Recent Candles: Long White Candle patterns on daily and monthly charts (May 28, 2025)
________________________________________
Technical Indicators:
• RSI (Daily): 79 – Strong bullish territory
• MACD: Bullish crossover active
• Stochastic: 95 – Overbought but shows strong momentum
• CCI: 188 – Momentum phase, institutional buying signs
• Volume: 5.72M – Extremely high, 20-day volume breakout
________________________________________
Support & Resistance Levels:
• Immediate Resistance: ₹814.75
• Next Resistance: ₹850.80
• Major Resistance: ₹910.20
• Immediate Support: ₹719.30
• Secondary Support: ₹659.90
• Major Support: ₹623.85
• Weak Support Zone: ₹570–₹550
________________________________________
Chart Overview:
The chart highlights:
🔸 Strong bullish candle piercing prior resistance
🔸 Volume breakout aligned with price breakout
🔸 Clear resistance cluster above ₹814–₹910
🔸 Support zone well established below ₹720
🔸 Multiple confirmations from indicators and volume surge
🔸 Entry was marked at ₹791.40 with SL at ₹651.85
________________________________________
Educational Breakdown:
This is a textbook breakout with volume confirmation setup:
• Price Action: Breakout from resistance zone
• Momentum Indicators: Strongly aligned
• Volume: Institutional spike with confirmation of trend continuation
• Band Expansion: Signals beginning of high volatility trend
• Entry Confirmation: RSI + BB + Volume breakout + Trend indicators
This setup indicates a fresh trend beginning post-accumulation phase, making it suitable for swing to positional trades. The aggressive rise also suggests short-term profit-taking zones near the immediate resistance, while medium-term targets remain valid.
________________________________________
How to Trade Schneider Electric Infra (for learning purpose):
• Entry Example: ₹791.40
• Stop Loss: ₹651.85 (Risk: ₹139.55)
• Target 1: ₹930.95 (Reward: ₹139.55)
• Target 2: ₹1070.45 (Reward: ₹279.05)
• Sample Quantity: 50 shares
• RR Ratio: 1:1 to 1:2
• Aggressive Traders: Can ride trend with trailing stop
• Conservative Traders: Wait for pullback near ₹720–₹700 before entry
⚠️ Risk Management Tip: Always trade with a clearly defined stop loss. Avoid entering positions impulsively. It is advisable to start with a smaller quantity and increase your exposure only if the price action confirms the continuation of the trend. Capital protection should always be the priority.
📢 Disclaimer
This content is created purely for educational and informational purposes. It is not intended as investment advice, stock recommendations, or trading tips. Trading and investing in the stock market involves risk. Please consult with a SEBI-registered financial advisor before making any investment decisions. The author/creator is not registered with SEBI and shall not be held responsible for any losses incurred based on this information. Always do your own research and use proper risk management.
👉 If you found this analysis helpful, don’t forget to Follow, so you never miss out on a trade-worthy setup, breakout opportunity, or valuable educational insight again. Stay updated and trade smarter! 💡📈