NBCC (PSU ) GOVERMENT CONSTARCTION COMPANY NBCC (PSU ) GOVERMENT CONSTARCTION COMPANY
weekly chart
forming cup and handle
bullish rsi @ 70
bullish macd
bullish stochastic
buy cmp @ 54
sl @ 40
target @ 102
buy and sit relax .
Search in ideas for "stochastic"

PARAG MILK FOODPARAG MILK FOOD
weekly chart
forming reversal pattern
bullish rsi @ 69
bullish macd crossover
bullish stochastic crossover
buycmp @ 146
sl @ 110
target @ 301

TATA ELXSITATA ELXI
Daily chart forming triangle pattern
bullish rsi @ 67
bullish macd crossover start
bullish stochastic crossover
buy @ cmp 3742
SL @ 3564
target @ 4168

TATA MOTORS DVRTATA MOTOR DVR
MONTHLY CHART
BULLISH RSI
BULLISH MACD CROSSOVER
BULLISH STOCHASTIC CROSSOVER
BUY CMP @ 163
SL NECK LINE
TARAGET @ 215 AND @ 264

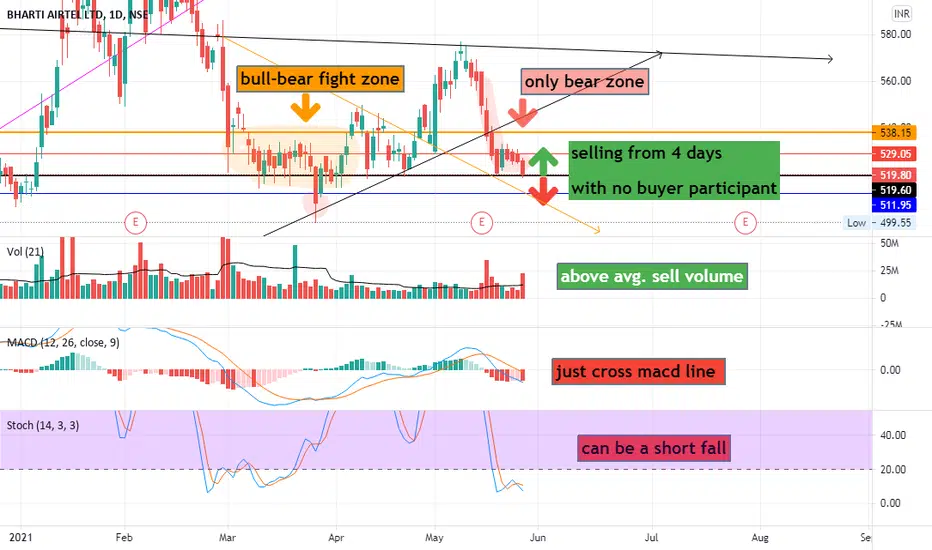
airtel on 50:50 vergebuy - selling from 4 days without any buyer intervention
above average sell volume means seller put all their effort
sustaining 918 level which was few week back crucial level on 25 march
nifty is stepping up with all stock,why to left behind airtel
sell - macd cross mid line with selling candle
stochastic mini crossover below zero level
breaking 918 level but last closing candle drag to safe zone
HCL info at 3 year long - rejection level4 time rejection from 2019-2021
double u shape recovery - bullish
volume growth - bullish
IT/software sector - bullish
indicator -
stochastic - extreme bullish

RELIANCE INDUSTRIEDCurrently. ril trading in a symmetrical triangle pattern.
first tgt - 2150
second tgt 2200
third tgt 2300-2350...
( potenial to bbreach to previous life time high levels near 2370)
rsi positive
macd positive croosover
stochastic positive crossover

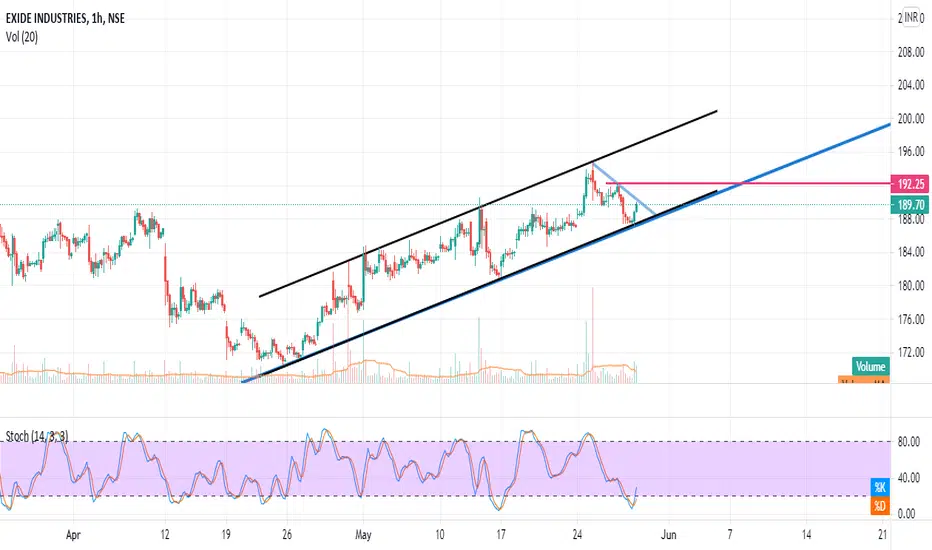
Exide AnalysisNSE:EXIDEIND
Exide currently taking support at uptrendchannel.
Good volume buying near the support and stochastic in 1hr chart is in oversold level.
Can be considered for positional buy for few days
what a lovely pre conviction singalresistance from 2 year old trend line
volume breakout
bullish macd
bullish stochastic
entry @ - horizontal line
target - orange line

paint your home in unlockdown
moving in channel
rejection from top line of channel
macd, stochastic - bullish crossover
two possibility - given of movement
stop loss - thick dotted red line - 542

PEL swing trade ideaA triple bottom pattern is being formed with stochastic RSI and MACD divergence. Price has even given a breakout of 50 ema along with strong volume. Buy above the neckline of triple bottom pattern.

NIFTY U turn from UML?Last time nifty had U turn from median line
this time it may take U turn from the UML of the pitch fork.
Last time stochiastic was in over sold condition
This time also stochiastic is in over sold condition in hourly time frame.
cross over in stochastic will result in powerful hidden divergence.
as long as it does not violate the Uml and channel, one can go long.
Don't forget to like my post.
follow me to get updates

Flag and Pole Pattern in Aurobindo PharmaAurobindo Pharma forming a flag and pole pattern. Stochastic RSI in oversold zone. Trend line touching. Trend line had worked as demand zone in the past.

M&M swing trade ideaPrice has given a very strong breakout above the descending trend line and 50 ema with huge volume. A double bottom pattern has also been formed. MACD and stochastic RSI are signaling buy.

ASHOKLEY swing trade planPrice has given a strong breakout from the triangle pattern with a strong marubozu candle and with huge volume, from near the support area. Price has even broken 50 ema. MACD and stochastic RSI too are giving buy signals.

BANK NIFTY Weekly (Forecast - MAY)Bank Nifty Forecast from May 17 to May 24:
Price Action Losing Momentum
ADX Shows a RANGING PERIOD.
Stochastic RSI Show a +ve reading.
My own developed indicator shows a -ve position this week.
Overall Strength RED this week (-VE) {PUT OPTION NSE:BANKNIFTY }
Thanks for using your Valuable time. Leave a like which helps me to do better. Follow me for Daily Signals,
Get updates on, FOREX, Stocks, INDICES, Crypto, #--CFD's to be expected soon.

BANK NIFTY AnalysisBank Nifty Analysis for (May 19, 2021):
Overall the Market has ended in Ranging Type today(May 18)
ADX Shows a Reading above 25. (+ve)
Stochastic RSI shows a Reading as (-ve)
My Own Developed Indicator recommends to PUT Option (-ve)
Overall Strength on Tomorrow (RED NSE:BANKNIFTY ) {PUT OPTION}
Thanks for using your Valuable time. Leave a like which helps me to do better. Follow me for Daily Signals,
Get updates on, FOREX, Stocks, INDICES, Crypto, #--CFD's to be expected soon.

VRLLOG swing trade ideaFalling wedge pattern / triangle pattern has been broken with a strong volume, price has taken support on previous resistance and support and has bounced on 200 ema, price has even broken 50 ema, macd and stochastic RSI have signaled buy.

BTC Breaks Long Term Trend As Tesla Ditches It-BTC has fallen to a two month low as Tesla announces suspension of BTC payments
-150 MA has held BTC from a further downfall
-Bullish divergence spotted on RSI
Bitcoin has broken out of a long 3 month range of $10,000. After Elon Musk announced Tesla will no longer be accepting BTC due to environmental reasons, BTC broke its major support of $55,000 and quickly fell over 15%. BTC is now is now in scary waters.
While looking at the chart, BTC has broken a long term trend that has been held for nearly 6 months. This is not a good sign as there is much FUD spreading about Bitcoins environmental impact. BTC must hold major support range of $46,500-$48,000 or we can experience a large fall to $40,000. As of now, the 150MA has held the price of BTC as it touched this moving average for the first time in 6 months.
If BTC can break above $48,000 and hold, there will be a decent revival to $51,400. In the case that BTC holds this resistance, next up is $54,400. BTC has grown over 1000% in a year. With this being said, there is a good chance more downside might occur before BTC resumes a bullish uptrend.
While looking at the Stochastic RSI, we can see that strength has reset to oversold levels. If the strength can bound above 30, expect a revival to minimum $51,400. The regular RSI also confirms a small bullish upswing as it has printed a bullish divergence. This occurs when price makes a Lowe low but RSI makes a higher low.
BTC intraday levels
Spot rate: $48,100
Trend: Bearish
Volatility: High
Support: $46,400
Resistance: $48,000

BTC Breaks Long Term Trend As Tesla Ditches It-BTC has fallen to a two month low as Tesla announces suspension of BTC payments
-150 MA has held BTC from a further downfall
-Bullish divergence spotted on RSI
Bitcoin has broken out of a long 3 month range of $10,000. After Elon Musk announced Tesla will no longer be accepting BTC due to environmental reasons, BTC broke its major support of $55,000 and quickly fell over 15%. BTC is now is now in scary waters.
While looking at the chart, BTC has broken a long term trend that has been held for nearly 6 months. This is not a good sign as there is much FUD spreading about Bitcoins environmental impact. BTC must hold major support range of $46,500-$48,000 or we can experience a large fall to $40,000. As of now, the 150MA has held the price of BTC as it touched this moving average for the first time in 6 months.
If BTC can break above $48,000 and hold, there will be a decent revival to $51,400. In the case that BTC holds this resistance, next up is $54,400. BTC has grown over 1000% in a year. With this being said, there is a good chance more downside might occur before BTC resumes a bullish uptrend.
Whil looking at the Stochastic RSI, we can see that strength has reset to oversold levels. If the strength can bound above 30, expect a revival to minimum $51,400. The regular RSI also confirms a small bullish upswing as it has printed a bullish divergence. This occurs when price makes a Lowe low but RSI makes a higher low.
BTC intraday levels
Spot rate: $48,100
Trend: Bearish
Volatility: High
Support: $46,400
Resistance: $48,000

MATIC Retraces From ATH as Crypto Sells Off-MATIC fell -23% from high as Tesla reverts BTC support
-Major support comes in at $0.925
-MACD signaling more downside may come
MATIC has had an awesome last month as price rose over 300%. MATIC hit an ATH of $1.22 but shortly after fell as the entire market took a hit. MATIC has risen drastically and now may be the time to be concerned of large potential retracement.
The large bold trends represent a broadening wedge that has formed over the last week. The pattern can be either bullish or bearish as a breakout of either trend will produce a large parabolic move. As seen on the chart, MATIC just has a rejection on its top trend line. If price can’t hold minor support of $1.02, expect a pullback to major support of $0.92.
During the fast decline price bounced perfectly off the 30MA. This level is met with major support of $0.92 and if these levels break down, expect a retracement to $0.84. In the case bulls gain more strength, the level to break and hold is $1.17.
While looking at the MACD we can see a bearish cross is impending. The histogram confirms this as its about to tick red after a long bull streak. The stochastic is heading down nearing the 50 level. If this fails to hold we can confirm more retracement is ahead.
MATIC intraday levels
Spot rate: $$1.03
Trend: Bullish
Volatility: High
Support: $1.02
Resistance: $1.17

HAVELLS swing trade planFalling wedge pattern is being formed at a major support level along with stochastic RSI divergence, wait for the stock to break above 50 ema to buy.

SUSHI Looks good!SUSHI has broken the recent trend line and seems to have found support, stochastic RSI also supports a rise..looks like a good buy to me!
