Search in ideas for "stochastic"
Only After Flag Pattern Breakout Go Long Above 77Seen flag formation in Ashok Leyland. Go long if breakout for immediate target of 80 and short term target is 86.50+ according to flag pattern. Currently, It's trading in the oversold zone and stochastic RSI shows bullish crossover.
Trade:
Buy Ashok Layland @77
SL 76
Target 80.50 83 86.50+

Tatamotors ReversalTatamotors has been on an uptrend after the March lows. It has very well crossed the 200 SMA with good volumes. It is retesting the 200 DMA as well as the new trend line that it has created. If the markets go green today, I'm pretty sure Tatamotors will continue its uptrend. Also the Stochastic RSI is showing oversold. NSE:TATAMOTORS
Target: 150
SL : Just below 200SMA on a closing basis.

USDCAD-Expecting a PB in 3 waves to 1.3200 for wave (X)..Market Commentary:
LEARNING ELLIOTT WAVES IS LITTLE BIT TOUGH (FOR ME IN BEGINNING) BUT I TOOK IT AS A CHALLENGE AND THAT IS NOT IMPOSSIBLE ALSO...
First have an look for the positional trend i shared here previous....if you are a follower of me...and sometimes i will share the counter trend trade also in 15 mins and 1hr...but that is risky ones...so if the trend is bearish or bullish , if i am expecting the correction...book the profit there and wait the correction to end and again go with the trend....DONT TRADE THE COUNTER TRADE SETUP...you will took loss too...try to identify the short term pull back and the long term pull back after that took small lots in the short term PB with strict stop and go with big lots in the trend side that is long term. I WONT TOOK ALL THE TRADE PLAN SHARED HERE...
Read the market commentary inside the chart what i shared here carefully and try to learn Elliott waves ...otherwise its tough to understand the market commentary and my analysis. I wont give a entry, stop loss and take profit in my chart...it is only for EDUCATIONAL PURPOSE and i am sharing how i am analyzing the pair and labeling them according to the Elliott wave theory...I AM JUST SHOWING THE TREND HOW IT MAY GO AND MY VIEW(it may wrong too)..so DON'T FOLLOW BLINDLY MY CHART..take this as a reference and if it correlate to you strategy took the trade as per your strategy...DON'T ASK ABOUT YOUR RUNNING TRADES i wont comment on them and I WONT SUGGEST TO TAKE MY TRADE SETUP.
My style of trading is different from others and I WONT PLACE A STOP...but ALL MY TRADES ARE UNDER MONEY MANAGEMENT ACCORDING TO MY ACCOUNT SIZE...i wont close the trades even in the BIG NEWS EVENTS OR SCHEDULED NEWS TOO...i am technical analyst based on trendline, channel, fib retracements, expansion, stochastic for divergence, EMA's and MA's are finding the pull backs and MAJOR IS ELLIOTT WAVES ...those mentioned above are using as a TOOLS only. I am not a fundamental, sentimental trader...but only the fundamental will boost my technical analysis to reach my target or sometimes it will go against me and then i will manage the trade according to the Elliott waves alternate views...
Each and every trade plan i am sharing here has a alternate view and i am sharing only the most probabilities(70-80%) here...sometimes the other (20-30%) may market do..then i will change the wave counts and labeling according to the price action. All labeling and wave counts done by me by manually and i will keep change according to the LIVE MARKET PRICE ACTION. So dont bias, hope on my trade plans...try to learn and make your own strategy...Following is not that much easy...I AM NOT RESPONSIBLE FOR ANY LOSSES IF U TOOK THE TRADE ACCORDING TO MY TRADE PLANS....THANKS LOT..CHEERS

Hindalco LongHindalco is near the support zone. It has trend line support as well as 50 EMA support.
Stochastic RSI is also showing over sold levels.
By looking at the price action it seems like a minor pull back from recent high and the uptrend is still intact. Fibonacci is also showing 23.6% retracement from recent highs.
I am bullish on metals and Bullish on Hindalco as well.
But if it breaks the 171 levels then the bears may kick in and down fall may come.
Watch out for 171 levels. As long as 171 is protected on the closing basis I am bullish on Hindalco.

NIFTY clearly in buy zoneeven bearish engulfing could not bring down nifty.
stochastic just emerging from over sold condition
buy nifty for the target as shown as resistances in the chart.
it seems its simple correction is over.
don't forget to like my post.
follow me to get updates.
but if there is gap up we should n't follow the gap up blindly.
Kotak Mahindra Crossing 200 DMAFriends,
Kotak mahindra has given breakout above 200 DMA(1446) CMP 1467 one can go long for 1-2weeks and can continue to hold till RSI/stochastic singnal give reversals.
Thanks

Long Opportunity - CANARA BANK LTD.Buy CANARA BANK LTD. at 101.30 with Stoploss of 98 & Target of 118 - 120 ; Long consolidated over a period of 2 months ; Stochastic at 25.00 MACD indicating reversal & potential bullish setup

Bears Rising EURINR pair has entered bearish territory, one should go short with strict stop loss as mentioned in the charts.
macd crossover has happened and Stochastic showing loss of momentum, once 20 day EMA broken then huge gains possible
Disclaimer: I will not be responsible for the profits or the loss made by trader using my analysis.

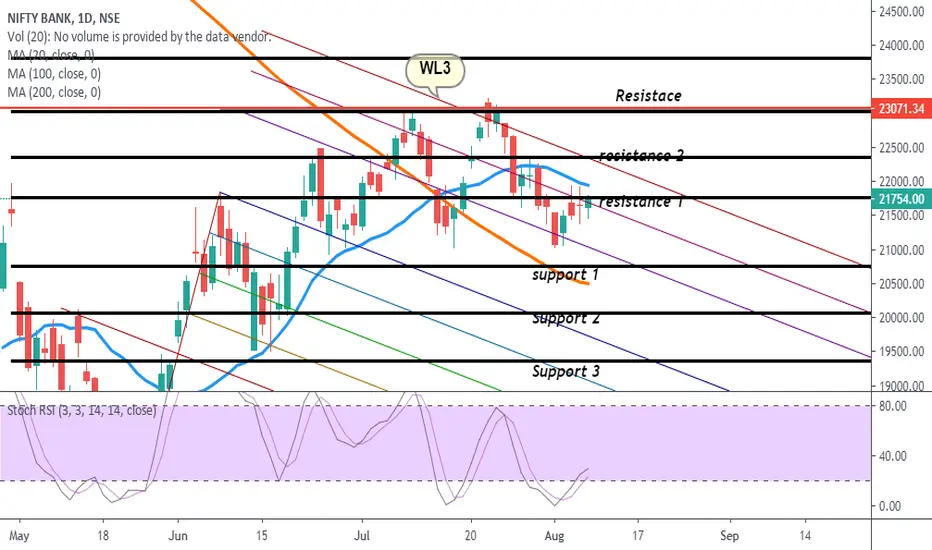
BANK NIFTY major move expected,inside bar and NR7.has been trading in congestion area.
stochastic is in over sold condition and cross over seen there.
has been struggling near the resistance line and trading below 20 dma.
where as nifty has recovered its 20 dma bank nifty has yet to do that,
its break out expected .support and resistances have been drawn on the chart
after studying it carefully
I expect up move of bank nifty from here
main major task for it to recover 20 dma.
once it closes above 20 dma its upward journey may be ensured.
don't forget to like my post and follow me to get such updates
GBPNZD ANALYSIS FOR THE NEXT TWO DAYS OPEN THE IMAGE AND USE THE SCALE ON YOUR RIGHT SIDE AND BELOW TO IMPROVE THE VIEW!
I am very optimistic that the projection described in the image will materialize.
In a macro view we are in a low channel (blue), but inside that channel we are making an upward curve in a high channel (orange) that is going to get the top of the channel.
For a short period of time (considering we are on the weekly chart), I believe that in two days it will reach or be close to the targets stipulated in the chart.
Stochastic and RSI are also indicating purchase.
It is a very simple analysis. And sometimes what we need to see is just the simplest to have good results, without great theories.
Good trades!
Disclaimer of liability.
1. This analysis is not sure that the price will move as projected, any macroeconomic news, tweet from some political authority or even a misinterpretation of the graph made by the author can happen and cause loss. When in doubt, do not enter!
2. This is not a financial advice or entry signal, just my opinion as I see the market. Use this study to find out if it is in line with your study. Always make decisions based on your analysis!
3. Open small batches and few operations, you are unlikely to get rich. Be long-lasting in the market. Greed will only make you lose money. What will make you rich is your daily job well done combined with honesty and love.
4. Don't lose your mental health, prefer to close the operation and lose a little, you don't win every time (and when we think we can always win we usually lose everything), for this reason, ALWAYS use a Stop Loss according to your risk management.
5. Remember: you are solely responsible for your wins and losses, so be sure to handle an amount of money that you are willing to lose (due to the risks involved in the business) and never invest any amount that can cause you problems and damage your livelihood.

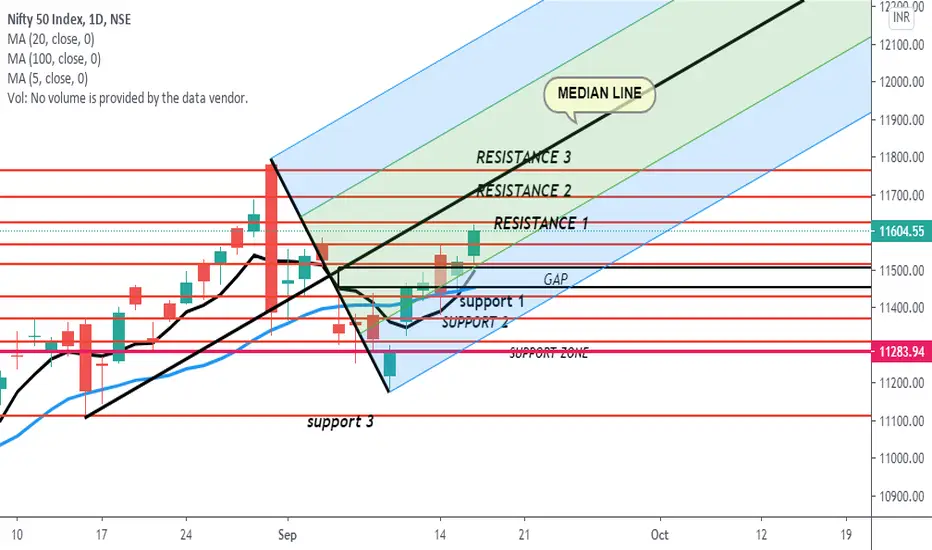
NIFTY faces resistance at the resistance linehow ever hidden divergence can be seen between price and stochastic oscillator.
which is positive for its upward movement,
with reliance not supporting the market
nifty could not take out the resistance.
one more move up of reliance expected.
infy,tcs may resume upward movement after consolidation.
any positive in the Rbi policy may provide the required required fuel for the market to go up.
whenever there is a gap up we should not jump in for taking position.
and profit booking at higher levels should be done on intraday basis.
for positional traders up move still in tact.
don't forget to like my post .
follow me to get updates

WHIPSAW OR STARTING OF A DOWNTREND ?? In an one hour chart, ichimoku, rsi, stochastic says sell. ADX is very weak. The price is near lower level of bollinger band which says buy. 21660 was a strong support which was broken. If this was just a whipsaw going for 2 or 3 days, 23000 level will come soon.


HPCL at Fibonacci supporthpcl is at Fibonacci support, stochastic cross over happened and RSI waiting to cross 50. if it happen good for short term

SBIN : Upar jaane ka raasta 2.0Levels on chart.
Long above 189.8 for 196 with SL at 186.5
Observe Stochastic levels with previous rebounds for confidence
Keep a track on Bank Nifty levels - refer linked idea (1.0) for correlations

Infratel trading at support levelThe stock is trading at a support level and the stochastic oscillator suggests an upward move. One could buy at current levels and look for a target above 220.

Market OutlookMarket Outlook for Wednesday, 08/07/2020
On Tuesday after a gap up opening of 39 points at 10802, Nifty made a high of 10813 and due to selling pressure came down to 10689 and at end closed 36 points up at 10799 forming hanging man pattern at the top which has a bearish implication.
Oscillators – currently stochastic is quoting in a highly overbought zone at 93 while RSI at 71 signaling possible correction in the market.
Now on Wednesday if Nifty doesn’t cross its Tuesday’s high of 10813 and start coming down than expected to take support at 10738 to 10689 levels. If it breaks and sustains below 10689 than may enter into short-term correction and may come down to 10553 and below that 10473 levels where we may see buying in the market.
On the other side, if it crosses and sustains above its Wednesday’s high of 10813 then 10839 will act as the next major resistance where selling is expected, above 10839 it may continue its up move till 10924 levels.
#NIFTY50

BEL MonthlyPositive Divergence on Monthly charts, Stochastic Oscillator
Only for educational study, do not base this for any trade.

ITCAfter 2 march 2020, ITC never cross and settle above 205 ITC face a resisrance 205...fresh buying if ITC settle above 205 as a closing basis with a target of 212-213 with a stoploss of 183-184 near 200 DMA(medium term view).,,,,,,IF its cross and settle below 200DMA...then its a bearish signal...
If Nifty don't break 10200. and market will recover from 10200.Then incase ITC will lead the Nifty.,,,, Buy near 190
Short term chart show buying... 1,2,3,4 hr chart show buying.,,,,,,
Short term buy itc with a stoploss of 189 and target 200-202.......
RSI - 56
MACD- 2.23
CCI- 60.39
STOCHASTIC- 50.52
If you have any queries plz contact on Facebook page MK Advisory

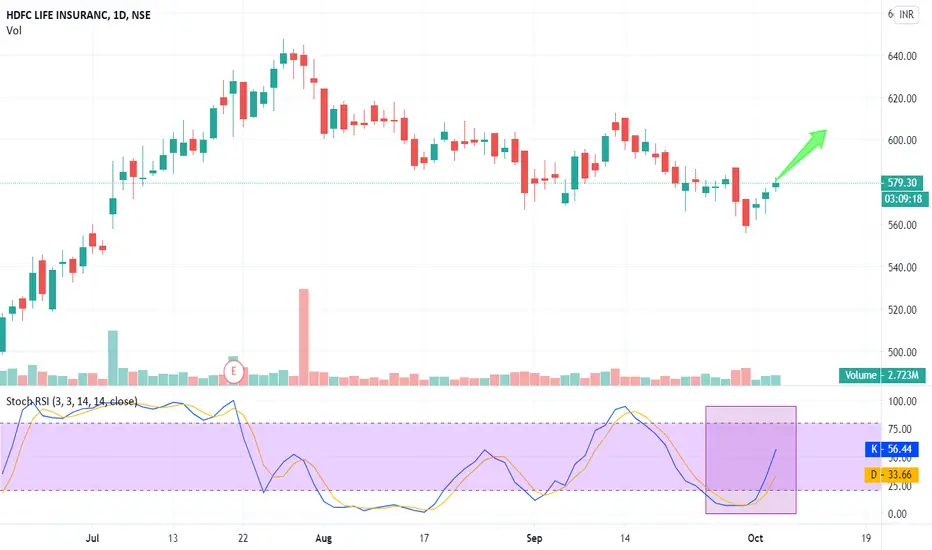
CUB: Will History Repeat Itself?CUB is in a similar territory.
S& R & Stochastic RSI is indicating a breakout to 140 is on the cards soon.
Buy after a clear break above 130 for targets of 140. SL - 122
Can keep buying below 130 awaiting the breakout. - Thats what I am doing.

Maruti Suzuki StrategyBasis price action between 18 May to 01 June Long position Exit is forecasted around 6190 supported by the fact of MACD, RSI Stochastic and the buy setup candle is still at 6. Accordingly time of exit should be reached around 23 June to 24 June.
Following strategy upon retracement post 24/25 June:
Short position Entry at 5877 with SL 5895
1st Cover at 5585
2nd cover at 5419 (Depending Price action)
Disclaimer: The author is not registered as a securities broker-dealer or an investment adviser either with SEBI or any other government agency. All views expressed is based on the author's technical analysis. It is highlighted that Investment/Trading in securities Market is subject to market risk, past performance is not a guarantee of future performance. The risk of loss in trading and investment in Securities markets including Equites, Derivatives, commodity and Currency can be substantial. It must be noted that the user of the information shall undertake their own analysis before investing or trading. The author of this information shall not be liable for any losses arising from the advice therefrom or incidental thereto.

MCX Gold Price Trend June 2020As per vol spike and stochastic RSI sign, gold will perform downside. It could hit 44000 – 43860 levels.
Keep your eyes peeled at 45300 levels. Above it, 46500 – 47300+ levels are waiting. Intraday traders can use it as a hurdle.
Don’t forget to note down fakeout.
