VEDANTA: BEARISH A steep fall which can be counted as 12345 impulse , suggests that vedanta stock is taking a correction in the form of a ZIGZAG pattern. The current rise looks like a corrective sequence of short term bearish trend which will complete this zigzag correction. One should look for short opportunity near 310 zone. keeping sl of 328 & target for the region of 260 /240 .
Search in ideas for "zigzag"

WXY DOUBLE CORRECTION WAVE Y BEGINNINGBOUNCE FROM 14350 TO 14878 IS FORMED IN 3 WAVES MEANING PRICE WENT UP IN CORRECTIVE PATTERN.aLSO IT STOPPED @50% RETRACEMENT OF WAVE W(15430-14350) AND GENERALLY CONNECTING WAVE X STOP'S @ SAME LEVELS MEANING WAVEX HAS ENDED AND AS OF NOW WE ARE IN WAVE Y.THIS WAVE Y CAN EITHER BE ANT FLAT OR ZIGZAG CORRECTION,HERE I HAVE CONSIDERED IT TO BE A ZIGZAG,SUB-WAVES OF WHICH IS SHOWN IN CHART.BOUNCE TILL 14730 SHOULD BE USED TO LIQUIDATE LONGS AND BUILD SHORT WITH A STOP OF 14900 FOR AN INITIAL TARGET OF 14200 AND EVENTUAL TARGET OF 13800.

TESLA is a buy again!!!Tesla completed an ABC zigzag. Wave C hit the 100% extension of A perfectly which is our most likely target. Maybe the last time we're seeing prices like this.

YES Bank EW analysisOm Namah Shivay
The Initial pattern suggested
should be corrective pattern
which is fully retraced back
with a Zigzag. The movement
is supported with divergence.
This is for educational purpose only. There are no trading recommendations.
Om Namah Shivay = Soul (the I) respects Shiva ( the supreme Soul)

Colgate palmolive (Colpal)As B wave fail to retrace wave A more than 61.8 %..we can say it is Zigzag. purpul color.
Contracting triangle formed in wave B...BD line of contracting triangle was broken voilently....
upward move is started ..
minimum target is 1691...then 1878 in coming few weeks

Nifty with Elliot WaveOm Namah Shivay
Brothers, A learning series. We tried to make an early leading diagonal to Nifty downtrend.
The levels may be correct, but the leading diagonal should be transposing to something different as per the expert of Elliott Waves.
Tried to count again and had idea of it becoming Triangle. hmm. It does not seem to be.
If we can have 5-3-5-3-5 down, then it is a inverted Zigzag.
And if our pattern is correct, then we are waiting to see a 5 wave pattern down to our next target.
A good learning with the trend on tradingview platform.
Om Namah Shivay

Nifty50 End of day View- 7th September 2020.
Correction Type Zigzag.
Nifty should move up from here by breaking the line and then can touch the 11585 in few hours of trading window.
The view is only for education purpose.

BANK NIFTY COMPLETE ANALYSIS AS PER WAVE THEORY
As per 12 Months chart we have a 5 wave Upward Impulse complete, and now the correction is forming We have Wave A complete and Wave B is forming
In the above picture I have elaborated Wave B which is an upward Zigzag structure; according to which the Wave A and Wave B of the Zigzag are complete and Wave C is forming which is an Upward 5 Wave Impulse of which we have Waves 1, 2, 3 complete and Wave 4 is onn;

EURUSD COMPLETE ANALYSIS AS PER WAVE THEORY
This is a 12 Months chart, here we clearly see that the 5 Wave upward Impulse is complete then the downward Correction is complete.
This signifies that now the most awaited WAVE 3 is about to begin; we will further go into the Lower Degree to understand the movement at the lower levels.
This is a 6 months chart here we see there is WAVE 1 and 2 formed we will verify them in the further lower timeframes.
The Waves in the 6 months chart are verified as per the Weekly chart. We see a 5 Wave Upward impulse complete and then we have a complex correction formed which has a Zigzag (Blue) A Triangle (Orange) as an X Wave and A Triangle (Blue) which completes the Double Three Correction structure. Now starts the Impulse again as this Impulse starts after the Triangle hence this is supposed to be the one with maximum Volume.
This is a Weekly chart e see an Upward impulse complete, therefore we will have a Correction here now, lets verify the same in the Lower Degree;
We are verifying The Weekly chart Waves as per the 4H chart, We have verified every Wave one by one, We have a Wave 2 showing a Simple Correction therefore as per The Principle of Alternation we have a Complex Correction in Wave 4 which is a Double Three; please check the picture for detailed understanding.
Lets summarize to be sure where we are exactly heading.
We are in the Impulse Move trying to find an opportunity, we see Wave 1 (Leading Diagonal) Wave 2 Simple Correction Wave 3 Extended Wave Wave 4 Complex Correction ( Double Three ).
Here we have verified that the Upward Impulse Move of 5 Waves is complete and now the Temporary Correction will start which is the WAVE 2 in the Higher Degree that is Weekly and Monthly charts;
This is a Wave A (Flat), Wave B (ABC); So we see that the Wave B has closed above the start point of Wave A; therefore we know that this structure is a Flat; Therefore Wave C expected to be a 5 Wave downward Impulse;
This is the Wave 1 of the downward Impulse; after this we will have a Wave 2 which will be either a Simple or a Complex Correction structure.
This is the Wave 2 forming which is a Flat where Wave A is a upward ABC Correction structure Wave B is a downward Zigzag and it retraces Wave A more 78%; check the picture below to have a clear understanding;
So Wave B is a Flat in which Wave A and B are complete and Wave C which is going to be an Upward Impulse will form.
Once this 5 Wave Impulse is complete then we will have Wave 1 (Downward) and Wave 2 (Upward) complete, and Wave 3 is our Wave to encash.
So here we are expecting after the Correction Wave 2 is complete then the Wave 3 of the downward Impulse will start. As per the Fibonacci Extension Tool we can find the distance the Wave 3 can cover; generally any Impulse irrespective of Upward or Downward reaches the extension percentage of 161.80% of Wave 1 hence we are expecting the same in this case as well.
==============================================================================================================================
This is my first Analysis I am posting; please consider me as a learner and suggestion and comments are more than Welcome
Thank you for your attention!

Nifty Elliott wave analysis for 24 Aug 2020 onwardFrom 7511 its looks like double zigzag correction . But to find out top(End of (c)) we need to look at the recent bounce started from 11111.
I could not see any other pattern other than double zigzag correction. But it doesnt mean I am shorting blindly. do your own analysis and make trading strategy accordingly.

HDFCBANK Leading Diagonal 5th Wave EndHDFCBANK retraced more than 61.8% from top. Leading Diagonal wave is 5 wave pattern which is formed in wave 1 of impulse or wave A of Zigzag.
HDFCBANK to start fall post close below 1093 on hourly chart. SL can be 1120-30.
Potential wave targets are in coming days
Wave A 1046/1020
Wave B 1075/1065
Wave C 1002/960

Trending (Buy/Sell) for Tomorrow 09-07-2020Observe:
SRTRANSFIN
MCDOWELLN
INDUSINDBK
SUNTV
JSWSTEEL
SBIN
HINDALCO
COALINDIA
VEDL
CANBK
GAIL
NMDC
BANKBARODA
SAIL
DRREDDY
Caution: Choose by self analysis and confirmation. Nifty 50 will be mostly zigzag. If Nifty 50 is sideways be careful while entering and keep small targets to exit.
Above list are possible trending stocks. It can be up or down trending. Identify NIFTY 50 trend and do side by side analysis with Nifty 50 or other respective indices.

Nifty Elliott wave analysis for 3rd July 2019 onwardsTriple zigzag pattern is violated as of now and if nifty completed correction at 11625 as double zigzag then nifty needs to go for new high very fast. Any consolidation below 12000 would indicate its still in X2 of complex correction. Will update if found an exact pattern.

Nifty support is 11625,on breaking above 11911 will see new highThis correction was expected to come down in a range between 11700 to 11485 as per the Fibonacci retrace
levels and so far retraced to11625 then bouncing now with out completing a pattern. if c is completed at 11625,
the bounce could be wave 5 with possible extensions in internal wave 3 as mentioned earlier.
Another possibility is that wave3 completion is at 12103, then the current down moves are forming a Double zigzag
or even can form a triple zigzag,which may take nifty below 11625 having a lesser chance.

ASHOKLEY is Possibly Bullish For 3-4 Days From Now. . .ASHOKLEY is Bullish For 3-4 Days From Now. . . Its in some sort of WXY Double zigzag. . .

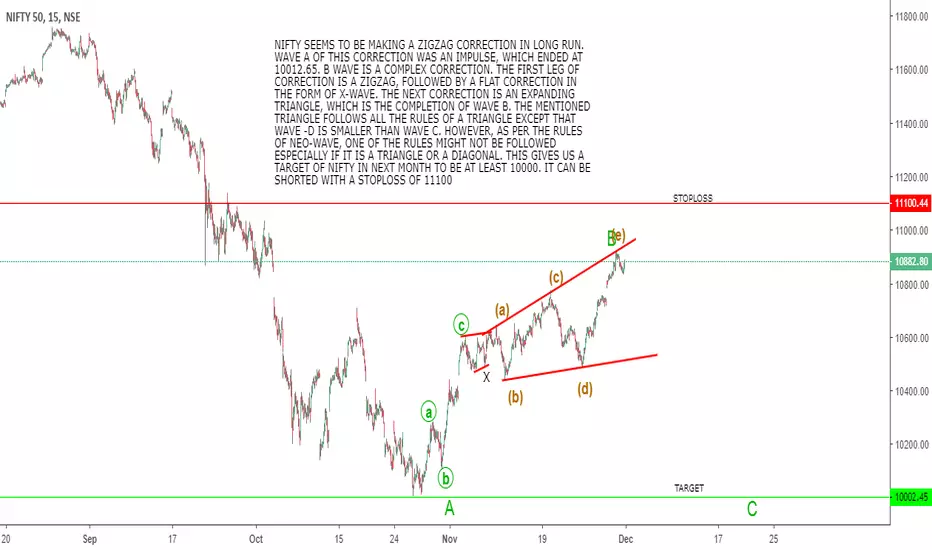
NIFTY - VIEW FOR DECEMBER 2018NIFTY SEEMS TO BE MAKING A ZIGZAG CORRECTION IN LONG RUN. WAVE A OF THIS CORRECTION WAS AN IMPULSE, WHICH ENDED AT 10012.65. B WAVE IS A COMPLEX CORRECTION. THE FIRST LEG OF CORRECTION IS A ZIGZAG, FOLLOWED BY A FLAT CORRECTION IN THE FORM OF X-WAVE. THE NEXT CORRECTION IS AN EXPANDING TRIANGLE, WHICH IS THE COMPLETION OF WAVE B. THE MENTIONED TRIANGLE FOLLOWS ALL THE RULES OF A TRIANGLE EXCEPT THAT WAVE -D IS SMALLER THAN WAVE C. HOWEVER, AS PER THE RULES OF NEO-WAVE, ONE OF THE RULES MIGHT NOT BE FOLLOWED ESPECIALLY IF IT IS A TRIANGLE OR A DIAGONAL. THIS GIVES US A TARGET OF NIFTY IN NEXT MONTH TO BE AT LEAST 10000. IT CAN BE SHORTED WITH A STOPLOSS OF 11100
Nifty is having strong support at 13 EMANifty' is having strong support near 10600 area.
Also expect the RSI to support near 50 level.
Wave structure is is bit confusing but still hopes that we are in wave 3,
and the IV of 3 is show as an expanding flat here.
if true we will see the 1.618% retracement show here11924 approx:
And if wave 3 is completed at 11171, then we are in an a b c correction starting from 11171.
A is completed at 9952 ( I was expecting 9920) & we are in wave b of wave 4, could be formed as a flat, since wave 4 rarely form zigzag. Means this b also will be equivalent or above 11171, depending on waht pattern it form.

Sun Pharma Neo WaveComplex Correction Taking Place .
First Zigzag.
Next X Wave.
Then Diametric....(Looks Like it finished at g's Low)
Low of e might provide some resistance....
A bounce happened from Last weeks low,so, it might be impulse or just can turn out into symmetrical pattern connecting h & i to ongoing diametric correction.......
Be careful with shorts....( as i feel in worst case it might make one more low if its symmetrical)
Apply buy in Dips Strategy...
Cmp 480

Complex PatternDouble Zigzag & Diametric ,Now Ongoing Double Zigzag & May Move towards 1550,Cmp around 1370,Apply buy in dips strategy Support @ 1230,Followed By 1125.
Analysis based on Neowave.
Labeling Unorthodox Way.

Infosys: Q4 EarningsDear Fellow Readers,
The management of Infosys Ltd (INFY) is about to declare its Q4 earnings on 13th April, 2017. The stock has been under bearish mode since June 2016 after hitting its all time high price of 1279.30 per share. The movement in the stock of Infosys Ltd from the low of 66.10 made in September, 2001 to its all time high of 1279.30 was an impulsive run and the stock may witness correction in simple zigzag (A-B-C) pattern upto the level of 816.00, being the 38.20% retracement level of the total rise from 66.10 to 1279.30 level.
The fall from its all time high price of 1279.30 to its low price of 901 per share, looks to be an impulsive run, whereby the stock has completed its first leg, i.e., 'A', of its simple zigzag corrective pattern. Besides, its seems that the stock of Infosys Ltd has completed its second leg, i.e., 'B', in a-b-c (901-1022, a -901.15, b - 1044, c) pattern, and looks to have started its last leg 'C' which might another impulsive run.
The stock has witnessed decline of 93.90 points from its recent top of 1044 to 950.10. Within this fall the stock looks to have completed three waves and under the process of completing its fourth waves, I suppose.
The corrective pattern that stock may witness can be an extended flat or complex, whereby the first leg of this probable correction seems to have completed at 976.90 in three wave structure and the second leg may get completed around 939.85, being a 138.20% retracement level of first leg.
If the stock takes support at or around 939.85, breaching its previous low of 950.10, and then it may see a temporary short term up move to the level of 1021.10, being 165.00% extension level of first leg and also being 78.60% retracement level of total fall of 91.40 from 1041.50 to 950.10.
One should note that if the stock takes support at above expected level, there may appear a bullish/positive divergence on the stock, which may give a boost to temporary up move in the stock.


Pivot Point & Trendline Nifty Facing Resistance Near Upper Falling Channel Line .....It Can Either Retrace Lower trendline & Move Above 8600 Or Can bounce from fib retracement levels. Rally From 8600 is not an completed impulse as of now,But it can either move up as Impulse of zigzag family pattern,If Zigzag then it may retrace till 8950 Or If impulse then can go well above 9000 ,You can get a clue from Bank Nifty as it is quite strong.
Pivot is 8680 End of Running triangle (Top of Wave e) and immediate resistance at 8600.
But FII participation is low as of now to consider this as impulse......Lets See.

TrendLines & PivotRally From 8000 Till 8600 Can be Form Of Impulse (Pending) Or ABC Zigzag ,If we take out 8600 ,Now It Can Bounce back from any of fib retracement levels (of 8000 to 8600) to take out 8600 Or Can Even touch falling lower trendline & bounce back.Then Probably Next Could be Till 8900 Again As Zigzag Family Pattern Or May We il move Above All Time Highs As Impulse ......If Bank Nifty Takes Out All Time Highs ,Then Slowly We May Follow It too.
Currently its facing resistance at upper falling trendline ,Above 8600 Next Rally till 8680 which i consider a pivot. The end of Wave e of running triangle (If My identification is right).
