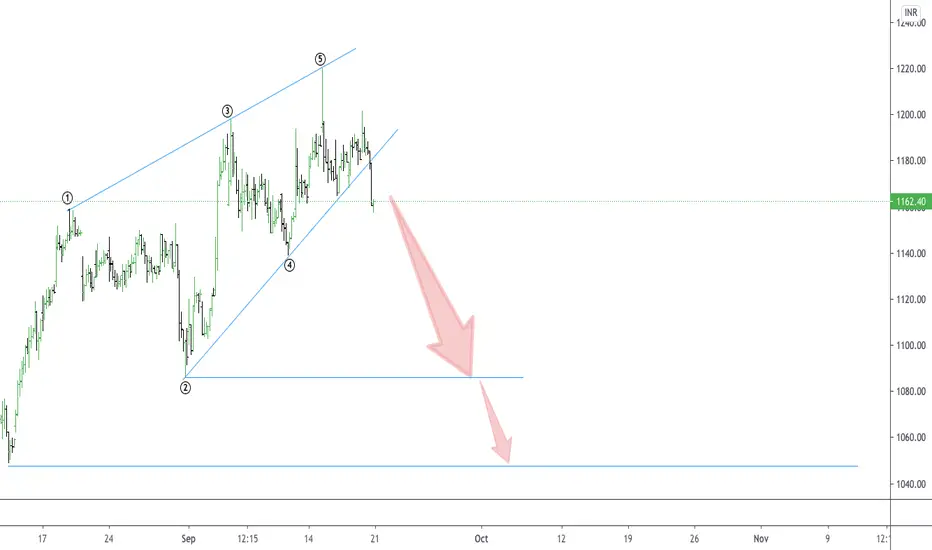
TITAN : CASE OF ENDING DIAGONALThis is the most common diagonal that can be found out at the ending of a main trend or main correction. It consists of all the waves 1-2-3-4-5 in a single or multiple zigzags. They can be found placed at 5th wave of an impulse wave or can been seen as a wave ‘C’ of a corrective waves zigzags or flat. After the termination of the ending diagonal, a swift & a sharp reversal takes place which bring the prices back to the level from where the diagonal began.
Here in the stock of TITAN, this ending diagonal is placed as a wave-C of a corrective move.
As you can see in the chart, this pattern looks like an ending diagonal having wave-1 wave-2 wave-3 wave-4 & wave-5 . Each of these five waves are having an internal structure of three waves. So as per the wave analysis we can say the stock price of TITAN are going to fall . It has been seen that the target level of ending diagonal wave is the origin of the diagonal or the wave 2. So one should see a selling opportunity in this stock & look for the target zone as mentioned in the chart.
Search in ideas for "zigzag"
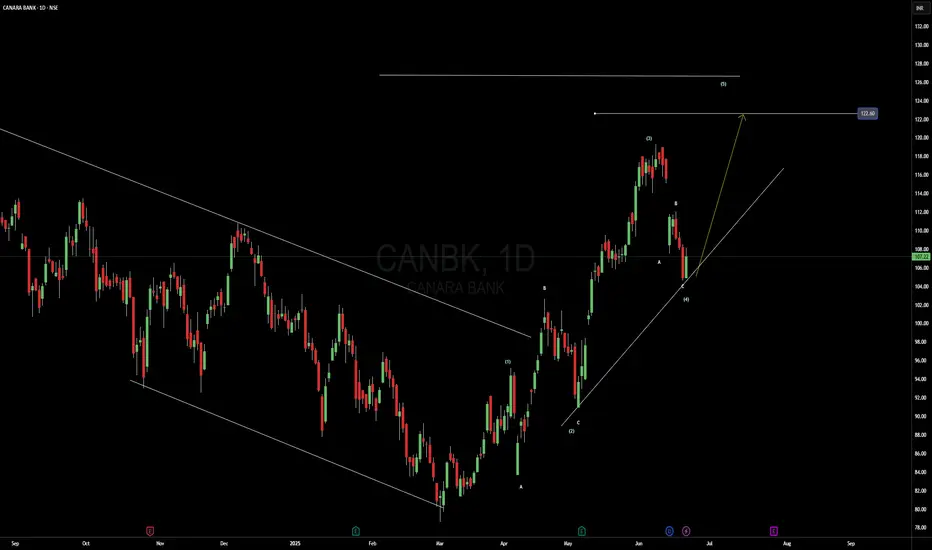
Start of 5th wave - A text book impulse move - Tgt 122Details marked in chart
- With an irregular flat as Wave 2, a zigzag for wave 4 is normal - as per the rule of alternation.
Here we have a short C wave for the zigzag .A short C wave in a zigzag indicates a probable retrieval of the entire zigzag.
A reversal candle happened yesterday. Next candle on Monday should confirm the reversal. If the reversal is confirmed expecting a minimum target of 122 - 126
Normally i love multi baggers for long term investments. This looks good for short term.
Another possibility is that it could give a 5th wave extension. Will keep a watch.
Disclaimer : I dont own this stock in my portfolio
MGL Chart Analysis MGL Chart Analysis:
- Monthly Chart reveals like Stock has been stuck within a Contracting Triangle of ABCDE Structure since listing
- Weekly Chart Seems like unfolding ABC Zigzag (green ABC) 5-3-5
- Wave B can complete around 1186 to 1250
- Major Wave B(green) seems like in a triple Zigzag and wave Z can end around 1186 to 1252 - These double/triple Zigzags often can look like an impulse
- Major Wave C can be an impulse on the downside and will review the stocks around 1230 to 1250
Current trading strategy can be on the long side from Spot around 1095 with SL of 1040 for targets of 1186/1211/1252 and Trade type depends on strategy one wants to deploy as per risk management(Cash/FNO hedges etc).
Reviews/Feedback/Corrections are welcome.

ending diagonal patternThe ending diagonal is the end of an impulse or zigzag. This pattern consists of zigzags or more complex correction formations

CRUDE OIL: Bearish for short termLEADING DIAGONAL: In a leading diagonal , waves 1,3, and 5 are all impulsive in nature or all in corrective form of zigzags. Wave 2 and wave 4 are always present in a zigzag form. A leading diagonal suggests the starting of a new wave & that is why it can develop wave 1 of a impulse wave and a first wave of a zigzag pattern.
Either a larger correction of higher degree or a smaller correction as a ZIG-ZAG corrective wave , whatever the condition crude is going to fall if rejected from the current levels.
TRADING STRATEGY:
AGGRESSIVE PLAYERS: One should go short in the region of 93.5 $ to 94 $ keeping SL of 96$ and look for the target of 88$ and 85-84$ zone .
SAFE PLAYERS: wait for the closing below 92$ & then go short for the target of 88$ and 85-84$ zone .

CRUDE OIL : A possible leading diagonalLEADING DIAGONAL: In a leading diagonal , waves 1,3, and 5 are all impulsive in nature or all in corrective form of zigzags. Wave 2 and wave 4 are always present in a zigzag form. A leading diagonal suggests the starting of a new wave & that is why it can develop wave 1 of a impulse wave and a first wave of a zigzag pattern.
TRADING STRATEGY:
Buy Crude oil : 89-89.5$ keepin SL of 87.8$ look for the target of 93.3-94.3$

SHIBUSDT | The best scenario for falling 📝Hello traders, SHIBUSDT in daily timeframe , Based on the wave count we had:
Waves 1 and 2 are completed.
We are now at the beginning of wave 3, consisting of wave 3, microwave 1, and the structure of wave 2 is being formed.
Wave 2 is usually zigzag and has a steep slope.
The current trend is also zigzagged, and from this pattern wave a is completed and wave b is probably completed.
From this zigzag , only wave c is incomplete and we assume that wave c forms its first wave and completes the rest of the waves up to around 0.002145.
If the red circle and the upper side of the channel are broken, the structure will change and there is no hope for this decline at the moment.
🙏If you have an idea that helps me provide a better analysis, I will be happy to write in the comments🙏
❤️Please, support this idea with a like and comment!❤️

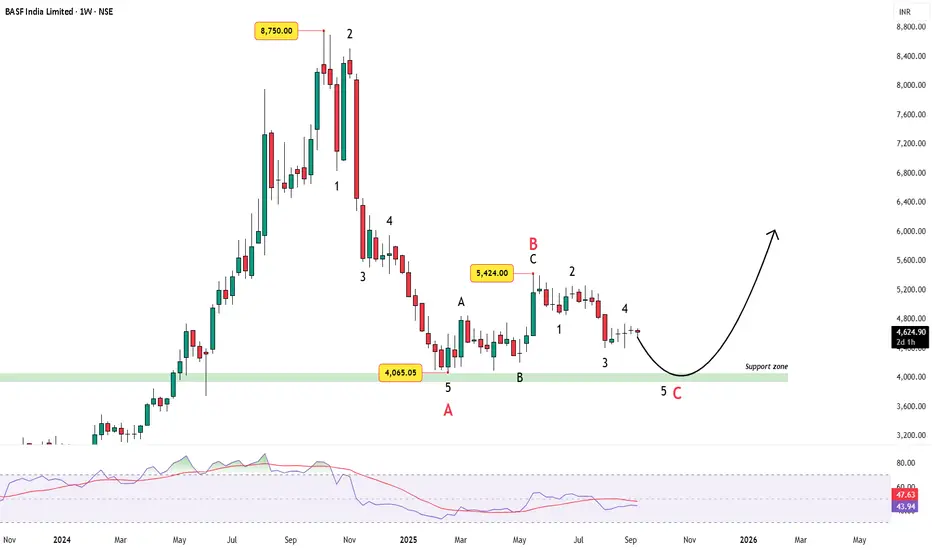
BASF India – 53% Correction Nearing Wave 5 SupportBASF India, a leading chemicals producer, has witnessed a sharp correction from its euphoric highs of ₹8,750. In just a few months, the stock retraced nearly 53%, wiping out more than half its gains.
Wave count
From the ATH, price unfolded into a 5-wave impulse decline, bottoming near ₹4,065. This completed the Wave A of the zigzag.
The subsequent recovery to ₹5,424 shaped up as a clear A-B-C corrective rally.
Since then, the stock has been carving out another 5-wave decline, now progressing towards its final leg (Wave 5 and eventually Wave C of the zigzag).
The support zone around ₹4,000 remains crucial — a likely area for Wave 5 to bottom.
Momentum Check
RSI sits near 43, showing weakness.
No strong bullish divergence yet, which hints at the possibility of one last dip before a reversal attempt.
Outlook
If Wave 5 completes around the ₹4,000 zone, this could complete the ABC zigzag and BASF India could set the stage for a larger rebound sequence into 2026. If price breaks below 4000 convincingly and continues the downtrend, then we are in for a further deep correction.
⚠️ Disclaimer: This analysis is for educational purposes only and does not constitute investment advice. Please do your own research (DYOR) before making any trading decisions.
Bank nifty in trouble?chart displays wave sequences of bank nifty from oct26 23
five wave upmove completes dec28 23.
there after bank nifty corrected in zigzag formation ABC which was finished on jan25 24.
so whole of elliot wave cycle was completed there with the completion of eight waves.
It retraced 61.8 percent of preceeding motive wave.It could have been wave 2.It retraced just
to the top of wave 1 of preceeding motive wave.But thereafter bank nifty pulled back in three waves
forming wave B bracketted.Now Bracketted c wave is pending.
If bracketted C wave too take the shape of zigzag then bank nifty should be drifted lower
as it has probability to proceed lower where bracketted C becomes equal to bracketted A.
But C wave can take the shape of ending diogonal too.
The way bank nifty is rising 700 points one day and falling 700 points another day
it signals some short of wave forming rather than zigzag.
tomorrow it will be clear.
Extended corrective wave ends in 3+4=7,7+4=11 and so on.
Like this post if it helps you.
follow me to get updates.

Case2: Etheruem pull back wave x and moving upward triple x nonIn this case previous low we assume that wave 2 of the supercycle is already finished
so we are in wave super 3x or wave c - and this motive wave in the timeframe month
might be a triple combination or triple zigzag.
Rule
Because the former wave is elongated zigzag that means wave x must retrace at
At least 61.8% of wave c (847.30)
It can retrace deeper but it must not retrace more than 61.8% of the previous cycle
elongated zigzag (726.07)
Conclusion
It might retrace in the (847.30-727.07) zone to form wave x and keep continue moving upward
Warning
Ethereum is a very fluctuated coin so make research on your own, you may look at my first case which is the downward situation.
I strongly believe that everything is possible to manage your capital carefully.
Vitalik Buterin's fan
Thanat Vichachai

CoalIndia forming a FiveThree and looks like we are in wave C Coal India is forming a Five Threes ABCDE and looks like we are in the C leg. And Wave C is an abc' zigzag, currently in the wave iv the of the internal wave c of the said abc' zigzag. wave iv is almost completing in an expanding flat. If this turned out to be true ( if true :D ) Wave v can bring down the stock to 214. The next Fibonacci level.
Actually in zigzag A= C is expected, but it can be in the range 61.8% to 100%. This is a hypothetical view and there can be many other variations, please bear with me for my studies.


Finolex industriesAdded 25% of total qty with SL 435 on WCB
Next Buy Range = 490-460
Reason to buy:-
1. Trading above 50 RSI
2. Trading above 200 EMA
3. Weekly zig-zag brkout.

HDFC Updated Chart & Trade Setup ! DONT MISS !!TREND ANALYSIS & TRADE SETUP
GARTLEY HARMONIC PATTERN !!
Follow Chart Instruction.
Do not be Hurry for entry.
Wait for Proper Entry Setup.
Buy/Sell with Best Risk Reward.
Educational Chart Only.
August Series Option can be traded.
Wait for entry setup, if available then Long/short.
Reward is 8-10 Times
DO NOT MISS ENTRY IN AUGUST EXPIRY !

View on Reliance IndustriesAfter a good rally in RIL, it getting high price rejection from overbought levels. We can 50 % of its upmove as a retracement.
Target should be somewhere 1300. BSE:RELIANCE [/s ymbol]

This is weekly chart & this tripple combination ( TWO ZIGZNote: This is weekly chart & this tripple combination ( TWO ZIGZAG & One Triangle). ZIGZAGS are complted & Triangle to be complted yet. ( Wave C is running is started & Wave D , E to be pending.)

View on Nifty chart using Elliott waveThis analysis covers the Elliott wave count from Mar'20. I'm not expert in Elliott wave, just learning from my mistakes.
The waves 1,2 and 3 from Mar'20 low are completed and wave 4 is being in progress for sometimes.
In wave 4, double zigzags correction are already completed and third zigzag is in progress.
Disclaimer: Making any trade decision based on this analysis is on your own risk.

NIFTY ANALYSIS AS PER THE WAVE THEORY
This is the 12 Months chart we see 5 Wave Upward Impulse is complete;
We have gone in the Lower degree further into the Monthly chart;
The Lower Degree for the Monthly charts is The Daily chart hence we are verifying the Wave A (Monthly) in The Daily chart;
Here we see Wave A of Monthly chart is a Flat structure ( For reference please find out what is a Flat Structure as per Elliott Wave Theory)
Now Wave B (Monthly)
Generally Wave B, Wave 2 or 4 are complex wave where there are more than one correction structures formed;
This is a Type 2 Zigzag where Wave A or C atleast one of them has to be a Proper Simple Impulse (Where Wave 4 doesn't overlap Wave 1 area)
Here the Wave 4 was a Complex Correction which confused me the last time for a start of a Downtrend; but Leading DIagonals are also formed in Zigzags;
So we have the Wave 5 which is a 5 Wave Impulse Upward which will complete the Correction forming in Wave B;
So this is the Logical reasoning verified and explained Wave by Wave.
So we have two Conclusions here:
1). For Now this is a Long till Wave 5 is complete;
2). With the Completion of the 5th Wave the Wave B of the Monthly chart completes;
So we have a Flat structure formed in the Monthly chart which is 3 Waves for Wave A ( refer to Wave A of Monthly verified in The Daily ).
This 5th Wave confirms the Completion of the Wave B which is again a 3 Wave structure;
According to the rules of the Flat structure when Wave A and B are 3 Waves each and Wave B has retraced Wave A by more than 80%
So now there are two possibilities after the completion of this correction there can be an X Wave downward and one more correction;
There can be a downward 5 Wave Impulse giving us the biggest fall till date;
Will post when I have a confirmation ;
FOR NOW
I appreciate responses; both good and bad;
Happy Trading PPL
:)

#banknifty ending diagonal 5th Wave a possibility.An ending diagonal serves as the top stone of an impulse (wave 5) or a zigzag (wave C), so let's find out more about an ending diagonal pattern.
The main rules for an ending diagonal
This pattern subdivides into five waves.
Wave 2 never ends beyond the starting point of Wave 1.
Wave 3 always breaks the ending point of wave 1.
Wave 4 usually breaks beyond the ending point of wave 1.
Wave 5 in the absolute majority of cases breaks the ending point of wave 3.
Wave 3 can't be the shortest.
Wave 2 can't be a triangle or a triple three structure.
Waves 1, 3, and 5 form like zigzags.
Regards,
SG

Uptrend And DowntrendUptrend: This describes when the price of a stock is moving upward or getting higher. An uptrend is characterized by the chart’s peaks and troughs reaching new highs as the trend progresses.
So, if you look at the chart over time, it may be zigzagging, but it’s generally going up.
Downtrend: As you probably already guessed, a downtrend is the opposite of an uptrend. It’s when a stock price is moving downward or getting lower.
The downtrend is characterized similarly to an uptrend — but in the opposite direction. The peaks and troughs in the chart continue to drop as the trend goes on.
Over time the chart may zigzag, just like the uptrend, but its general direction is down.

Google (GOOGL) | The best area to buy📍Hello traders, Google in daily timeframe , this analysis has been prepared in daily timeframe but has been published for a better view in 2 day timeframe.
According to our count, this share consists of the main waves 1 and 2, and the trend is within the waves of wave 3.
1 and 2 microwaves are composed of this wave and 4 and 5 microwaves are being completed.
That is, we are now inside wave 4 of wave 3 of wave 3.
Wave 4 is probably zigzagged, and from this zigzag the a and b waves are over, and now wave c is forming.
Wave c is probably in the form of a leading triangle, and a drop is needed to complete this triangle, which we think will end around Fibo 0.38 for wave 4.
And then the ascent for wave 5 from wave 3 to the range of 3000 and here wave 3 from wave 3 is completed and a relatively deep correction for wave 4 will begin.
🙏If you have an idea that helps me provide a better analysis, I will be happy to write in the comments🙏
❤️Please, support this idea with a like and comment!❤️

ADAUSDT | The best scenario for climbing🏹Hello traders, Cardano in daily timeframe , this analysis has been prepared in daily timeframe but has been published for a better view in 2 day timeframe.
According to the count we had, waves 1, 2 and 3 have been completed and now the trend is inside wave 4.
Wave 4 is zigzagged, and from this zigzag , waves a and b are completed, and wave c is probably incomplete.
The count we had for wave c in the lower time was not normal at all, but it is shorter than wave a in terms of time, so we think wave c will continue and decline until the price of 1.00, and then start climbing for wave 5.
But if the bottom of the canal is broken upwards, it must be prepared for upward movements.
🙏If you have an idea that helps me provide a better analysis, I will be happy to write in the comments🙏
❤️Please, support this idea with a like and comment!❤️

NIFTY :WE MIGHT BE CLOSE TO COMPLETING THIS MOVE.The move from 15513 might be progressing as a double ZIGZAG.The point of doubt is in wave y of wave B of ZIGZAG-2.In both cases we are close to finishing this move.
