Premium Chart Patterns Premium patterns help traders understand:
Smart money manipulation
Market structure transitions
Liquidity-based entries
Institutional imbalances
Reversal and continuation logic
They are more reliable than basic chart patterns because they reflect:
Actual institutional logic
Market psychology
Liquidity engineering
Price inefficiencies and corrections
Premium chart patterns are essential for traders who want to trade professionally and understand the true mechanics behind price movement.
Selling

Premium Chart Patterns Smart Money Concepts (SMC) and Premium Patterns
Premium patterns align perfectly with SMC concepts like:
Break of structure (BOS)
Change of character (CHOCH)
Fair value gaps (FVGs)
Liquidity zones
Patterns help visually identify these changes.

Premium Chart Patterns Introduction: Chart patterns are visual formations on price charts that help traders understand market behaviour. They show how buyers and sellers are interacting and where the price might move next. These patterns repeat over time, so traders use them to predict breakouts, trend reversals, and continuation of trends.
Chart patterns are mainly divided into Reversal Patterns, Continuation Patterns, and Bilateral Patterns.
1. Reversal Chart Patterns
Reversal patterns indicate that the current trend is about to change direction. If the market is going up, a reversal pattern may signal a fall. If the market is falling, it may warn of an upcoming rise.
2. Continuation Chart Patterns
These patterns show that the ongoing trend will continue after a short pause or consolidation.
3. Bilateral Chart Patterns
These patterns indicate a possible breakout in either direction.

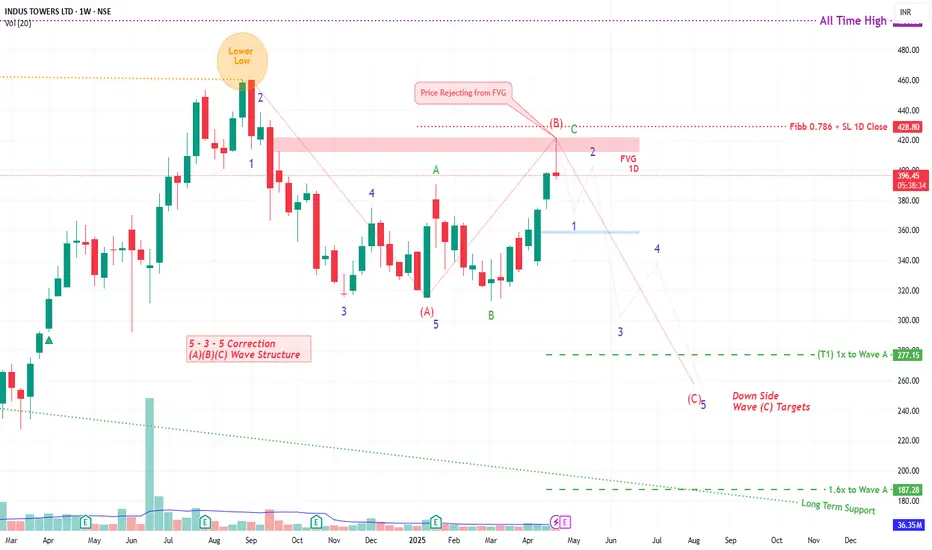
INDUS TOWER By KRS Charts25th April 2025 / 9:40 AM
Why INDUSTOWER??
1. Stock was reached its near ATH level but not able to hold the levels in Sep 2024 . From this point to today it seems like bullishness is getting weaker.
2. Wave Theory is saying Correction Wave ABC is ongoing and C is likely Started .
3. In support of more Correction from here FVG is visible in 1D TF and price are rejected from that level too.
4. Expecting correction from here in 5 Wave Structure towards downside.
Expected Targets and SL are mentioned in Chart
Note: This is Medium to Long Term View
Nifty Bearish Reversal to 21800 and 19900. If May fall if 24500 is broken , Targets are based on fib extension. on weekly 23.6 % retracement and Fib extension meeting at 21800. This is likely to happen in coming few weeks or months.
once 21800 is broken next target would be 19900. This seems too much however this can be used as best time and level to invest for long term. 19900 is 23.8 % retracement from all time high. This is ideal level for long term investment for 4-5 year horizon.

selling prize action momentum selling prize action momentum . today 80% chance selling in the stock . we trade with lower risk for higher profit


sell zone 1.every new High is the intake of the buyers taking profit at the new highs. it is clearerly seen in nifty 15mins chart, the last hour consolidation make the caution in nifty that
selling may persist futher if it is not able to sustain above 18788.
2. we may also seen trend change in the nifty next month if the close this week is negative

BAJAJ FINSERVHi guys, In this chart i Drew My Best Levels in BAJAJFINSERV for Shorting in Positional, Observed these Levels based on price action and Demand & Supply. Don't Take any trades based on this chart/Post...because this chart is for educational purpose only not for Buy or Sell Recommendation.. Thank Q

JSWSTEEL BEARISHjsJSWSTEEL Closing 680.5 with stoploss 710 then targets are 610.
Selling Reason.
1 --> Price Action is Negative and Closing Below 200 EMA.
2 --> RSI is below 40.
3 --> ADX is Showing Bearish Move and -DMI is rise.
4 --> Volume is also show the negative move and ready to cross the average volume line.
5 --> Also Break the Channel Range.

Short Selling Trade For Tommorow Short Selling Trade For Tommorow BAJAJFINSV beacuse of Nifty 50 INdex Was downtrend and global market also down that"s why i am taken this stock if any quiers please ask on the comment box i will reply

HDFC Bank SMC Patterns Short Opportunity --------------------------------------DISCLIMER--------------------------------------------------
* All the information shared in this chart is provided for strictly educational purposes only.
* This chart is sharing information are based on the theory of technical analysis .
* This is not an offer to buy or sell stocks, futures , options, commodity, forex, interests or any other trading security.
* Back test yourself before jump into live market consult your financial adviser and use proper risk management.
------------------------------------------
HDFC Bank Level's
------------------------------------------
4Hr TF Double top with Rejection Candle
Resistance-- 1665/16670
(Target) Support -- 1648/1633/1608/1586
Trade : Sell at 1665 SL 1672 ( 7-8 Points SL)
Target will be : T1- 1648 / T2 - 1633 / T3 - 1608 / T4 - 1586
--------------------------------------------------------------------------------------------------------------------------------------------------------------------------
We are not a financial advisor and you should not construe any information discussed herein to constitute investment advice
This only for study purpose.
--------------------------------------------------------------------------------------------------------------------------------------------------------------------------
Thank you
Trading Cafe 24

FSL... MORE DOWNSIDE RUN COMING... In the chart, one can appreciate the downside of Elliot's correction.
Wave 4 of the Elliot has taken the form of a triangle.
As I mentioned in my previous post about the correction in IT, one can also expect a bearish run in FSL.
Expecting a target of 96 to be reached within this month.

NIFTY'S VIEW FOR 6TH JANThis is nifty on 4hr time frame here i marked a support zone along with a trendline , if nifty will not be able to hold these level (17800-17750)
than we may see a fall toward the level of 17500 so view is Bearish here make your trading plan accordingly
As FII & DII sold today
New support level = 17800-17750
New Resistance level = 17250-18200

XAU USD Expecting Sell Trend XAU USD Expecting Sell Trend - A Rising Wedge Pattern is can be seen in the chart and the RSI divergence is giving the double signal
Expecting Big Sell From 1822 to 1826 level as supply zone and Target at 1750 Level

XAU USD 4 HR Looking For Sell in Uptrend Correction in 4 HR TFXAU USD 4 HR in Strong 4 Hr TF Resistance
XAU USD 4 HR Looking For Sell in Uptrend Correction in 4 HR TF
CHECK The Chart
Looking Like Correction from 4 hr resistance for next uptrend\

Bearish View On BANKNIFTY Hello Guys
BANKNIFY On Bearish View
If BANKNIFY Breaks 41611 Then Do Sell First Target 41580
Second Target 41550 Third Target 41518
If BANKNIFTY Breaks Today's Low @41563 Then It Will Fall Upto 41463
If BANKNIFTY closes Above 41705 Then Go Long
Please Trade With A Strict 🛑 Stop Loss
Hope The Best Happy Trading And Protect Your Capital
DISCLAIMER :-
Iam Not A SEBI Registered Analyst
If You Take Any Position Consultant Your Financial Advisor

Bearish View On SGX NIFTY In SGX Nifty Formed A Triangle Pattern in 5Mins Chart So That Triangle Pattern Indicates SGX Nifty Will Fall
So You Need To Do Short Sell Only
Don't Buy Call Options Sell Call Options And Buy Put Options
SGX Immediate Resistance @17415 If SGX Nifty Breaks @17415 Then It Will Upto @17480.
SGX Nifty Immediate Support @17340 If SGX Nifty Breaks @17340 Then It Will Fall Upto @17290
If SGX Nifty Breaks Major Support @17290 Then It Will Fall Upto @17100
• DISCLAIMER :-
Iam Not A SEBI Registered Analyst
If You Take Any Position Consultant Your Financial Advisor
Iam Not Responsible For Your Loss And Profit
Thank You

Short Sell BANK NIFTY Do short Sell BANK NIFTY Because All Global Markets Are In Bearish So Do Short Sell Only
BUY BANKNIFTY 38500PE @325
STOPLOSS @289
@450
@ 557

Make money by selling MothersonThe price gives the breakdown of the parallel channel and of support1.
Futures Trade
Short: 118.10
Stoploss: 122.65
Target: 111.30
Options Trade
Bear Spread
+1x 29SEP2022 120PE
-1x 29SEP2022 115PE
Max. Profit: +12,375
Max. Loss: -10,125
Max. RR Ratio - 1:1.22
Breakevens : 0-117.5

Nifty Strangle 8th sept 17900 Call and 17400 PutNifty Strangle 8th sept 17900 Call and 17400 Put
at 27 and 24
For combined premium of 51

BANKNIFTY INTRADAY VIEW FOR 23/08/2022Namaskaara dosyonswaagata hain aap sabhibka mera is analysis jo ko aapko kal bhut ki help karaigaa aapko intraday trade lena main aap log is level ko zarur apna chart pain mark kar lena gapup and gapdown ko avoid karna

Bearish View On BANK NIFTY Bank Nifty Needs to Breaks The Triangle Pattern then It Will Goes Upto 39420-39460. At 39460 is Resistance
Banknifty Support Level is 39294 Second Support is 39278 If Bank Nifty Breaks 39378 It Will Fall Upto 39215
So Please Keep Your Positions Little Because Volatility Is Very High So Please Avoid Trades in This Volatility Market. Hope You Understand My Opinion. This is for educational purpose only. If You Are Taking Any Position Consult Your Financial Advisor. Thank You
