XAUUSD (H3) – Liam Weekly Trading PlanStructure has shifted | Early-week focus stays SELL on rallies
Quick summary
Gold has completed a sharp downside expansion after a prolonged bullish run, breaking the prior structure decisively. The current price action shows weak recovery attempts, suggesting the move lower is corrective-to-distributive rather than a completed reversal.
For the start of the week, the bias remains clear: sell the structure, not chase bounces.
Market structure
The previous uptrend has been fully disrupted by an impulsive sell-off.
Price is now trading below former support, which has flipped into resistance.
Current rebounds lack momentum and show characteristics of corrective pullbacks, not accumulation.
This keeps the market in a sell-on-rallies environment until proven otherwise.
Key technical zones
Primary sell FVG / resistance: 4970 – 5000
This zone aligns with imbalance and prior liquidity and is the preferred area for sell reactions.
Secondary sell FVG: 4795 – 4820
A lower reaction zone where price may stall before continuing lower.
Deeper liquidity target: 4340 – 4350
This remains the main downside objective if the structure continues to unwind.
Upper invalidation zone: 5300+
Acceptance above this area would force a reassessment of the bearish bias.
Early-week scenarios
Primary scenario – SELL rallies
As long as price remains capped below the 4970–5000 zone, any rebound should be treated as corrective. The expectation is for further downside continuation toward lower liquidity.
Secondary scenario – Deeper pullback
If price fails to reclaim the first sell zone cleanly, a slow grind lower into the 4795–4820 area may occur before continuation.
Reassessment condition
Only a strong reclaim and acceptance above 5300 would invalidate the current sell structure.
Key notes
Early-week price action often clears residual liquidity.
Avoid counter-trend longs inside resistance.
Let price come to the level, then execute.
Structure > opinion.
Weekly focus:
selling corrective rallies into FVG and resistance, or waiting for price to show a clear structural shift before changing bias.
— Liam
Sellsetup

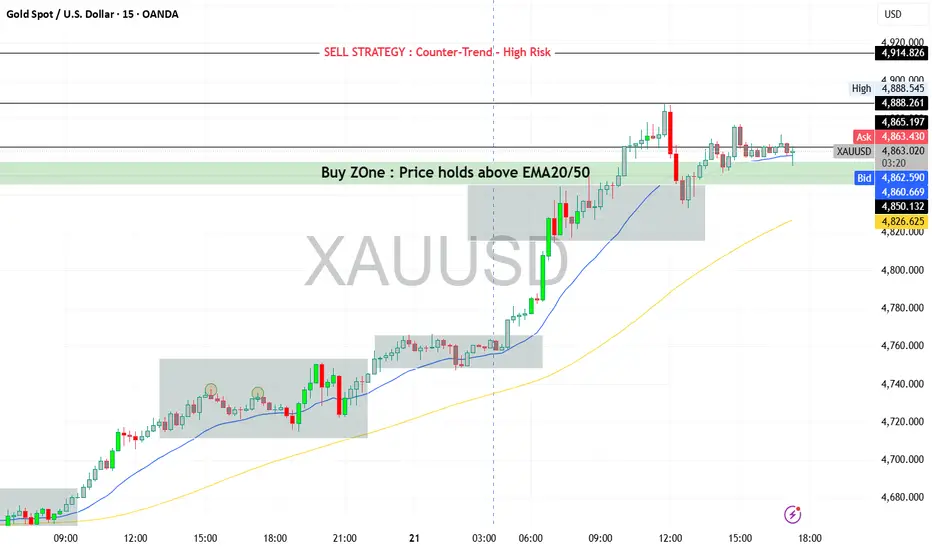
XAUUSD (Gold) | Bullish vs Bearish Scenario | Trading SetupBullish vs Bearish View
Bullish Scenario (Primary Bias – Trend Continuation)
Trend remains strongly bullish as long as price holds above the pivot zone (4858–4845).
Buyers are in control, supported by ADX strength, MACD momentum, and moving average
alignment.
Break and hold above 4888 opens the door for further upside expansion.
Bearish Scenario (Corrective Pullback Only)
Bearish moves are considered corrective, not trend-reversing, unless price falls below 4800.
Overbought conditions may trigger short-term profit booking, but trend remains bullish
above key supports.
Key Levels to Watch
Resistance Levels
4888 – 4895 (Day high / breakout zone)
4914
4939 – 4950 (extension zone)
Support Levels
4858 – Pivot
4845
4829
4803
4773 (strong trend support)
Intraday Trading Strategy (Day Trading Plan)
Strategy Type:
Trend Continuation Buy-on-Dips
Buy Setup
Buy Zone: 4858 – 4845 (pivot support / minor pullback)
Confirmation:
Price holds above EMA20 / EMA50
Bullish rejection candle or continuation pattern on M15–M30
Targets
Target 1: 4888
Target 2: 4914
Target 3 (extension): 4939
Stop Loss
Intraday SL: Below 4825
Aggressive SL: Below 4800 (trend invalidation zone)
Alternative Sell Strategy (Counter-Trend – High Risk)
⚠️Only for experienced traders
Sell Zone: 4914 – 4940
Condition: Clear rejection + bearish divergence on M15/M30
Target: 4880 → 4858
Stop Loss: Above 4955
Preferred Trading Style Today
✔️Buy on dips
❌Avoid chasing price at highs
❌Avoid heavy counter-trend sells
Gold (XAUUSD) Rejects 4470 Resistance – Short-Term Sell SetupGold (XAUUSD) has shown a clear rejection from the 4470 resistance zone, signaling potential short-term exhaustion after the recent rally.
This area has acted as a strong supply zone, increasing the probability of profit booking / corrective pullback before any continuation to the upside.
📉 Trade Idea:
Look for sell opportunities in the 4462 – 4472 zone, aligning with the marked resistance and price rejection.
Targets and risk levels are clearly outlined on the chart.
⚠️ This is a counter-trend / pullback trade, best suited for intraday or short-term traders. Manage risk accordingly.
📌 Disclaimer:
This analysis is for educational purposes only and is not financial advice. Always manage risk and follow your trading plan.
Your feedback drives our content and keeps everyone trading smarter. Let’s make those pips together! 🚀
Happy Trading,
– The InvestPro Team

USDCHF sellCHF futures hit supply zones dollar 💵 is also seems weak so highly posible setup let's see how it goes like 📉📈

ACTUSDT – Sell Setup (Futures | Intermediate)ACTUSDT – Sell Setup (Futures | Intermediate)
ACTUSDT is showing clear signs of weakness after failing to sustain above the recent resistance zone. Price action suggests sellers are regaining control, with lower highs forming and momentum shifting to the downside. A sell-stop entry at 0.02797 is planned to confirm continuation below support. If bearish momentum accelerates, price is expected to move toward 0.02739 as the first target, followed by 0.02677, which aligns with the next demand zone. The stop loss at 0.02884 is placed above the invalidation level to protect against false breakdowns. Overall, the structure favors continuation selling as long as price remains below resistance and broader market sentiment stays neutral to bearish.

XAUUSD Elliott H1:waiting for ABC correction in a strong uptrendXAUUSD – Elliott H1: waiting for ABC correction in a strong uptrend
Brian – Short sell correction, prioritize Buy according to the major trend
1. Market snapshot
On H1, gold has just broken the upward Dow structure and completed 5 small waves – a common signal before an ABC correction.
The larger trend is still a very strong uptrend: gold is on track for its best year since 1979, up more than 60% in 2025, with the YTD performance gap between XAU and BTC continuing to widen.
Therefore: selling is only a short-term strategy, while the priority position for next week remains to buy on deep corrections.
2. Technical structure – Elliott H1
H1: 5 upward waves have completed → the base scenario is for the price to create a wave A down – B retrace – C down before continuing the trend.
The price area above 4,227–4,238 is a zone with selling liquidity + retesting the structure after breaking the H1 peak.
The 4,183–4,173 area (Fibo 0.618 of the most recent increase) is the main demand zone, reasonable to watch for buying in line with the trend with a good R:R.
3. Trading plan for next week
Scenario 1 – Short sell ABC correction (counter-trend)
Idea: take advantage of the A/B correction wave after 5 upward waves on H1.
Sell watch area: 4,227–4,238
SL: 4,246
Reference targets:
TP1: area 4,200–4,195
TP2: towards the Fibo/Buy zone 4,183–4,173
Note: this is a counter-trend order, only suitable for accounts accepting intraday risk, volume should be smaller than buy orders.
Scenario 2 – Buy according to the major trend at Fibo 0.618 (priority)
Idea: wait for the ABC correction to complete, buy at the "discount" price area according to Elliott and Fibo.
Buy watch area: 4,183–4,173 (Fibo 0.618 + technical support area).
SL: 4,166
Target direction:
Initially: return to the 4,220–4,230 area
Extended: depending on developments, it may aim for new highs in the context of a record growth year.
4. Fundamental context – Why prioritize Buy on deep corrections?
Gold increased +6% in November, marking the 4th consecutive month of gains.
Previously it was +3.7% in October and +11.9% in September – a very rare series of increases, reinforcing the long-term bull market story.
When an asset has risen strongly but still maintains momentum for many consecutive months, ABC-type corrections on H1 are often just opportunities for new money to participate, rather than trend reversals.

Gold Reaches Exhaustion Zone — Sell Momentum LoadingGold Reaches Exhaustion Zone — Sell Momentum Loading
Gold is showing signs of upside exhaustion, with price repeatedly failing to gain momentum as it approaches the mid-range premium zone near the 4,245 area. The recent structure reflects a market transitioning from short-term recovery into renewed weakness, with each bullish attempt losing strength faster than the previous one.
Order flow remains dominated by distribution behaviour, and the chart signals a potential liquidity sweep followed by a bearish continuation. The projected rejection zone suggests that buyers are running into an area of heavy supply, where institutional activity has previously triggered aggressive downside extensions. Volume distribution across the range also highlights diminishing demand at higher prices, reinforcing the likelihood of a downward rotation.
As the market continues to respect its broader range ceiling, the probability increases for price to revisit deeper value regions. With momentum fading and the current leg showing hesitation, gold is positioned for a potential sell-side move toward lower mean-reversion levels.

If This Is Just Beginning Than End Is Danger.CRYPTO:BTCUSD
Weekly Closing Is Importance For Confirmation And If We Get Confirmation Than Follow Through Is Another Confirmation.
Channel breaking started. if we calculate channel target then around $45000 USD 💀
Please Do Your Own Research Before Talking Any Trade.
I am not finical advisor.
If you have any questions, please feel free to ask me.

GOLD SHOWS WEAKNESS – SELL THE RALLY TOWARD DEMAND!📅 WEEKLY PLAN – November 8, 2025
🚀 HOOK TITLE:
🔥 GOLD SHOWS WEAKNESS – SELL THE RALLY TOWARD DEMAND! 🔥
📊 Market Analysis:
Gold continues to respect a bearish market structure, showing clear Break of Structure (BOS) and Change of Character (CHoCH) patterns on the 2H chart.
After multiple rejections from the upper zones, price is likely forming a lower high before heading to retest the demand below.
The market is currently consolidating between 4020–3980, suggesting a potential liquidity grab before the next impulsive drop.
🎯 Trade Plan:
🔹 Setup 1 – Sell Zone (4037–4039)
Entry: 4037–4039
SL: 4043
TP1: 4018
TP2: 3976
TP3: 3931
🔹 Setup 2 – Sell Zone (4018–4020)
Entry: 4018–4020
SL: 4024
TP1: 3976
TP2: 3931
TP3: 3929
🔹 Setup 3 – Buy Reaction Zone (optional scalp)
Entry: 3931–3929
SL: 3923
TP1: 3974
TP2: 4018
(Only consider if strong bullish rejection or FVG fill appears)
📈 Outlook:
Bias remains bearish unless price breaks and closes above 4043 (invalidating lower-high structure).
Smart traders should sell into strength, waiting for confirmation wicks or bearish engulfing on lower timeframes (M15–M30) inside the marked zones.
📌 Weekly Bias: 🟥 SHORT / SELL MODE
Targeting the imbalance fill toward 3930 area.

Nasdaq 100 E-mini Futures is declining According to my analysis on the 4-hour timeframe, there is a high probability of a decline in NASDAQ 100 futures toward $250.500 after a breakout from the triangle highlighted on the chart

Bajaj finserv respecting resistance levelsbajfinserv has been returning from its resistance levels showing selling pressure
While nifty shows strentgh
bajfinserv show selling pressure
one can watch for downside movement

MRF - BEARISH SETUP (DAILY TIMEFRAME) DOUBLE TOPA double top pattern is a bearish reversal pattern that can be observed on a stock's price chart after an uptrend. It signals that the upward trend may be losing momentum and that a downtrend could be imminent.
Please sell if your setup agrees too - I will sell if 1,45,000 Levels is broken Your Boost and like will remind me to sell so please keep supporting so that this post reminds me to sell MRF at 1.45K levels

Gold price returns to 3363 price zone, gold selling pointPlan XAU day: 20 June 2025
Related Information:!!!
Gold price (XAU/USD) is seen consolidating its intraday losses to over a one-week low and is trading just below the $3,350 level during the first half of the European session. Earlier this week, the US Federal Reserve (Fed) trimmed its outlook for rate cuts in 2026 and 2027, which is seen as a tailwind for the US Dollar (USD) and is weighing on demand for the non-yielding yellow metal.
In addition, a generally positive tone in European equity markets is another factor putting pressure on Gold prices. However, rising geopolitical tensions in the Middle East may cap market optimism amid ongoing trade-related uncertainties and help limit losses for the safe-haven XAU/USD, which remains on track for weekly losses
personal opinion:!!!
Gold price in sell zone, trend line 3362
Important price zone to consider : !!!
SELL point: 3362 zone
Sustainable trading to beat the market

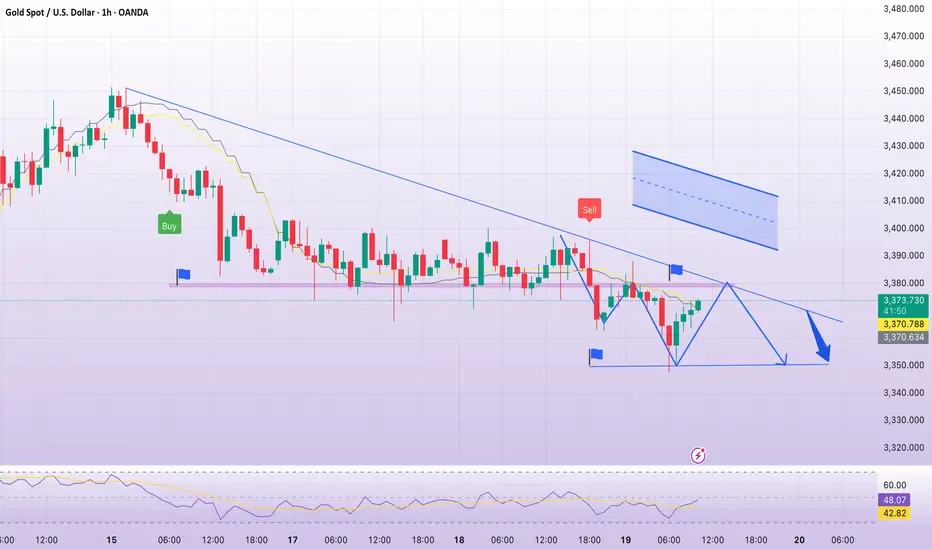
short term downtrend! sell gold 3379Plan XAU day: 19 June 2025
Related Information:!!!
Gold prices show minimal gains as the Asian session begins, following the Fed’s decision to maintain rates while indicating they are still considering two rate cuts. Meanwhile, US President Donald Trump’s comments on Iran triggered a pullback toward a weekly low of $3,362 before settling at around current levels. XAU/USD is trading at $3,375, up 0.19%.
On Wednesday, the Fed kept rates unchanged as expected and updated its economic projections for the United States (US). The median forecasts suggest that Gross Domestic Product (GDP) will be lower than in March’s projections, while the unemployment rate is expected to rise slightly. Inflation is likely to end around the 3% level, and the Federal Funds Rate forecast indicates policymakers are anticipating 50 basis points of easing
personal opinion:!!!
Gold price confirms downtrend in Asian session, price zone 3379 following downtrend line
Important price zone to consider : !!!
SELL point: 3379 zone
Sustainable trading to beat the market
EURUSD SHORT IDEA -09 MAY 2025-SHORT NEAR RED LINE AND SL ABOVE EurUsd 1:3 risk reward ration setup
Reason=
1.Support becomes Resistance
2. Retesting Sale Zone
3. Above Head & Shoulder Pattern
Note-
1.Avoid News time Trading
2.Follow Risk Management


One more SHORT plan with XAUUSD - GOLD on TF M15It's Xmas day so that the Volumn of Market is week --> so that the price is very slow
But with the Cloud Trending System I saw some good signals to make a SHORT sell plan for GOLD OANDA:XAUUSD today.
On M15 Time Frame:
I saw a "Confirmed downtrend signal"
I saw a Downtrend Market Structure : LOWER HIGH
I saw downtrend on main trend of 4 time frames: H4-H1-M30-M15
Specially, I also saw a "Break down follow trend" signal on M15 Cloud Trending Chart
So I make one more SHORT SELL plan for GOLD XAUUSD today with Entry zone = 2616-2617
Stoploss = Trailing Stoploss (a Pink color line above the cloud)
Target 1 = about 2608
Target 2 = about 2598
============
Another: Check this plan yesterday : still running....

OPERATOR GOT OUT FROM BITCOIN SELL BTC FOR 7000 POINT.OPERATOR GOT OUT FROM BITCOIN SELL BTC FOR 7000 POINT.
BTCUSDT showing g 7000 point fall in longtrm
due to the technicals indicating for shell
in bitcoin a strong trendline breakout happened plus
sellers are heavy in full of power
and volumes are gradually increaseing
all these sigh indicaing for falling of btc with a good point
upto 7000.points

NIFTY SELL TRADE There are chances that nifty can give the great sell trade
*Reasons for trade
1) price over buyed
2) There is rsi divergence on 1 hr timeframe
3) moving inside a channel pattern
4) price is going up but volume is contiously decresing
# make sure you set your own stoposs
#one can take trade ones market start breaking download
*Discaimler*
"Dont trade just on my idea do your own anaylis then decide you wanna take or not dont just
trust blindy"
# BEST OF LUCK #

EURJPY 4H sell opportunity | on imbalance areaConfirmation:-
1] Market structure shift
2] Imbalance area
3] M pattern target complete
Target confirmation:-
1st target - imbalance area
2nd target - equal lows liquidity with imbalance

Potential Future Outlook for XAUUSD - March 12th, 2024Why We Think the Price Might Drop:
1. The support level broke at 2160 and is being tested again.
2. The RSI (Relative Strength Index) is around 40, suggesting a signal to sell.
3. The Super Trend indicator indicates a bearish trend.
What Might Happen Next:
Overall, it might be a good idea to sell XAUUSD when the price is around 2160 . We're aiming for targets around 2145 .

Nifty SmallCap under selling pressure1) Nifty SmallCap Index is under strong selling pressure.
2) Index may fall further 3.25% in the upcoming days.
3) 14900 will act as a good support area.
4) Time to cut positions from SmallCap stocks and move to cash.
5) If the Index breaks 14900 again, This will lead to another 4% fall.

Gold Price Action#DXY is going up
#CrudeOil is going up
#USDINR becoming weak
Vs #Gold in Indian rupee should be weak or might be seen correction or fall
Though on chart looks head and solder type pattern but also looks triangle patter which might give up side breakout. So do you homework before take trade in gold
Have a great day!!!
