Learn Institutional options trading Part-6Psychology & Discipline in Options Trading
Success in options requires:
Defined trading plan
Strict risk-reward ratio
Avoiding revenge trades
Avoiding overtrading on expiry days
Regular review and journaling of trades
Emotional control and discipline are more important than strategy in consistent profitability.
Sensex

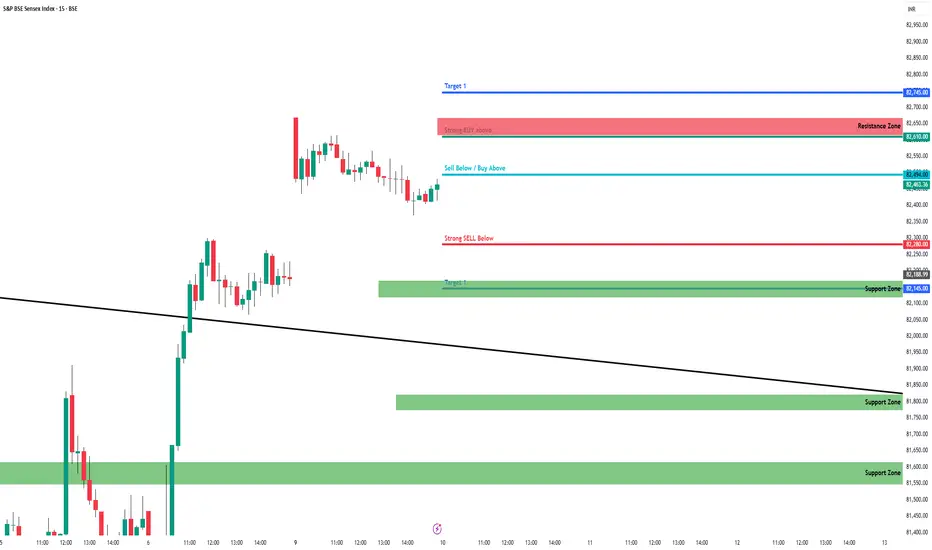
SENSEX - Intraday levels & Prediction for - 10 Jun 2025SENSEX Prediction for Tomorrow:
Trend : Slightly Bearish then Reversal
Sentiment : Positive
Expectation : First half Bearish move then second half can expect BULLISH reversal.
Look for Buy/Sell at Demand and Supply zone for profitable trades.
Demand and Supply Zones - When price breaks the zone, Demand zone will become Resistance and Supply zone will become Support.
Refer the chart for detailed Intraday Support and Resistance levels.
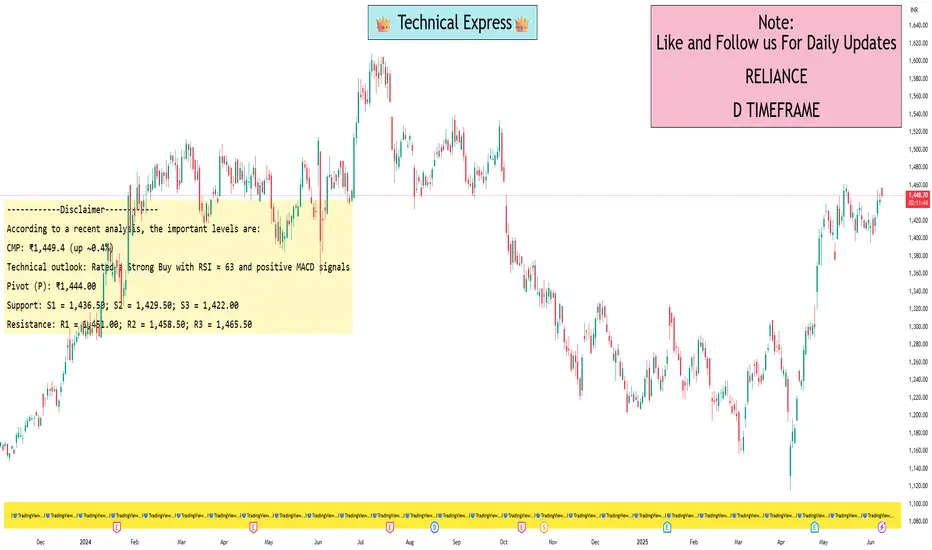
Reliance levels for swing tradingAccording to a recent analysis, the important levels are:
Current Price & Context
-- CMP: ₹1,449.4 (up ~0.4%)
-- Technical outlook: Rated a Strong Buy with RSI ≈ 63 and positive MACD signals
Pivot & CPR Levels
Daily (Classic) Pivot Points
Pivot (P): ₹1,444.00
Support: S1 = 1,436.50; S2 = 1,429.50; S3 = 1,422.00
Resistance: R1 = 1,451.00; R2 = 1,458.50; R3 = 1,465.50
Daily CPR:
Bottom Central (BC) = 1,444.25
Central = 1,444.00
Top Central (TC) = 1,443.75
Weekly Pivot Points
Pivot: ₹1,431.27
Support: S1 = 1,407.83; S2 = 1,372.17
Resistance: R1 = 1,466.93; R2 = 1,490.37
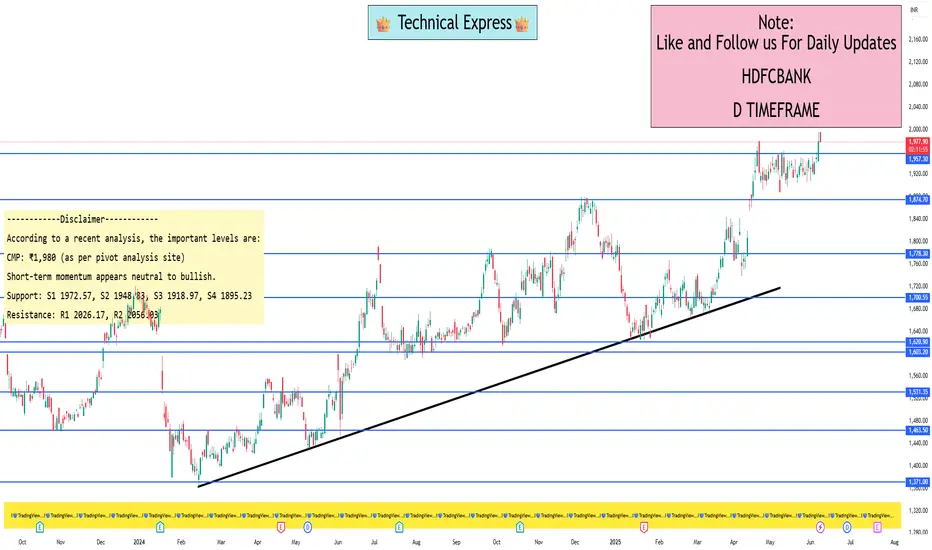
HDFC Bank levels for swing tradingAccording to a recent analysis, the important levels are:
CMP: ₹1,980 (as per pivot analysis site)
Short-term momentum appears neutral to bullish.
Daily Pivot (Classic Standard) – significant for intraday/swing entries
Pivot: 2002.43
Support: S1 1972.57, S2 1948.83, S3 1918.97, S4 1895.23
Resistance: R1 2026.17, R2 2056.03
CPR (Daily):
BC: 1969.50
P: 1972.57
TC: 1975.63
Weekly Pivot – key for multi‑day swing setups
Pivot: 1961.00
Support: S1 1925.70, S2 1872.70, S3 1837.40
Resistance: R1 2049.30, R2 2102.30
CPR (Weekly):
BC: 1952.15
P: 1961.00
TC: 1969.85
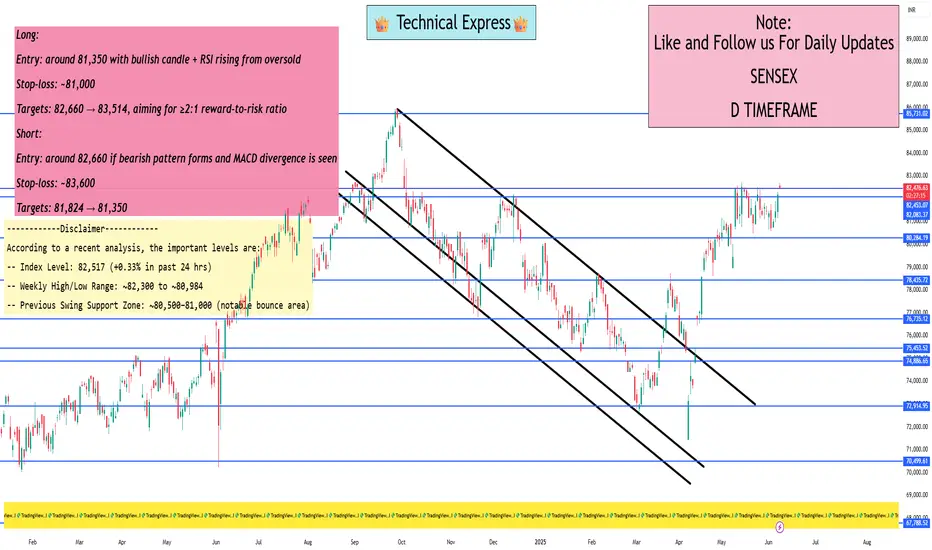
Sensex levels for swing tradingAccording to a recent analysis, the important levels are:
Index Level: 82,517 (+0.33% in past 24 hrs)
Weekly High/Low Range: ~82,300 to ~80,984
Previous Swing Support Zone: ~80,500–81,000 (notable bounce area)
Long:
Entry: around 81,350 with bullish candle + RSI rising from oversold
Stop‑loss: ~81,000
Targets: 82,660 → 83,514, aiming for ≥2:1 reward-to-risk ratio
Short:
Entry: around 82,660 if bearish pattern forms and MACD divergence is seen
Stop‑loss: ~83,600
Targets: 81,824 → 81,350
Banknifty levels for swing tradingAccording to a recent analysis, the important levels are:
Trend‑deciding pivot: 56,713
Primary resistance zones: 56,948, 57,184, 57,420, 57,666
Support zones: 56,578, 56,241, 55,706, 55,534
A dip toward 56,578–56,713 is a potential long entry, targeting 56,948 and beyond.
A break below 56,241 opens doors to deeper support around 55,700–55,500.

Nifty-50 levels for swing tradingAccording to a recent analysis, the important levels are:
Trend‑deciding pivot: 25,064
Resistance (R): 25,142 → 25,221 → 25,299 → 25,343 → 25,416
Support (S): 24,985 → 24,907 → 24,828 → 24,750 → 24,671
Weekly Pivot: ~24,844
R1: ~25,187, R2: ~25,372; S1: ~24,661, S2: ~24,317

India’s Growth Story & Sectoral RotationTopic: India’s Growth Story & Sectoral Rotation
Slide 1: Introduction to India’s Growth Story
India is one of the world’s fastest-growing major economies. With strong demographics, reform-driven policies, and rising consumption, India is projected to become the third-largest economy by 2030.
Key Drivers of Growth:
Youth population & rising middle class
Government capex & infrastructure push
Tech innovation & digital economy
Global supply chain diversification (China+1)
Slide 2: Macroeconomic Tailwinds
✅ Stable GDP growth (6.5–7.5% range)
✅ Controlled inflation & improving fiscal health
✅ Strong forex reserves
✅ Structural reforms (GST, IBC, PLI schemes)
✅ FDI inflows & domestic manufacturing boost
Slide 3: Understanding Sectoral Rotation
Sectoral rotation is the shift in investor preference from one sector to another based on economic cycles, interest rates, or valuation changes. Smart investors track these rotations to maximize returns.
Why It Matters:
Not all sectors perform at the same time
Aligns portfolio with macro & earnings trends
Helps avoid underperforming sectors
Slide 4: Economic Cycle vs. Sector Performance
Economic Phase = Leading Sectors
Early Recovery = Auto, Capital Goods
Mid Expansion = Banking, Infra, IT
Peak FMCG, = Pharma
Slowdown Utilities, = Healthcare
Rotation typically happens quarterly to annually, often influenced by budget, RBI policy, and global cues.
Slide 5: Recent & Future Sector Trends
2023-2024 Themes:
Capital Goods & Infra: Capex surge
PSU Banks: Balance sheet revival
Defence & Railways: Govt-led spending
IT & FMCG: Facing margin pressure, expect rotation soon
Green Energy & EV: Emerging megatrends
2025 Outlook:
Watch for rotation into Financials, Consumption, Manufacturing, and selective Midcaps as earnings visibility improves.
Slide 6: Smart Investment Strategies
🔹 Use Sectoral/Thematic Mutual Funds or ETFs
🔹 Monitor quarterly earnings and sectoral updates
🔹 Combine with Smart SIP & dynamic asset allocation
🔹 Stay updated with policy announcements (Union Budget, RBI)
Smart SIP Strategy & Mutual Fund SelectionTopic: Smart SIP Strategy & Mutual Fund Selection
Slide 1: Introduction to Smart SIP Investing
A Systematic Investment Plan (SIP) helps investors build wealth gradually by investing fixed amounts in mutual funds at regular intervals. A “Smart SIP” goes beyond just monthly investing — it optimizes fund selection, timing, and asset allocation for better returns with lower risks.
Slide 2: What is a Smart SIP?
Traditional SIP vs. Smart SIP:
Traditional SIP invests the same amount monthly, regardless of market condition.
Smart SIP adjusts the investment amount based on market volatility, valuation, or technical indicators.
Smart SIP Components:
Dynamic contribution (more in dips)
Tactical asset allocation (equity, debt, gold)
Fund rebalancing every 6–12 months
Slide 3: Benefits of Smart SIP
✅ Enhances returns through market timing
✅ Reduces downside risk during bear phases
✅ Better rupee cost averaging
✅ Psychological edge (disciplined but flexible investing)
Slide 4: Mutual Fund Selection Criteria
When choosing funds, consider:
Category (Large-cap, Flexi-cap, Mid-cap, etc.)
Fund Manager Performance (Consistency over 3–5 years)
Expense Ratio (Lower = better returns)
Portfolio Quality (Diversification, sector exposure)
Fund Ratings (Morningstar, CRISIL, Value Research)
Slide 5: Types of Funds to Combine in a Smart SIP
Large Cap Fund – Stability & consistent returns
Flexi-Cap Fund – Dynamic across market cap
Mid/Small Cap Fund – Higher growth (add with caution)
Debt Fund – Hedge during market volatility
Thematic/Sectoral Fund – Optional, high-risk/high-reward
Slide 6: Ideal Smart SIP Strategy
🔹 Step 1: Allocate based on age & risk profile
🔹 Step 2: Use staggered investing — more in market dips
🔹 Step 3: Track fund performance quarterly
🔹 Step 4: Rebalance portfolio every 6–12 months
🔹 Step 5: Exit or reduce allocation when valuations are extreme

Dividend Investing & High-Yield StocksTopic: Dividend Investing & High-Yield Stocks
Slide 1: Introduction to Dividend Investing
What is Dividend Investing?
Dividend investing involves buying shares of companies that regularly pay out a portion of their earnings to shareholders. These payments, called dividends, are usually distributed quarterly and serve as a steady income source.
Why It Matters:
Generates passive income
Offers compounding returns when reinvested
Often signals strong, stable companies
Ideal For:
Long-term investors
Income-focused portfolios
Retirees looking for stable cash flow
Slide 2: Understanding High-Yield Stocks
Definition:
High-yield stocks offer a dividend yield significantly higher than the market average. Yield = Dividend per Share ÷ Share Price.
Pros:
Higher income returns
Potential price appreciation
Strong incentive for holding
Risks:
Yield traps (unsustainable payouts)
Sector-specific concentration (REITs, utilities)
Sensitivity to interest rate changes
Slide 3: Key Metrics to Analyze
1. Dividend Yield – High isn't always better; compare with industry peers.
2. Payout Ratio – % of earnings paid as dividends (ideal: <60%).
3. Dividend History – Consistent and increasing dividends show reliability.
4. Free Cash Flow – Enough cash to support future dividends.
5. Debt Levels – Too much debt may affect dividend sustainability.
Slide 4: Popular High-Yield Sectors
REITs (Real Estate Investment Trusts)
Utilities
Telecom
Energy/Oil & Gas
MLPs (Master Limited Partnerships)
These sectors often have regulated income or asset-backed cash flow streams, making them stable dividend payers.
Slide 5: Example High-Yield Stocks (India & Global)
India:
Coal India
Power Grid Corp
REC Ltd
ITC Ltd
Global:
AT&T
Verizon
Realty Income Corp (O)
Altria Group (MO)
Ensure to check for recent financial updates before investing.
Slide 6: Dividend Growth vs High Yield
Dividend Growth Stocks: Lower yield, but consistent increases (e.g., Infosys, HDFC Bank)
High-Yield Stocks: High immediate income, but riskier if growth lags
Balanced Approach: Combine both types for income and capital growth.

Open Interest & Option Chain Analysis Topic: Open Interest & Option Chain Analysis
1: What is Open Interest (OI)?
Simple Meaning:
Open Interest means the total number of active option or futures contracts in the market that haven’t been closed yet.
Easy Example:
If you and your friend enter into a new option trade, the open interest is 1. If someone else joins with a new trade, it becomes 2. But if you close your trade, it becomes 1 again.
What It Tells You:
If OI is increasing, more people are joining the market.
If OI is decreasing, traders are exiting their trades.
Combine OI with Price Movement:
Price going up + OI going up = New buying → Bullish
Price going down + OI going up = New selling → Bearish
Price going up + OI going down = Traders exiting shorts → Short covering
Price going down + OI going down = Traders exiting longs → Profit booking
2: What is an Option Chain?
Simple Meaning:
Option Chain is a table that shows all the call and put options for a stock at different strike prices.
What You’ll See in an Option Chain:
Strike Price: The price you agree to buy/sell.
Calls (CE): Right to buy.
Puts (PE): Right to sell.
Open Interest (OI): How many contracts are active.
Volume: How many were traded today.
LTP: Latest price of that option.
3: How to Read Option Chain Like a Pro
1. Spot the Support Levels:
Look for the highest OI on the put (PE) side → Big money sees this as support.
2. Spot the Resistance Levels:
Look for the highest OI on the call (CE) side → Traders think price won't go above this.
3. Track Market Mood:
If more puts are being written (PE OI going up) → Traders are bullish.
If more calls are being written (CE OI going up) → Traders are bearish.
4. PCR (Put Call Ratio):
PCR > 1 → More puts than calls = Bullish
PCR < 1 → More calls than puts = Bearish

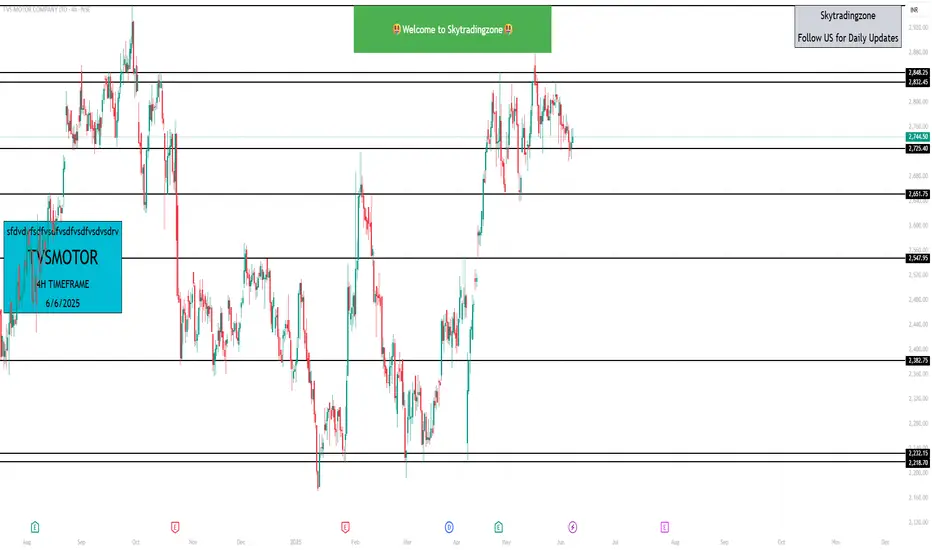
TVSMOTOR important Support and resistance levels Resistance Zones:
~₹2,784–2,820 — Significant intraday/short-term resistance cluster
₹2,839–2,846 — Upper resistance on daily chart, confirmed by multiple analysts
Support Zones:
₹2,720–2,667 — Identified as critical support zone
Lower boundary around ₹2,667 (daily pivot S3)
Pivot Point Levels (Classic):
Pivot: ₹2,738
Support: S1 ₹2,717, S2 ₹2,687, S3 ₹2,666
Resistance: R1 ₹2,768, R2 ₹2,789, R3 ₹2,819
Advance Institutions Option Trading - Lecture 5When it comes to low risk options strategies, selling a call spread and selling a put spread are techniques that traders often utilize. These strategies are characterized by a high probability of profit due to the low probability of loss, and they limit risk in case the trade doesn't go as planned.
While day traders look at minute-to-minute price changes, swing traders look at trends that play out over several days. This is considered one of the most profitable trading types that allows more flexibility, as you don't need to be glued to your computer screen all day.

Advance Institutions Option Trading - Lecture 3Options trading might feel like gambling on a single trade, but informed decisions make it fundamentally different. Reckless trading without a plan can resemble gambling but is not the proper way to trade. With discipline and skill, options trading stands apart from luck-based activities.
Options involve risk and are not suitable for all investors. Certain requirements must be met to trade options. Before engaging in the purchase or sale of options, investors should understand the nature of and extent of their rights and obligations and be aware of the risks involved in investing with options.

Advance Institutions Option Trading - Lecture 4If you're looking for a simple options trading definition, it goes something like this: Options trading gives you the right or obligation to buy or sell a specific security on or by a specific date at a specific price. An option is a contract that's linked to an underlying asset, such as a stock or another security.
Options trading also involves two parties: the holder (buyer) and the writer (sometimes called the seller). Holders are investors who purchase contracts, while writers create them. The holder pays the writer a premium for the right to sell or buy a stock by a certain date.

SENSEX - Intraday levels & Prediction for - 03 Jun 2025SENSEX Prediction for Tomorrow:
Trend : Mod. BEARISH
Sentiment : Positive
Expectation : BEARISH Trend Continuation upto 80500Target
Look for Buy/Sell at Demand and Supply zone for profitable trades.
Demand and Supply Zones - When price breaks the zone, Demand zone will become Resistance and Supply zone will become Support.
Refer the chart for detailed Intraday Support and Resistance levels.

Institutional Intraday Trading Part -7Options Type: Understand whether you're dealing with Call Options (bullish) or Put Options (bearish).
Strike Price: This is the agreed price for exercising the contract. ...
Open Interest (OI): Indicates the number of active contracts for a strike price.

A Seasoned Eye on the Indian Market: Intraday Analysis of May 15A Seasoned Eye on the Indian Market: Intraday Analysis for May 15th
Fellow Traders,
Greetings from the trading desk where I've had the privilege of observing these captivating market rhythms for over nine decades. Today, May 15th, as the morning session unfolds, we're presented with an intriguing, albeit mixed, canvas across our key Indian indices. The 15-minute charts in front of us offer a granular view, essential for us day traders who thrive on the market's intraday pulse. Let's dissect what these charts are whispering – and occasionally shouting – to us.
The Overall Market Tapestry: A Picture of Divergence
As of roughly 10:08 AM, the Indian market is not singing in perfect harmony. We see the Nifty 50 slightly in the red at 24,517.05 (-0.18%), while its elder statesman, the S&P BSE Sensex, is exhibiting a touch more resilience, up 0.11% at 81,009.21. This minor divergence between the two giants is noteworthy.
Further down the line, the Nifty MidCap Select is holding relatively steady at 12,647.95 (-0.03%), suggesting that the broader market breadth isn't entirely pessimistic at this juncture. However, the elephant in the room, or rather, the bear in the banking hall, is the Nifty Bank. It's showing the most pronounced weakness among the four, trading at 54,474.45, down 0.14%, and its chart warrants our closest attention.
The "12 indicators in 1" panel, a consolidated sentiment gauge, is predominantly green across all four indices. This is a crucial piece of information, suggesting underlying buying interest or accumulation, even in the face of some price weakness. This creates a fascinating tension, especially in Nifty Bank, which we will delve into.
Nifty 50: Teetering on the Edge
The Nifty 50, on its 15-minute chart, has seen a pullback from its intraday highs. It's currently hovering just above the dynamic line of the "Adaptive Trend Finder" indicator. Interestingly, this indicator has flashed a "SELL" signal. However, the price is still trading above the indicator line itself, which is currently at 24,515.35. This is a classic scenario that can cause confusion. Is the "SELL" signal premature, a whipsaw, or is the indicator line acting as immediate support? The "Trend Strength" is noted as "Normal."
My experience tells me that when price flirts with an indicator line like this after a signal, a decisive break is needed for confirmation. A sustained move below 24,515 could validate the sell signal, potentially opening up lower levels. Conversely, if this line holds and Nifty bounces, the sell signal would be negated, and it might indicate a failed breakdown attempt. The green bars on the "12 indicators in 1" suggest that buyers are still present. For now, Nifty is in a watchful waiting mode. A break above the recent micro-swing high (around 24,560-ish, looking at the candles) would be a sign of renewed bullish intent for the short term.
S&P BSE Sensex: A Beacon of Relative Strength?
The Sensex chart paints a slightly more optimistic picture. It’s also seen a minor dip but is holding its ground better than the Nifty 50. Critically, the "Adaptive Trend Finder" on the Sensex is displaying a "BUY" signal, with the price (81,009.21) comfortably above the indicator line (81,010.68 – note the slight discrepancy, price is just below but visually appears above, let's consider it testing the line from above). The upward arrow confirms this bullish stance from the indicator. The "Trend Strength" is "Normal."
The "12 indicators in 1" panel is also firmly green. This alignment – a buy signal, price above the line (or testing it), and positive underlying indicators – gives a slightly more confident bullish bias to the Sensex for the immediate short term compared to the Nifty 50. If the Sensex can maintain this posture and break its own intraday highs, it could lead the way for the Nifty.
Nifty MidCap Select: The Quiet Consolidator
The MidCap Select index is currently a picture of relative calm amidst the minor stirs in the frontline indices. It's trading flat, and the chart shows a period of consolidation. The "Adaptive Trend Finder" here is also on a "BUY" signal, with the price (12,647.95) above the indicator line (12,647.65). The "Trend Strength" is "Moderate," which aligns with the observed sideways price action.
The green "12 indicators in 1" here is consistent with the buy signal. Midcaps often have their own stories, but their stability at this point is a small positive. It suggests that risk appetite hasn't evaporated entirely from the broader market. Traders in this segment should watch for a breakout from the current consolidation range to dictate the next short-term move.
Nifty Bank: The Crucial Pivot and Potential Troublemaker
Now, let's turn to the Nifty Bank, which, in my decades of experience, often holds the key to the market's broader directional bias, especially intraday. Here, the picture is more concerning. The index has clearly been underperforming in the recent candles, making lower highs and lower lows on this 15-minute timeframe.
The "Adaptive Trend Finder" has issued a clear "SELL" signal, and the price (54,474.45) is trading below the indicator line (54,472.40 – again, price is actually above this specific print, but visually appears to be struggling with the line as resistance). The downward arrow reinforces this bearish signal from the indicator. The "Trend Strength" is "Normal."
This is where things get particularly interesting and require a seasoned interpretation. Despite this clear sell signal on the Adaptive Trend Finder and the immediate bearish price action, the "12 indicators in 1" panel for Nifty Bank is staunchly GREEN. This is a significant divergence. What does it mean?
Several possibilities arise:
Lagging Composite Indicator: The "12 indicators in 1" might be lagging, and the price action combined with the Adaptive Trend Finder's signal is the true leading indication of developing weakness.
Accumulation by Strong Hands: The green panel could suggest that despite the surface-level selling, stronger players are absorbing the supply at these levels, anticipating a bounce.
Non-Confirmation & Impending Volatility: Such divergences often precede a sharp move. The market is essentially coiled. If the selling pressure in Bank Nifty intensifies and it decisively breaks below the current lows (around 54,400, eyeballing the chart), the green on the 12-in-1 might quickly flip, and we could see a cascade. Conversely, if buyers step in, vindicating the 12-in-1 indicator, and Nifty Bank reclaims levels above, say, 54,550-54,600, the sell signal from the Adaptive Trend Finder could prove to be a bear trap.
Given Nifty Bank's weight, its direction will likely influence the Nifty 50 significantly. The current setup in Bank Nifty demands extreme vigilance.
Inter-Market Dynamics & Trading Considerations
The key takeaway from this snapshot is the divergence between Nifty Bank and the other indices, particularly the Sensex. While Sensex and MidCaps are showing buy signals on the Adaptive Trend Finder, Nifty Bank is on a sell. Nifty 50 is caught in the middle, with a sell signal but price attempting to hold above the indicator line.
As day traders, such mixed signals call for caution, not aggressive conviction.
For Longs: The Sensex, if it continues to hold above its Adaptive Trend line (approx. 81,000-81,010), might offer opportunities, but keep a close eye on Nifty Bank. If Bank Nifty slides further, it will likely drag Sensex down too.
For Shorts: Nifty Bank is the prime candidate if bearish momentum picks up. A confirmed break below its Adaptive Trend line (around 54,470) and the immediate swing lows could be a trigger. However, the green "12-in-1" is a warning sign for bears – be prepared for a potential sharp reversal if support holds.
Nifty 50 is the Battlefield: It will likely resolve in the direction of the victor between Sensex's resilience and Bank Nifty's weakness. Wait for a clearer signal here – a decisive break above recent highs or below the Adaptive Trend line (24,515).
The Wisdom of Experience: Patience and Risk Management
Remember, these are 15-minute charts. Trends can be fleeting, and the market can turn on a dime. We are still in the first couple of hours of trading; the true directional intent for the day often solidifies later.
Volume Confirmation: I don't have volume data in this view, but always seek volume confirmation for your trades. Breakouts on low volume are suspect.
Stop-Losses are Non-Negotiable: In such a mixed environment, defined stop-losses are your best friend.
Position Sizing: Adjust your position size according to the conviction in the trade and the market's volatility. Smaller bets are prudent when signals are muddled.
The market is a dynamic entity. What we see now can change rapidly. The "12 indicators in 1" remaining green across the board is a thread of underlying optimism, but price action is king. The Nifty Bank's trajectory in the next hour or so will be pivotal.
Stay nimble, stay disciplined, and may the pips be with you. We are observers and reactors, always respecting what the tape tells us. This early session is setting up an interesting day; let's watch how these patterns evolve.

Master class Find the Top Watch out for strong stocks. As a trader you must identify strong and weak stocks. ...
Research well. ...
Focus on a small set of stocks. ...
Keep an eye on the news. ...
Focus on timing. ...
Use tools and indicators. ...
Find the right trading platform.

How to Find any Top or Bottom in Stocks or Index with Data A call option writer stands to make a profit if the underlying stock stays below the strike price. After writing a put option, the trader profits if the price stays above the strike price. An option writer's profitability is limited to the premium they receive for writing the option (which is the option buyer's cost).

Learn Intestinal Level TradingIf you're looking for a simple options trading definition, it goes something like this: Options trading gives you the right or obligation to buy or sell a specific security on or by a specific date at a specific price. An option is a contract that's linked to an underlying asset, such as a stock or another security.
Several factors contribute to this high failure rate: Lack of Knowledge and Education: Many traders enter the options market without a thorough understanding of how options work. Options can be complex financial instruments, and trading them without proper education can lead to significant losses
Option trading is largely a skill requiring knowledge of market trends, strategies, and risk management techniques. While there is an element of uncertainty in the markets, successful traders rely on analysis, planning, and discipline rather than luck.

Nifty CMP at 24335 At this level according to waves it can be preparing for final wave (v) but only if it crosses 24550, till then we should be only observe it as wave 4 correction phase,
No short OR EVEN No long in this range ,

NIFTY - 50 // 4 Hour Support and ResistanceAs of April 24, 2025, the Nifty 50 index is exhibiting a neutral to slightly bullish trend. Here's a summary of the key support and resistance levels based on recent technical analyses:
Newscast India
🔽 Key Support Levels
23,800: Identified as a crucial support level by multiple analysts. A breach below this could lead to further declines.
23,400–23,450: Considered a significant support zone, with the 11 and 20-day exponential moving averages providing additional support.
23,327: Marked as a strong support level, with the index recently reclaiming the 200-day moving average at 23,590.
🔼 Key Resistance Levels
24,500–24,700: This range is viewed as a significant resistance zone, with analysts noting that a breakout above this could lead to further gains.
24,000–24,125: Identified as immediate resistance levels, with 24,100 being a key hurdle for the index.
24,600–24,700: Considered a resistance zone, with the 24,600–24,700 range acting as a significant resistance level.
