SENSEX : Trading levels and Plan for 04-Dec-2025📊 SENSEX TRADING PLAN — 04 DEC 2025
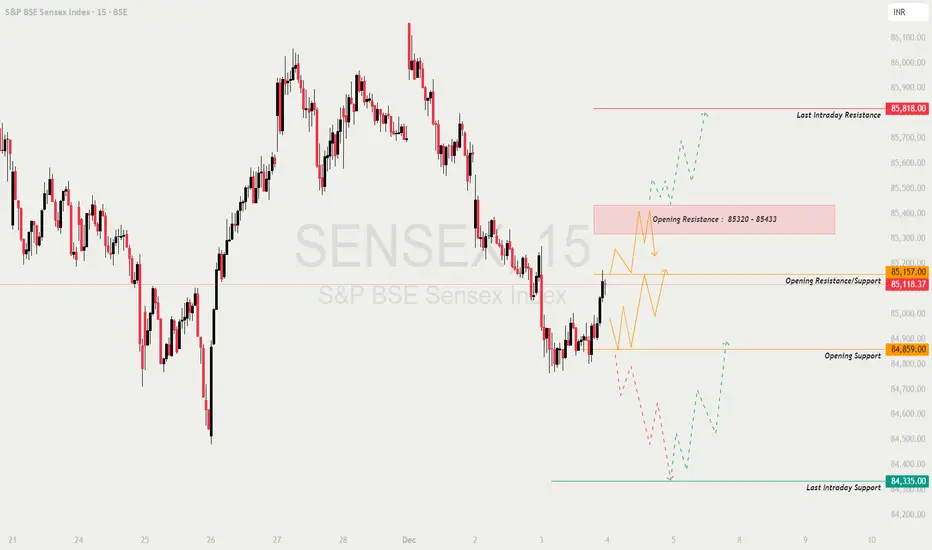
Price closed near 85,118, sitting just below key zones:
• Opening Resistance/Support: 85,157
• Opening Support: 84,859
• Opening Resistance Zone: 85,320–85,433
• Last Intraday Resistance: 85,818
• Last Intraday Support: 84,335
The market recently bounced from lows but still sits within a corrective structure. Tomorrow’s opening direction will decide whether SENSEX attempts to retest upper resistance zones or slides back toward the 84,335 support region.
🚀 1. GAP-UP OPENING (300+ points)
A gap-up above 85,433 or directly inside the Opening Resistance Zone (85,320–85,433) demands patience and confirmation-based trading.
1. If price opens inside 85,320–85,433
• Avoid chasing longs immediately.
• This zone historically attracts sellers.
• Wait to see if price rejects with wicks or bearish CHoCH.
• Short entries become valid only if price falls back below 85,157.
• Downsides: 84,859 → 84,600.
2. If price opens above 85,433
• Look for a retest of 85,320–85,433 before entering long.
• If retest holds → Upside targets toward 85,600 → 85,818.
• This is the highest-probability long of the day.
3. Breakout above 85,818 (Last Intraday Resistance)
• Needs a strong bullish candle close.
• If sustained → Momentum expansion toward 86,000+ possible.
• Book partial profits near earlier swing highs to reduce risk.
📌 Educational Note:
A gap-up often creates FOMO. But professional traders wait for retests because they reduce risk and confirm buyer strength.
⚖ 2. FLAT OPENING (±80 pts around 85,118)
A flat open allows structure-based trading on both sides, offering cleaner setups.
1. If price sustains above 85,157
• Buyers show early strength.
• Upside targets: 85,320 → 85,433 → 85,600.
• Watch for a breakout continuation setup.
2. Rejection from 85,157
• With bearish candle patterns → Short opportunity.
• Initial targets: 84,859 → 84,600.
3. If price trades between 84,859–85,157
• Expect range-bound behavior.
• Trade only extremes with confirmation:
– Buy near 84,859,
– Sell near 85,157.
📌 Educational Note:
Flat openings reveal direction through early structure shifts. The key is waiting for higher-lows (bullish) or lower-highs (bearish).
📉 3. GAP-DOWN OPENING (300+ points)
Gap-down openings near or inside the Last Intraday Support (84,335) require patience and caution.
1. If price opens inside 84,335 Support Zone
• Do NOT short blindly—this is a reaction zone.
• Look for reversal signs: hammer, bullish engulfing, CHoCH.
• If reversal confirmed → Long toward 84,859 → 85,157.
2. If price breaks below 84,335 on opening
• Avoid chasing breakdowns.
• Wait for a retest of 84,335.
• If rejection appears → Short entry toward 84,150 → 84,000.
3. Strong recovery after Gap-Down (V-Shape)
• If price quickly reclaims 84,335, buyers are active.
• Above 84,859 → Trend shifts bullish intraday.
• Upside targets: 85,157 → 85,320.
📌 Educational Note:
Gap-downs often act as liquidity sweeps—smart money absorbs selling pressure before pushing price upward.
🛡 RISK MANAGEMENT TIPS FOR OPTIONS TRADERS
1. Avoid first 5–10 minutes of trading after big gap openings.
Market needs time to stabilize.
2. Never buy OTM options after a big gap.
Premium decay will eat your trade.
3. Use price action–based stops instead of premium-based SL.
4. Position sizing rule:
Risk ONLY 1–2% of your capital per trade.
5. High IV → Prefer option selling.
Low IV → Option buying becomes efficient.
6. Book profits near key levels (e.g., 84,859, 85,157, 85,320, 85,433).
7. Avoid revenge trading or entering against strong trends without confirmation.
📌 SUMMARY & CONCLUSION
• Bullish bias above 85,320–85,433, with potential toward 85,818.
• Range-bound behaviour likely between 84,859–85,157.
• High-probability reversals expected from 84,335 on gap-down.
• Wait for retests and confirmations before entering trades.
• Follow structure strictly—levels decide the direction.
⚠ DISCLAIMER
I am not a SEBI-registered analyst.
All information above is for educational purposes only and not investment advice.
Markets are dynamic—always apply your own judgment and risk management.
Sensexsignal
SENSEX : Trading levels and Plan for 03-Dec-2025📊 SENSEX TRADING PLAN — 03 DEC 2025
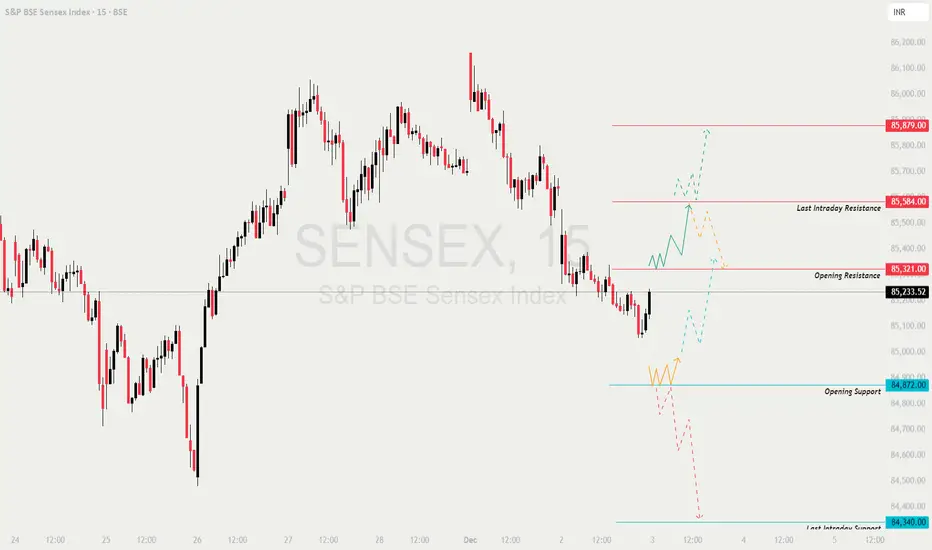
Sensex closed near 85,233, right below the Opening Resistance (85,321).
The structure shows a base at 84,872 and intraday resistance at 85,584, with clear upside and downside liquidity zones.
The opening trend will depend on how the index behaves around 85,321 and 84,872.
🔍 KEY MARKET LEVELS
🟥 Opening Resistance: 85,321
🟥 Last Intraday Resistance: 85,584
🟥 Major Bull Target: 85,879
🟩 Opening Support: 84,872
🟩 Last Intraday Support: 84,340
🟩 Major Bear Target: 84,150 – 84,050
🟢 SCENARIO 1 — GAP-UP OPENING (300+ POINTS)
Expected opening: 85,500–85,600 region (inside or near last intraday resistance)
If the market opens above 85,500, it will directly test the 85,584 resistance (supply zone).
For long continuation:
✔️ Break above 85,584
✔️ Retest candle with a strong lower wick
🎯 Targets → 85,720 → 85,879
If candles show rejection at 85,584 (upper wicks, volume drop):
Expect profit-booking toward:
➡️ 85,450 → 85,321
Aggressive short traders may fade the rejection from 85,584, but only with confirmation such as lower highs on 3–5 min charts.
📘 Educational Insight:
Gap-ups into major resistance are high-risk for longs.
Always wait for either a clean breakout or a clear rejection before acting.
🟧 SCENARIO 2 — FLAT OPENING (Around 85,200–85,300)
Price will open exactly near the Opening Resistance (85,321) — a decision zone.
Upside trigger for long trades:
✔️ Break + sustain above 85,321
🎯 Targets → 85,420 → 85,500 → 85,584
Downside trigger for shorts:
✔️ Break below 85,150
🎯 Targets → 84,990 → 84,872
Avoid taking positions inside a tight range around 85,200–85,321 until a clear directional candle closes.
Most reliable setups:
— Retest of 85,321 for longs
— Retest of 85,150 breakdown for shorts
💡 Educational Note:
Flat openings require patience.
Trend becomes clear after the first 3–4 candles—avoid impulse trades.
🔻 SCENARIO 3 — GAP-DOWN OPENING (300+ POINTS)
Expected opening: 84,800–84,900 zone (near Opening Support)
If price holds 84,872, expect a reversal bounce toward:
➡️ 85,050 → 85,150 → 85,321
For safe long reversal entries:
✔️ Support respected for 3–4 candles
✔️ Higher low structure
✔️ Bullish reversal wick at support
If breakdown occurs below 84,872 with strength:
Sellers will target → 84,600 → 84,480 → 84,340
Major breakdown trigger:
✔️ Sustained trade below 84,340
🎯 Targets → 84,150 → 84,050
📘 Educational Note:
Gap-downs into strong support often generate false breakdowns.
Let the retest after the first breakdown decide the direction.
💼 RISK MANAGEMENT TIPS FOR OPTIONS TRADERS 📘⚠️
Trade only after the first 5–10 minutes to avoid trap candles.
Use ITM options for momentum trades to reduce theta decay.
Keep stop-loss based on chart levels, not random premium numbers.
Do not average losing trades — exit and re-enter on new structure.
Trail SL after each target hit (especially in strong trends).
Avoid naked selling near event days or high VIX.
Stop trading after 2 consecutive losses.
💡 Pro Tip:
When market enters a “No Trade Zone”, shift focus from trading to observing liquidity behaviour.
📌 SUMMARY
Bullish Above:
✔️ 85,321 → 85,420 → 85,500 → 85,584 → 85,879
Bearish Below:
✔️ 85,150 → 84,990 → 84,872 → 84,600 → 84,340 → 84,150
Critical Zones:
🟥 Major Resistance → 85,584
🟩 Major Support → 84,872, 84,340
Trend Deciders:
🔑 Above 85,321 → Bullish day
🔑 Below 84,872 → Intraday weakness
🔑 Below 84,340 → Trend breakdown
🧾 CONCLUSION
Sensex is at a crucial turning point.
The market tone for 03-Dec will be set by how price behaves around:
✔️ 85,321 on the upside
✔️ 84,872 on the downside
Follow levels, not emotions.
Avoid trades in indecisive ranges and strike only on confirmed breakouts or clean retests.
⚠️ DISCLAIMER
I am not a SEBI-registered analyst.
This analysis is for educational and study purposes only.
Consult a certified financial advisor before investing or trading.
SENSEX : Trading levels and Plan for 20-Nov-2025Request you please hit LIKE or BOOST button - Like Target 25
📊 SENSEX TRADING PLAN — 20 NOV 2025
(Timeframe: 15-min | Reference: Key price reaction zones & intraday structure)
SENSEX closed around 85,176, sitting directly inside the No-Trade Zone (85,026 – 85,232) which indicates indecision and potential volatility at tomorrow’s open. Price is just below a strong resistance cluster at 85,577 – 85,612, and a major upside extension level at 85,999.
Key Zones to Track:
🟧 No-Trade Zone: 85,026 – 85,232
🔴 Last Intraday Resistance: 85,577 – 85,612
🔴 Major Resistance / Profit Booking Zone: 85,999
🟩 Opening Support: 85,026
🟩 Last Intraday Support: 84,882
🟩 Major Support: 84,678
Below is the complete action plan for all opening scenarios 👇
🟢 SCENARIO 1 — GAP UP OPENING (300+ points)
If SENSEX opens at 85,450+, price will approach or enter the Last Intraday Resistance Zone (85,577 – 85,612).
If price sustains above 85,612 for 10–20 mins with strong candles →
🎯 Upside targets = 85,750 → 85,880 → 85,999
If price rejects from 85,577–85,612 →
Expect a correction down to:
➡️ 85,400 → 85,232
Avoid immediate buying on a gap-up directly under resistance since high probability of profit booking.
Safer entry = Breakout → Retest → Continuation above 85,612.
📘 Educational Tip:
Gap-ups into supply zones often trigger selling. Confirmation candles are essential before entering long positions.
🟧 SCENARIO 2 — FLAT OPENING (Around 85,100–85,200)
A flat open places price inside the No-Trade Zone (85,026 – 85,232) — avoid impulsive entries.
If price sustains above 85,232, bullish bias activates.
🎯 Targets → 85,350 → 85,450 → 85,577
If price breaks below 85,026, bearish leg likely.
📉 Targets → 84,882 → 84,678
Best trades:
— Breakout from 85,232
— Breakdown from 85,026
Avoid trading in the middle of the No-Trade Zone.
💡 Educational Note:
Flat openings inside equilibrium zones often generate false moves. Wait for a clear breakout before positioning.
🔻 SCENARIO 3 — GAP DOWN OPENING (300+ points)
If SENSEX opens around 84,700–84,800, price lands near the Last Intraday Support (84,882) and may test deeper support at 84,678.
Bullish reversal is possible if 84,678–84,882 holds with wick rejections →
🎯 Upside targets → 85,026 → 85,232 → 85,350
If price fails 84,678 →
Strong bearish continuation
📉 Targets → 84,520 → 84,400
This zone provides high RR reversal trades — but only with confirmation.
Avoid trying to catch falling knives without structure.
📘 Educational Tip:
Gap-downs entering demand zones typically give the day’s biggest reversal moves — but always after confirmation, not anticipation.
💼 RISK MANAGEMENT TIPS FOR OPTION TRADERS 💡
Trade only after first 5–10 min to avoid opening volatility.
Use ITM options for directional intraday trades.
Keep SL strictly at 20–30% of premium for option buying.
Do NOT average losing trades.
In higher VIX, prefer spreads (Credit/Debit spreads).
Take partial profit at 30–40% and trail SL.
Avoid trading inside No-Trade Zones — unnecessary chop kills premium.
⚠️ Golden Rule:
Capital protection > catching a move. One good trade a day is enough for consistent profitability.
📌 SUMMARY
Bullish Above → 85,232
Targets → 85,350 → 85,450 → 85,577 → 85,612 → 85,999
Bearish Below → 85,026
Targets → 84,882 → 84,678 → 84,520
High-Risk Zone:** 85,026–85,232 (No-Trade Zone)**
Major Reversal Zone:** 85,577–85,612
🧾 CONCLUSION
SENSEX sits at an equilibrium zone before a major directional move.
The most reliable trades will come from:
✔️ Breakout above 85,232
✔️ Rejection from 85,577–85,612
✔️ Reversal from 84,678–84,882 support
Let the market give direction — avoid forcing trades inside the No-Trade Zone.
⚠️ DISCLAIMER
I am not a SEBI-registered analyst.
This analysis is for educational purposes only and not investment advice. Please consult a certified financial advisor before taking any trading decisions.

SENSEX : Trading levels and plan for 17-Nov-2025📊 SENSEX TRADING PLAN — 17 NOV 2025
(Timeframe Reference: 15-Min Chart)
Chart Summary:
Sensex closed around 84,654 , showing a recovery from the recent lows but still within a mixed-to-cautious phase. The price currently hovers near 84,730 (Opening Resistance / Support Zone) , suggesting a tight equilibrium between buyers and sellers.
Immediate resistance is placed at 85,081 (Gap-Up Opening Resistance) , followed by 85,437 (Last Intraday Resistance) . On the downside, supports lie near 84,231 (Opening Support) and 83,800 (Last Intraday Support) .
The overall bias remains neutral to bullish as long as the index holds above 84,231 . A breakout above 84,730 could push the index toward higher zones, whereas a failure to hold 84,231 may invite a deeper retracement.
Key Zones to Watch:
🟩 Support Levels: 84,231 / 83,800
🟥 Resistance Levels: 84,730 / 85,081 / 85,437
⚖️ Bias Zone: Between 84,231 – 84,730 (Consolidation area, watch for breakout confirmation)
---
🟢 Scenario 1: GAP-UP Opening (300+ Points)
If Sensex opens around or above 85,000 – 85,100 , it will directly enter the Gap-Up Resistance Zone (85,081) . This could attract early profit-booking as the price approaches the upper resistance levels.
If Sensex sustains above 85,081 for 15–20 minutes with strong bullish candles, targets open toward 85,300 – 85,437 .
If price rejects 85,081 with visible upper wicks or doji candles, a pullback toward 84,730 – 84,600 could occur.
Avoid immediate long entries on the gap-up — wait for price to retest 85,000 – 85,050 for confirmation of support.
A strong sustained move above 85,100 may indicate fresh buying momentum for the day.
💡 Educational Note:
When a market gaps up near resistance, emotions drive early buying. But true confirmation comes only when the breakout is sustained with rising volume. Patience after the open often reveals whether bulls truly have control.
---
🟧 Scenario 2: FLAT Opening (Around 84,600 – 84,700 Zone)
A flat opening near 84,730 would place Sensex right inside the equilibrium zone. Such opens usually result in initial range-bound movement before breakout direction appears.
Avoid trading within 84,600 – 84,730 in the first 15–20 minutes; allow market structure to form.
If price sustains above 84,730 , upside targets open toward 85,081 – 85,437 .
If the price breaks below 84,600 , weakness may pull it toward 84,231 .
Look for volume-backed breakouts — confirmation candles (close outside the range) are critical before entries.
🧠 Educational Tip:
Flat openings test patience. Avoid predicting direction inside consolidation zones — instead, let price action show its hand. Real traders act on confirmation, not anticipation.
---
🔴 Scenario 3: GAP-DOWN Opening (300+ Points)
If Sensex opens near 84,200 – 84,300 , it will test the Opening Support (84,231) . A further slip below this could extend weakness toward 83,800 (Last Intraday Support) .
If price stabilizes and forms bullish candles (hammer or engulfing) near 84,200 – 84,250 , a pullback toward 84,600 – 84,730 can be expected.
If breakdown below 84,231 occurs with volume, next support to watch is 83,800 .
Avoid panic shorting after a gap-down; instead, wait for a retest near 84,400 – 84,450 for safe entries with better risk-reward.
Declining volume on red candles near supports often signals seller exhaustion — use this as an early reversal clue.
📘 Educational Insight:
Gap-downs often trigger emotional selling, but seasoned traders focus on price structure. Watch how the market reacts near key supports — rebounds from strong zones often give high-probability intraday setups.
---
💼 RISK MANAGEMENT TIPS FOR OPTIONS TRADERS:
Do not trade immediately after market open — the first 15 minutes are for observation, not execution.
Keep trade risk limited to 1–2% of total trading capital .
Use ATM or slightly ITM options for directional trades — they provide better delta and lower time decay impact.
Avoid trading deep OTM options unless momentum is clear — these lose value quickly.
Always place a stop-loss ; never hold losing positions hoping for reversal.
Trail your stop once the trade moves 30–40 points in your favor — protect your profits.
If the day turns range-bound or choppy, step aside. The best traders are also the best at not trading.
⚠️ Golden Reminder:
Capital preservation is your first job. Surviving to trade tomorrow is more important than winning every trade today.
---
📈 SUMMARY:
🟧 Neutral Zone: 84,600 – 84,730
🟥 Resistance Zones: 85,081 / 85,437
🟩 Support Zones: 84,231 / 83,800
⚖️ Bias: Bullish above 84,730 | Bearish below 84,231
---
📚 CONCLUSION:
Sensex sits at a crucial juncture, consolidating between 84,231 – 84,730 . A breakout above 84,730 could fuel a rally toward 85,437 , while a breakdown below 84,231 may drag the index to 83,800 .
For 17 Nov, focus on confirmation over anticipation. Let volume and price action lead your decisions. The key is to remain objective — not bullish or bearish, but responsive.
📊 Remember: You don’t need to trade every move; you need to trade the right one with discipline.
---
⚠️ DISCLAIMER:
I am not a SEBI-registered analyst . The analysis shared here is purely for educational and informational purposes . Please conduct your own research or consult a certified financial advisor before making any trading or investment decisions.

SENSEX : Trading levels and Plan for 13-Nov-2025📊 SENSEX TRADING PLAN — 13 NOV 2025
(Timeframe Reference: 15-Min Chart)
Chart Summary:
Sensex closed near 84,432 , forming a small consolidation candle just below the Opening Resistance (84,724) . The index remains within a defined No-Trade Zone (84,308 – 84,523) , indicating indecision before the next directional move. The short-term trend remains constructive, but bulls need a sustained breakout above 84,724 to regain momentum, while bears will attempt to push the index below 84,308 for downside continuation.
Key Zones to Watch:
🟩 Support Levels: 84,308 / 83,966
🟥 Resistance Levels: 84,724 / 84,874 / 85,266
⚖️ Bias Zone: 84,308 – 84,523 (No-Trade Zone)
🟢 Scenario 1: GAP-UP Opening (300+ Points)
If Sensex opens above 84,700 – 84,800 , it will start near or above the Opening Resistance . Bulls must hold this level to confirm a continuation of upward momentum.
If price sustains above 84,874 with strong bullish candles and volume expansion, upside targets open toward 85,100 – 85,266 .
However, if Sensex opens higher but fails to sustain above 84,724 – 84,874 , it may lead to profit booking and a pullback toward 84,523 – 84,308 .
Traders should wait for confirmation — avoid chasing a gap-up. Look for a breakout retest around 84,724 for safer entries.
If rejection candles appear near 85,100 – 85,266 , consider partial profit booking or trailing stops.
💡 Educational Note:
Gap-ups around resistance zones often attract excitement from retail traders but smart money waits for confirmation. Always look for candle structure and volume support. Strong breakouts hold above key levels, while fakeouts quickly revert into range-bound movement.
🟧 Scenario 2: FLAT Opening (Within 84,308 – 84,523 Zone)
A flat opening within this zone indicates indecision. The market could spend some time consolidating before deciding on direction.
Avoid trading within the No-Trade Zone (84,308 – 84,523) as volatility and fake moves are common here.
If the index breaks and sustains above 84,523 , expect bullish momentum toward 84,724 – 84,874 .
If price breaks below 84,308 , weakness could extend toward 83,966 .
Always wait for volume confirmation — sideways breakouts without participation are unreliable.
🧠 Educational Tip:
Flat openings test a trader’s discipline. The first 30 minutes usually decide the session’s direction. Instead of predicting, react to what the market shows. Staying patient during early whipsaws helps capture clean trends later in the session.
🔴 Scenario 3: GAP-DOWN Opening (300+ Points)
If Sensex opens below 84,150 – 84,000 , bearish sentiment will dominate early trade. Watch the Last Intraday Support (83,966) closely — this zone is vital for bulls to defend.
If reversal patterns like hammer or bullish engulfing appear near 83,966 , short-covering rallies toward 84,308 – 84,523 are likely.
If price fails to hold above 83,966 , weakness may extend toward 83,700 – 83,500 .
Avoid shorting immediately at the open during a deep gap-down; wait for a pullback toward resistance for better entries.
Volume near supports will reveal strength — falling volume suggests exhaustion and potential reversal setups.
📘 Educational Insight:
Gap-downs often bring panic-driven reactions. Smart traders wait for price to stabilize before acting. Watch the candle structure — strong rejection wicks at support zones often signal short-term reversals and high-probability entries.
💼 RISK MANAGEMENT TIPS FOR OPTIONS TRADERS:
Avoid trading in the first 15–20 minutes after open — IV (Implied Volatility) spikes during this time and can distort option prices.
Risk a maximum of 1–2% of total capital on any single trade.
Prefer ITM or ATM options for directional confidence; avoid far OTM options in range-bound conditions.
Trail stop-loss after every 30–40 points in your favor to lock profits.
Avoid holding naked positions near resistance or support zones before confirmation.
Always maintain a risk-reward ratio of at least 1:2 — quality over quantity wins in the long run.
📈 SUMMARY:
🟧 No-Trade Zone: 84,308 – 84,523
🟥 Resistance Zones: 84,724 / 84,874 / 85,266
🟩 Support Zones: 84,308 / 83,966
⚖️ Bias: Bullish above 84,523 | Weakness below 84,308
📚 CONCLUSION:
Sensex is trading near a decisive zone — the 84,308 – 84,523 range will dictate tomorrow’s trend. A breakout above 84,523 can trigger a move toward 84,874 – 85,266 , while a drop below 84,308 may invite selling pressure toward 83,966 .
Patience and confirmation are key — avoid trading inside the no-trade zone and wait for directional clarity. React to price, not emotion.
📊 In trading, patience and preparation are your strongest edges — execution follows clarity, not anticipation.
⚠️ DISCLAIMER:
I am not a SEBI-registered analyst . The analysis shared above is purely for educational purposes . Please do your own research or consult a certified financial advisor before making any trading or investment decisions.

SENSEX : Trading levels and Plan for 12-Nov-2025📊 SENSEX TRADING PLAN — 12 NOV 2025
(Timeframe Reference: 15-Min Chart)
Chart Summary:
Sensex is currently trading near 83,900 , just above its Opening Support / Resistance Zone (83,800 – 83,975) . The index recently recovered sharply from the lower levels but is now entering a potential inflection zone. The near-term trend remains cautiously bullish, with 84,231 acting as a key resistance and 83,343 as critical support.
The structure shows that price may continue to climb as long as it sustains above the 83,800 zone, but any rejection near 84,231 – 84,728 could trigger intraday corrections.
Key Levels to Watch:
🟩 Supports: 83,800 / 83,343
🟥 Resistances: 84,231 / 84,728
⚖️ Bias Zone: Between 83,800 – 83,975 (Opening Support / Resistance)
🟢 Scenario 1: GAP-UP Opening (300+ Points)
If Sensex opens near or above 84,150 – 84,250 , it will directly test the Last Intraday Resistance Zone . Bulls will need strong follow-through buying to hold this gap-up, otherwise a quick pullback is likely.
If the price sustains above 84,231 for 15–30 minutes with strong candle closings and volume, the upmove could extend toward 84,500 – 84,728 .
However, if Sensex opens high but fails to hold above 84,231 , it could retrace back toward 83,975 – 83,800 .
Traders should avoid jumping in immediately after a large gap-up — instead, wait for a retest of 84,150 – 84,200 as support before entering long.
If price rejects near 84,728 , consider booking profits or looking for short-term reversals.
💡 Educational Note:
Gap-up openings often create excitement, but impulsive entries can be dangerous. Always wait for confirmation — sustained price action with strong volume shows institutional activity. Without confirmation, most gap-ups end in fade-outs as early buyers take profits.
🟧 Scenario 2: FLAT Opening (Within 83,800 – 83,975 Zone)
A flat opening near this zone indicates consolidation. Early volatility may occur as both bulls and bears try to establish control. Patience and discipline are key here.
Avoid entering trades within the 83,800 – 83,975 range; this is the “neutral zone” where the direction is unclear.
If price breaks and sustains above 83,975 , it can rise toward 84,231 , and if momentum continues, 84,500+ levels.
If price slips below 83,800 , expect weakness toward 83,600 – 83,343 .
Wait for the first clear breakout candle backed by volume before entering to avoid getting trapped in early fakeouts.
🧠 Educational Tip:
Flat openings are like calm seas before a storm — the breakout direction defines the day’s opportunity. Many traders lose money by predicting moves within consolidation zones. The pros wait for confirmation, letting the market reveal its intent first.
🔴 Scenario 3: GAP-DOWN Opening (300+ Points)
If Sensex opens near 83,600 – 83,400 , the market will test the Last Intraday Support Zone (83,343) . This area is critical for bulls to defend.
If reversal patterns (hammer, bullish engulfing, or morning star) appear near 83,343 , short-covering can lift price back toward 83,800 – 83,975 .
However, if price fails to hold above 83,343 and breaks below with volume, weakness may extend toward 83,000 – 82,850 .
Avoid shorting right at the open during a gap-down — wait for a pullback toward 83,600 – 83,700 for better risk-reward entries.
Watch volume at support — declining volume during a fall signals seller exhaustion and potential reversal setups.
📘 Educational Insight:
Gap-downs often create panic. Professional traders stay calm and observe how the market behaves near major supports. If sellers fail to follow through and buyers step in, it often marks the beginning of a reversal day. Let the chart tell the story before acting.
💼 RISK MANAGEMENT TIPS FOR OPTIONS TRADERS:
Avoid trading during the first 15–20 minutes after market open — high IV (Implied Volatility) inflates option premiums and often decays fast once volatility cools.
Define your stop-loss before taking any trade — never risk more than 1–2% of total capital on a single setup.
Prefer ITM options for directional trades — they are less affected by time decay and provide cleaner movement.
Trail your stop-loss after a 30–40 point favorable move to lock in profits.
Avoid holding OTM options overnight unless you have a confirmed directional bias with volume support.
Always book partial profits when targets approach key resistance or support zones.
📈 SUMMARY:
🟧 Key Zone: 83,800 – 83,975
🟥 Resistance Levels: 84,231 / 84,728
🟩 Support Levels: 83,800 / 83,343
⚖️ Bias: Neutral-to-Bullish above 83,975 | Weakness below 83,800
📚 CONCLUSION:
Sensex is trading close to its breakout zone, and the 83,800 – 83,975 range will define tomorrow’s trend. A breakout above 83,975 can fuel a move toward 84,231 – 84,728 , while a breakdown below 83,800 may drag the index back toward 83,343 .
Patience and confirmation are the keys to trading this structure effectively. Avoid impulsive entries — let the market show its direction, then follow with discipline.
📊 Remember: The market rewards patience, not prediction. Consistent discipline beats occasional luck.
⚠️ DISCLAIMER:
I am not a SEBI-registered analyst . The views and analysis provided above are strictly for educational purposes . Please do your own research or consult a certified financial advisor before making any trading or investment decisions.

SENSEX : Trading levels and Plan for 11-Nov-2025📊 SENSEX TRADING PLAN — 11 NOV 2025
(Timeframe Reference: 15-Min Chart)
Chart Summary:
Sensex is currently trading near 83,515 , positioned between its key Opening Resistance (83,966) and Opening Support (83,343) . The market has been in a consolidation phase after recent pullbacks, and now sits at a crucial juncture where momentum could emerge in either direction.
A decisive breakout beyond these zones will likely define the intraday trend. Sustaining above 83,966 may extend the recovery toward 84,169 – 84,724 , while losing 83,343 could bring further weakness toward 82,963 .
Key Levels to Watch:
🟢 Support Zones: 83,343 / 82,963
🟥 Resistance Zones: 83,966 / 84,169 / 84,724
⚖️ Bias Zone: 83,343 – 83,966
🟢 Scenario 1: GAP-UP Opening (300+ Points)
If Sensex opens near or above 83,850 – 83,950 , it will directly approach the Opening Resistance . Bulls must sustain this gap for upward momentum to continue.
If price sustains above 83,966 with strong bullish candles and expanding volume, expect continuation toward 84,169 and then 84,724 .
However, if the index opens higher but forms rejection candles or fails to sustain above 83,966 , it may retrace toward 83,515 – 83,343 .
Ideal strategy: Wait for a breakout retest above 83,966 before taking new long entries. This minimizes risk and confirms real momentum.
Partial profit booking near 84,169 is advisable — this level has previously acted as a reversal point.
💡 Educational Note:
Gap-ups often attract emotional buying at open. True continuation comes only when price holds above resistance with volume support. The first 15–20 minutes are crucial to filter out traps — professionals wait for confirmation before entering, while retail traders often get caught in fake breakouts.
🟧 Scenario 2: FLAT Opening (Between 83,343 – 83,966)
A flat opening within this range suggests indecision. Early volatility is expected as both bulls and bears test control. Traders should avoid jumping in until the market establishes a clear direction.
Avoid trading within the 83,343 – 83,966 band initially; it’s a “No Trade Zone” until breakout confirmation occurs.
If price breaks and sustains above 83,966 , expect an upside move toward 84,169 – 84,724 .
If price slips below 83,343 , weakness may extend toward 82,963 .
Volume confirmation and candle close beyond these levels are key to filtering false breakouts.
🧠 Educational Tip:
Flat openings are designed to test patience. Avoid predicting direction — react instead. When price consolidates, it builds energy for the next big move. Traders who wait for breakout confirmation often capture the most reliable part of the trend with less stress.
🔴 Scenario 3: GAP-DOWN Opening (300+ Points)
If Sensex opens below 83,200 or closer to 83,000 , bearish sentiment will dominate early trade. Watch how the index behaves near Opening Support (83,343) and Last Intraday Support (82,963) .
If a bullish reversal candle (hammer, bullish engulfing) forms near 82,963 – 83,000 , a short-covering move toward 83,343 – 83,515 may unfold.
If the index fails to hold above 82,963 , further downside toward 82,700 – 82,500 is possible.
Avoid shorting deep gap-downs immediately — wait for a pullback toward resistance for better entries.
Monitor volume behavior — declining volume on down candles often signals exhaustion and potential reversals.
📘 Educational Insight:
Gap-downs tend to trigger fear and panic selling among retail traders. However, professional traders observe reactions near key supports — if selling pressure fails to continue, reversals often follow. Always differentiate between panic-driven moves and genuine continuation trends.
💼 RISK MANAGEMENT TIPS FOR OPTIONS TRADERS:
Avoid buying options in the first 15 minutes of trade — high Implied Volatility (IV) can make premiums expensive and erode quickly once volatility settles.
Always define your stop-loss before entering; risk a maximum of 1–2% of your total capital per trade.
Prefer ITM options for directional bias to minimize time decay. Avoid far OTM options on range-bound days.
Trail stop-loss once you get 100+ points in your favor on the index to protect profits.
Stay objective — missing a trade is far better than forcing one and losing capital.
Review trades after the session to refine discipline and execution.
📈 SUMMARY:
🟧 Range to Watch: 83,343 – 83,966
🟥 Resistance Levels: 84,169 / 84,724
🟩 Support Levels: 83,343 / 82,963
⚖️ Bias: Bullish above 83,966 | Weakness below 83,343
📚 CONCLUSION:
Sensex is trading at a decision point where a breakout above 83,966 can reignite bullish momentum, while a breakdown below 83,343 may invite fresh weakness. Patience during the initial volatility will be crucial to avoid false triggers.
A disciplined trader will wait for confirmation rather than prediction — the market rewards clarity, not haste.
📊 The key to consistent profitability is not catching every move, but catching the right one with controlled risk.
⚠️ DISCLAIMER:
I am not a SEBI-registered analyst . The above analysis is for educational and informational purposes only . Please do your own research or consult a certified financial advisor before making any trading or investment decisions.

SENSEX : Trading levels and Plan for 10-Nov-2025📊 SENSEX TRADING PLAN — 10 NOV 2025
(Timeframe Reference: 15-Min Chart)
Chart Summary:
Sensex is currently trading around 83,254 , sitting right below its key No-Trade Zone (83,223 – 83,596) . This region indicates market indecision and is often characterized by choppy movement and false breakouts. A clean directional move is expected only after a breakout from this band.
The broader structure suggests that bulls need to reclaim levels above 83,600 to regain momentum, while bears will attempt to push prices below 83,200 to reassert control. A volatile session can be expected due to global cues and the pre-weekend sentiment.
Key Zones to Watch:
🟢 Supports: 83,223 / 82,816 / 82,141
🟥 Resistances: 83,596 / 84,178
⚠️ No-Trade Zone: 83,223 – 83,596
🟢 Scenario 1: GAP-UP Opening (300+ Points)
If Sensex opens near or above 83,750 – 83,900 , it will be opening directly into the Opening Resistance Zone . Bulls must sustain the higher levels to build continuation momentum.
If price sustains above 83,596 with strong green candles and volume confirmation, upside targets open toward 84,000 – 84,178 .
However, if the price fails to hold above 83,750 and shows rejection candles near resistance, a retracement toward 83,450 – 83,300 is likely.
Avoid chasing the first breakout — wait for a retest of 83,596 to confirm support before taking fresh long entries.
Traders looking for quick moves can book partial profits near 84,178 as it coincides with the previous day’s high and potential profit-taking zone.
💡 Educational Note:
Gap-up openings tend to create emotional excitement — traders often buy without confirmation. True bullish strength is only validated when price sustains above resistance with volume. Patience for confirmation separates professional traders from impulsive ones.
🟧 Scenario 2: FLAT Opening (Within 83,223 – 83,596)
A flat opening within this No-Trade Zone indicates indecision. Price may whipsaw both sides before selecting a direction, making this zone dangerous for early entries.
Avoid trading within 83,223 – 83,596 until a clear breakout occurs on either side.
If price breaks above 83,596 decisively with volume, expect momentum toward 84,000 – 84,178 .
If price slips below 83,223 , a downward move toward 82,816 and possibly 82,141 may follow.
Breakout traders should wait for at least one retest and confirmation candle before entering.
🧠 Educational Tip:
Flat openings often test patience and discipline. The first breakout from such a tight zone can be a fake-out, followed by a reversal. Always wait for confirmation and volume alignment before committing to a position. Remember: anticipation is risk, confirmation is confidence .
🔴 Scenario 3: GAP-DOWN Opening (300+ Points)
If Sensex opens below 82,900 – 82,800 , it will trigger caution as the market enters a weak zone closer to Last Intraday Support (82,816) .
If a reversal pattern (hammer, bullish engulfing, or double bottom) appears near 82,816 – 82,141 , short-covering could lift prices back toward 83,200 – 83,400 .
However, if price fails to hold above 82,816 after the initial pullback, expect continued weakness toward 82,400 – 82,141 .
Avoid shorting immediately at the open — let the market stabilize and confirm the direction before taking positions.
A gap-down near major support zones can often lead to short squeezes if bears fail to sustain momentum.
📘 Educational Insight:
Gap-downs are fueled by emotion and overnight panic. The best traders wait for base formation and reversal signals before entering. Watch for declining volume during selloffs — it’s a classic indicator that selling pressure is losing steam.
💼 RISK MANAGEMENT TIPS FOR OPTIONS TRADERS:
Avoid trading options in the first 15–20 minutes — inflated IV (Implied Volatility) can lead to fast premium decay once volatility cools.
Define your stop-loss before entering; risk no more than 1–2% of total capital per trade .
Use ITM options for directional bias and avoid far OTM strikes unless expecting sharp breakouts.
Trail your stop-loss after every 150–200 point favorable move in the index.
Always exit positions before major news events or data releases to avoid unpredictable IV spikes.
Most importantly — never let a profitable trade turn into a losing one. Book partial profits regularly.
📈 SUMMARY:
🟧 No-Trade Zone: 83,223 – 83,596
🟥 Resistance Levels: 83,596 / 84,178
🟩 Support Levels: 83,223 / 82,816 / 82,141
⚖️ Bias: Neutral-to-Bullish above 83,596 | Weakness below 83,223
📚 CONCLUSION:
Sensex stands at a pivotal range between 83,223 – 83,596 . This zone acts as a decision point where the next directional trend will emerge. Sustaining above 83,596 can trigger a bullish breakout toward 84,000+ , while slipping below 83,223 can shift control back to bears with potential declines toward 82,816 – 82,141 .
Tomorrow’s strategy should prioritize patience over prediction. Let price confirm its direction and avoid overtrading within the choppy range.
📊 In trading, patience pays more than prediction — clarity always beats speed.
⚠️ DISCLAIMER:
I am not a SEBI-registered analyst . The views and levels shared above are for educational purposes only . Please do your own analysis or consult a certified financial advisor before making any trading or investment decisions.

SENSEX INDEX INTRADAY LEVELS ( EDUCATIONAL PURPOSE) 11/07/2025📉 Sensex Intraday Trade Plan – 11 July (Friday)
🕒 Chart: 5-min/15-min | Trading TF: 1-minute
🔽 Market Context:
Strong downward momentum from 83,800 zone
Lower highs forming; near 83,150 support
Today’s opening crucial — at support or breaking it
🔼 GAP-UP Opening (Above 83,200)
✅ BUY on breakout above 83,220 with volume
🎯 Target 1: 83,280
🎯 Target 2: 83,330
🛑 Stop Loss: 83,180
🔎 Confirmation: Bullish 1-min candle + Volume spike
🔽 GAP-DOWN Opening (Below 83,100)
✅ SELL below 83,080 on breakdown
🎯 Target 1: 83,020
🎯 Target 2: 82,960
🛑 Stop Loss: 83,130
🔎 Don’t short on the first red candle — wait for pullback
🔁 Flat Opening (Between 83,120 – 83,180)
🔄 Range-Bound Strategy
🔁 Buy near 83,120 (Support zone)
🎯 Target: 83,170
🛑 SL: 83,100
🔁 Sell near 83,180–83,200 (Resistance zone)
🎯 Target: 83,130
🛑 SL: 83,230
⚠️ 1-Min Trading Tips
⏱️ Wait for first 5-minute confirmation candle
🔊 Focus on volume near key levels
🚫 Avoid mid-range entries
🔄 Stick to 1:2 Risk:Reward

Bajaj Finance Ltd. (BAJFINANCE) Stock Analysis### **Bajaj Finance Ltd. (BAJFINANCE) Stock Analysis**
---
#### **Fundamental Analysis:**
- **Company Overview:**
Bajaj Finance is one of India’s largest non-banking financial companies (NBFCs), offering a wide range of financial products including consumer loans, personal loans, home loans, and investment solutions. The company has grown rapidly over the years, driven by its diversified portfolio and a strong presence in the Indian market.
- **Revenue & Profit Growth:**
- Bajaj Finance has shown robust growth in both revenue and profits. For Q3 FY2025, the company reported a 30% year-on-year increase in profit, totaling ₹2,370 crore.
- The company’s assets under management (AUM) grew significantly, and its focus on customer-centric financial products has made it one of the most valuable NBFCs in India.
- **Valuation (as of Feb 2025):**
- **P/E Ratio:** 38.5 (higher than the industry average, reflecting strong growth prospects)
- **Price-to-Book Ratio:** 7.9 (indicating premium valuation due to consistent growth)
- **Dividend Yield:** 0.1% (the company focuses on reinvesting profits for growth rather than distributing high dividends)
- **Key Ratios:**
- **Return on Equity (ROE):** 22.4% (indicating efficient management of equity capital)
- **Return on Assets (ROA):** 3.3% (strong, indicating effective use of assets to generate profit)
- **Debt-to-Equity Ratio:** 4.4 (high leverage, typical of NBFCs, but manageable given the company's growth track record)
- **Outlook:**
Bajaj Finance has a strong business model, robust capital adequacy, and a diverse product offering. The company's growth is supported by a high customer base and its ability to adapt to market needs with innovative financial products. While its valuation appears expensive, this is justified by its high growth rate and market dominance in the retail finance space.
---
#### **Technical Analysis:**
- **Current Price:** ₹7,950 (as of February 2025)
- **Chart Overview:**
Bajaj Finance has been on a strong uptrend over the last few years, with minor corrections. It recently faced resistance near ₹8,200 but has consistently bounced back after testing key support zones.
- **Support and Resistance Levels:**
- **Immediate Support:** ₹7,650 (a key level where buying interest has historically emerged)
- **Next Major Support:** ₹7,400 (provides strong long-term support, as seen during past corrections)
- **Immediate Resistance:** ₹8,200 (strong resistance level, a breakout above this could trigger a new bullish phase)
- **Next Major Resistance:** ₹8,500 (if the stock surpasses ₹8,200, the next major target would be ₹8,500)
- **Moving Averages:**
- **50-Day Moving Average (50-DMA):** ₹7,850 (indicating neutral to bullish sentiment)
- **200-Day Moving Average (200-DMA):** ₹6,700 (providing strong support in case of larger corrections)
- **Relative Strength Index (RSI):**
- RSI is currently at 68, suggesting the stock is approaching overbought territory. A slight pullback or consolidation may occur before a further rise.
- **MACD:**
- The MACD indicates a bullish crossover, suggesting that the stock could maintain upward momentum, though caution is warranted given the overbought RSI.
---
#### **Key Metrics:**
- **Market Capitalization:** ₹4.7 lakh crore (approx.)
- **52-Week High:** ₹8,292
- **52-Week Low:** ₹5,400
---
#### **Risk Considerations:**
- **High Valuation:** Bajaj Finance's P/E ratio is higher than industry peers, which means the stock is trading at a premium. If growth slows down, the stock may face price corrections.
- **Credit Risk:** As an NBFC, Bajaj Finance is exposed to the risk of loan defaults, particularly if economic conditions worsen or if there is a spike in non-performing assets (NPAs).
- **Regulatory Risks:** The financial sector is highly regulated, and changes in policy or regulations could impact profitability.
- **Macroeconomic Factors:** Rising interest rates, inflationary pressures, or slowdowns in economic growth could dampen consumer demand for loans and credit.
---
### **Conclusion:**
Bajaj Finance continues to be a leader in the NBFC sector with a strong track record of growth and profitability. The stock is currently trading at a premium due to its consistent performance, but potential investors should be cautious given its high valuation. Technically, the stock is in an uptrend, with key support at ₹7,650 and resistance near ₹8,200. A breakout above ₹8,200 could signal further upside, but given the high RSI, there may be short-term consolidation or pullbacks.
---
**Disclaimer:** This analysis is based on publicly available information, and I am not a SEBI-registered advisor. Please conduct your own research and consult a certified financial advisor before making any investment decisions. This is for informational purposes only and should not be considered as financial advice.

what is macd and how it can be used for trading ?### **What is MACD?**
The **MACD (Moving Average Convergence Divergence)** is a popular **trend-following momentum indicator** used in technical analysis. It helps traders identify potential **buy** and **sell** signals, as well as the strength and direction of a market trend. The MACD is used to measure the relationship between two **moving averages** of a security’s price, typically the **12-day** and **26-day Exponential Moving Averages (EMAs)**.
### **How is MACD Calculated?**
MACD is the difference between two EMAs:
1. **Fast (short-term) EMA**: 12-day EMA
2. **Slow (long-term) EMA**: 26-day EMA
The MACD line is calculated as:
\
Additionally, there is the **Signal Line**, which is a 9-day EMA of the MACD line. The Signal Line is used to generate **buy** and **sell** signals when it crosses the MACD line.
### **Components of MACD:**
1. **MACD Line**: The difference between the 12-day EMA and the 26-day EMA.
2. **Signal Line**: A 9-day EMA of the MACD line.
3. **Histogram**: The difference between the MACD line and the Signal Line. The histogram helps visualize the distance between these two lines and is an indication of the strength of the trend. It’s positive when the MACD line is above the Signal Line, and negative when the MACD line is below the Signal Line.
---
### **How to Use MACD for Trading:**
MACD is typically used in trading to identify trend changes, momentum shifts, and **buy** or **sell** signals based on the interaction of the MACD line, the Signal Line, and the Histogram.
#### 1. **MACD Crossovers:**
- **Bullish Crossover**: When the **MACD line** crosses **above** the **Signal Line**, it’s considered a **buy signal**.
- **Bearish Crossover**: When the **MACD line** crosses **below** the **Signal Line**, it’s considered a **sell signal**.
**Example**:
- If the **MACD line** crosses above the **Signal Line**, this suggests that the price momentum is shifting upward, and a trader might consider buying.
- If the **MACD line** crosses below the **Signal Line**, this suggests that the price momentum is turning downward, and a trader might consider selling.
#### 2. **Divergence and Convergence**:
- **Bullish Divergence**: Occurs when the **price** makes lower lows, but the **MACD** forms higher lows. This suggests weakening downward momentum and could indicate a potential reversal to the upside.
- **Bearish Divergence**: Occurs when the **price** makes higher highs, but the **MACD** forms lower highs. This suggests weakening upward momentum and could indicate a potential reversal to the downside.
**Example**:
- **Bullish Divergence**: If the price makes lower lows while the MACD forms higher lows, it could signal that selling pressure is weakening and a potential price reversal upward is likely.
- **Bearish Divergence**: If the price makes higher highs but the MACD makes lower highs, it could signal that buying pressure is weakening and a potential price reversal downward is likely.
#### 3. **Zero Line Crossovers**:
- The **MACD line** crossing above the **zero line** indicates **bullish momentum**, while the **MACD line** crossing below the **zero line** indicates **bearish momentum**.
- The zero line represents the point where the fast EMA (12-day) is equal to the slow EMA (26-day). A crossover above zero indicates a trend reversal to the upside, and a crossover below zero suggests a trend reversal to the downside.
**Example**:
- A **MACD line crossing above zero** could be seen as a sign of potential **bullishness**, signaling the start of an uptrend or a continuation of an existing uptrend.
- A **MACD line crossing below zero** could indicate **bearishness**, suggesting the start of a downtrend or the continuation of an existing downtrend.
#### 4. **Histogram Analysis**:
- The **MACD histogram** represents the difference between the MACD line and the Signal Line.
- A growing **positive histogram** (bars above zero) means that the MACD line is farther above the Signal Line, indicating increasing bullish momentum.
- A growing **negative histogram** (bars below zero) means that the MACD line is farther below the Signal Line, indicating increasing bearish momentum.
- A shrinking histogram (bars getting smaller) can suggest that the current trend is weakening.
**Example**:
- When the **histogram** turns from **negative to positive**, it could indicate that the trend is shifting from bearish to bullish, which might be a good time to buy.
- When the **histogram** turns from **positive to negative**, it could signal that the trend is shifting from bullish to bearish, which might be a good time to sell.
---
### **Using MACD for Trading: Step-by-Step**
1. **Identify the Trend**:
- First, determine whether the market is in a **bullish** or **bearish** trend. You can do this by looking at the overall position of the price relative to a long-term moving average (e.g., 200-day moving average) or analyzing the MACD histogram.
2. **Wait for MACD Crossovers**:
- Look for **bullish crossovers** (MACD crossing above the Signal Line) for buying opportunities and **bearish crossovers** (MACD crossing below the Signal Line) for selling opportunities.
3. **Look for Divergence**:
- Check for **bullish divergence** when the price makes lower lows but the MACD makes higher lows, suggesting a potential reversal to the upside.
- Look for **bearish divergence** when the price makes higher highs but the MACD makes lower highs, suggesting a potential reversal to the downside.
4. **Monitor the Histogram**:
- Watch for changes in the **histogram** to confirm the strength of the current trend.
- **Positive histogram growth** confirms increasing bullish momentum.
- **Negative histogram growth** confirms increasing bearish momentum.
5. **Risk Management**:
- Always use **stop-loss orders** to limit potential losses. For example, place a stop-loss just below the most recent swing low when buying or above the most recent swing high when selling.
- Use **take-profit orders** at key support or resistance levels, or when the MACD shows signs of reversal (e.g., when the histogram shrinks or the MACD crosses the Signal Line in the opposite direction).
---
### **Example of MACD in Action:**
#### **Bullish Scenario**:
1. The price is in an uptrend, and the **MACD line** crosses above the **Signal Line**, signaling a buy.
2. The **histogram** is growing, indicating increasing bullish momentum.
3. You enter a **long position** when the MACD crosses above the Signal Line and set a stop-loss below the most recent support level.
#### **Bearish Scenario**:
1. The price is in a downtrend, and the **MACD line** crosses below the **Signal Line**, signaling a sell.
2. The **histogram** is negative, confirming the bearish momentum.
3. You enter a **short position** when the MACD crosses below the Signal Line and set a stop-loss above the most recent resistance level.
---
### **Limitations of MACD:**
- **Lagging Indicator**: Like most moving averages, the MACD is a lagging indicator, meaning it reacts to price changes, not anticipates them. This means that signals may come after the move has already started.
- **False Signals**: In choppy or sideways markets, MACD can give **false signals** (i.e., crossovers and divergences that don’t lead to trend reversals).
- **Divergence May Not Always Lead to Reversal**: Just because there is **divergence**, it doesn’t always guarantee that a reversal will happen. Divergence is an indication of weakening momentum, but not all divergences lead to an actual price reversal.
---
### **Conclusion**
The **MACD (Moving Average Convergence Divergence)** is a powerful tool for identifying trends and momentum shifts in the market. It provides several actionable signals:
- **MACD Line Crossovers** for buy and sell signals.
- **Divergence** to spot weakening trends and potential reversals.
- **Zero Line Crossovers** to measure momentum strength.
- **Histogram Analysis** to gauge trend strength.
By combining MACD with other technical indicators, chart patterns, and risk management techniques, traders can enhance their ability to make informed, profitable trading decisions. However, like all technical indicators, MACD should be used in conjunction with other analysis tools to increase the reliability of trade setups and minimize false signals.

15th Dec ’23 - 273pts massive upmove, Nifty50 hits new ATH 21492Nifty Analysis
Recap from yesterday: “Nifty has shown it is stronger than thought by bouncing off the channel’s upper boundary. For tomorrow, my stance is revised to bullish. Since we are at ATH, I do not have an upper target, but my support level will be 21037.”
4mts chart link - click here
Results continue to amaze and amuse me. Never have I been rewarded so beautifully for the technical analysis. I strongly do not think it's because my analysis is getting better, but Nifty50 is becoming more predictable.
Even if you bought this morning right at the gap up of 21298, you would have made another 158-point gain. Nifty’s new ATH is 21492.3. Normally Gap-ups are either held or sold into, and when it rallies after the gap - it shows a fundamental shift in sentiment. Frankly, I am curious to know - who is buying at these levels, or is it just FOMO?
I played the Sensex expiry trades today, the PUT option I sold went up another 84% despite the strike moving up. Usually Puts appreciate when the market falls, but in my case, the spike came when the market was surging. I guess it had to do with the liquidity & new credit spreads getting written. Anyway, it was a treat to watch.
63mts chart link - click here
Nifty has formed a new island at a gap-up showing breakout momentum. My stance continues to be bullish with the first support level revised to 21341. All we can do now is trail the stop loss and let the winners run. I stopped trading today at 15.00 when Nifty crossed 20400, would you believe we even went up another 92pts before settling at 21456. The reason I pulled out early was because of the unreal speculation & euphoria. The PUT options were looking pretty seducing to short, but I decided to pass. Good to go into a 2 day holiday due to the weekend and reclaim some sanity. Talk to you guys on Monday.

MMTC - Bullish WW PatternBullish Wolfe Wave Pattern in weekly chart
Time Frame - Weekly
Double bottom near 26.50 levels
Invalid below 26
Buy Right, Sit Tight

Sensex Expiry special Analysis || Hero Zero Trading DayGood Morning Everyone,
Guy's we have seen consolidation in entire day, Earlier i was thinking Nifty will break above 19450 levels and sustains, but nifty did not worked accordingly, and Sensex also closed 140 points down. If i talk about today's Global market view, then seems pressure in market, all global market is showing mix to negative cues. Our Gift Nifty is also ready to open on Gap Down. Let's see we will work according to levels. Today is sensex expiry day of sensex.
Important Levels for Sensex:-
Intraday Support zone 64400
Intraday Resistance zone 65000
Buy above 64994, if levels sustains at least for 30 Mints.
Targets we can see in upside 65126/65311
Keep stop loss at 64730
Sale below 64730, if levels sustains at least for 30 Mints.
Targets we can see in downside 64552/64334
Keep stop loss at 64994
Note:- Hero Zero Trade will be in 2nd half somewhere 1:15pm. So, we will update in afternoon according to price action, so stick with us and follow us to get notity at right time. Till then enjoy but don't overtrade and Always wait for the best entry or levels to execute trades. And always follow strict stop loss to save your capital from unexpected market direction.
Disclaimer:- Please always do your own analysis or consult with your financial advisor before taking any kind of trades.
Dear traders, If you like my work then do not forget to hit like and follow me, and guy's let me know what do you think about this idea in comment box, i would be love to reply all of you guy's.
Thankyou.

DON'T MISS THIS ONE - SENSEXBearish Shark Level - 62932 - 63026
SL - 63601
Target - 61550 / 60700 / 60000
Bearish Alt Shark Level - 64217 - 64523
SL - 65300
Target - 62500 / 61500 / 60650

SENSEX expiry 14th july 2023Sensex is taking support at the trendline and getting rejection from the top trendline. If it breaks the 65456 level then we can see 65356, 65265 leves on the down side and upside then we can see one more high.
you can copy the levels from here
in.tradingview.com

SENSEX TRADING INSIDE ASCENDING CHANNELSensex is trading inside ascending channel...and now it is trying to break upwards.. price bounced off lower boundary of channel

SENSEX 16th june Expiry Sense is at major support level.
buy above 62926 target 63001, 63121
sell below 62716 target 62555,62355


it safe to invest ? this company stop traders and investors to get there shares when they are at 3 to 9nowthey are 39.
