What is Multi confluence Strategy making ?In this video I am showcasing how to create multiple confluences and decrease the no of frequency of trades you get to filter out A+ setups .
I am using charts older than 3 months to showcase the same
Setup

XAUUSD Gold Next Move In Upcoming 2 Weeks ExpectedGold is Now Moving to 5600 to 5615 Which is Retracement level of 1.618 For Golds Previous Swing Extension levels and can expect a retracement of till 5000 to 5100 Levels In Upcoming Weeks Lets See WhatS Going to Happen..........# XAUUSD .. Check My 4hr chart Frame

XAUUSD (GOLD) | BREAKOUT VS BREAKDOWN LEVEL | 29th Jan'2026XAU/USD (Gold) Outlook | 29 Jan 2026
Gold (XAU/USD) is trading near 5513, maintaining a strong bullish structure across daily, weekly, and monthly timeframes. Price is holding well above key moving averages, indicating sustained buying momentum. As long as gold stays above the 5515–5495 support zone, the upside bias remains intact with potential continuation toward 5555–5590. A decisive break below 5495 may trigger short-term corrective pressure, but the broader trend remains positive.
Breakout & Breakdown Levels
Bullish Breakout: Above 5555 | Bearish Breakdown: Below 5495
Disclaimer: This content is for educational purposes only and not financial advice. Trading involves risk; manage your position size wisely.

Bullish Reversal Setup - Simple & Practical GuideIntroduction to the Setup
In this educational post, we will discover a low-risk bullish reversal setup,
We all know that markets are dynamic & getting more and more efficient, and in such conditions, we also need to take a dynamic approach to the markets in different situations, you can't have a edge if you stick to only one setup in every market situation. For Example If you are a breakout trader then you will only look range breakouts but the current market situation is kind of end phase of A correction. So there you won't find stocks with good ranges building up for breakout At that point You either will have bad entries or either you need to wait for the range to build.
But here let's say you have another setup of reversal trading then you can find many good entries with low risk.
This setup a combination of price action and moving averages, Let's explore great setup in detail.
1. You need to identify the The trend
👉🏻Market was already in an uptrend.
👉🏻Higher highs and higher lows were present earlier.
Once you have identified a uptrend then you are ready to move to the second step.
2. Correction Phase – Healthy Pullback, Not Breakdown
👉🏻Price made a deep correction from the top.
👉🏻This correction came into the EMA support area.
👉🏻No panic selling, no long red candles exploding downward.
A correction should show signs of weakness when it reaches into 3rd step.
3. The Demand Zone
👉🏻 You need to find a area on the left side of chart (in uptrend) from where Massive up move has started.
👉🏻 On the chart you will find we have marked a rectangle box in blue color starting from the previous higher area, From this point the price has good up move Hence it's a demand zone.
👉🏻 When falling price reaches this area the price should react
by giving wicks from below in a candle or the size falling candle should reduce or some indecision candle form like Doji, spinning top etc.
4. Demand Zone Marking
👉 On the higher low you area you will find range candle just before the upmove bursts so that candle is used to mark the demand zone
5.EMA + Demand Zone = Support Cluster
👉Price reacts exactly where EMA support and demand zone overlap.
👉This zone is where buyers previously stepped in.
👉Market is basically saying: “This area still matters.”
⭐️ One support is weak. Multiple supports together are strong.
6. Holding demand zone
👉🏻After touching demand, price does NOT make a lower low.
👉🏻Instead, it forms a higher low.
👉🏻This is the first real signal that sellers are losing control.
7. Entry Action
👉🏻 Usually when the price hit demand zone and it forms few bullish candles, it tries to retest the demand zone once again but this time it reverses a little above from demand zone at that time you need to act and place your buys.
8. Setting The Stoploss
👉🏻 The stop loss is below the demand zone, If the demand zone fails to hold the prize then you will get a very early exit, Usually these kind of entries have 1% to 2% of stop loss because we do not want to trade any demand zone which is bigger than 2%
9. The Reward
👉🏻 In a reversal setup you at least need to maintain 1:2 risk to reward ratio.
👉🏻 Pay attention last Higher High Zone From where this correction has started That point will be called as a supply zone and there also you will find range bar just the starting of down move so that supply zone is the maximum target that you need to aim for.
👉🏻 Make sure that the last supply zone is not too near from your entry you need to give price some room to make movements.
Practice Time - With Live Examples🗒
This is HOSE:TVS motor 1h chart and we have applied a 200 EMA.
First you will find a very good uptrend then a pullback that has stopped for the first time just above 200 EMA and then it gave a very good high making new swing high then it corrected down into the last reversal area which we have marked as a demand zone and there 200 EMA is also acting as a support so we have a very good cluster of supports there,
At that time you will strike and place your buy orders.
I hope you have a good Clarity on this Setup, simple and actionable with a good price action understanding.
Hit the Boost Button & Comment down your Doubts, Queries and ideas
Keep Learning,
Happy Trading.

This Multi time frame Trick will save you from FAKEOUTSIn this video I am showcasing a daily, weekly and monthly time frame combination - also sharing a trick which can save you a lot of money from those regular sized fakeouts .
Charts used are 3 months old in this video and video is purely educational based .

Gold Hits New Record: Should You Buy or Sell in This Hot Market?Namaste traders,
This past week, gold surprised everyone by closing strong. On Friday (19/09), it moved higher again, marking its 5th consecutive weekly gain at $3,683.24/oz, while futures touched $3,718.50/oz. This surge followed the Fed’s rate cut, which many thought would cool the yellow metal. So, is this a genuine rally or just a bull trap?
Fundamentals: Rate Cut Pushes Gold Higher
Lower interest rates reduce the cost of holding gold.
Fed’s dovish signals raised expectations for more easing.
In India, physical gold demand is at a 10-month high, while China also shows strong appetite despite higher prices.
Technical Outlook
Gold broke its downward trendline, signaling bullish continuation. Buyers are in control.
This Week’s View: Focus on buying near-term targets at $372x and $373x, but stay alert to macro news.
Trading Setups (with strict risk management):
Buy Scalp: $3671–$3669 | SL: $3666 | TP: $3674–$3694
Buy Zone: $3657–$3659 | SL: $3647 | TP: $3669–$3709
Sell Scalp: $3713–$3715 | SL: $3719 | TP: $3705–$3785
Sell Zone: $3731–$3733 | SL: $3741 | TP: $3723–$3683
Will gold shine brighter and set another all-time high? Share your view! 👇

Buy, Sell or Skip? Read Breakouts and VolumesExplore how to judge breakouts using TradingView's bar replay, leveraging 3-month-old charts and price action principles that apply from 5-min to monthly timeframes. Sharpen your technical edge—educational insights only.
Disclaimer: This content is for educational purposes and not financial advice. Always do your own research before making trading decisions.

EUR/USD Bearish Trade Idea - Detailed Analysis** IF you like my observation, please boost and follow for more content."
Timeframe: 1 Hour
Entry Price: 1.16177
Stop Loss (SL): 1.16521
Take Profit (TP): 1.15763
Market Overview:
Trend Context: The EUR/USD pair is currently in a clear downtrend as indicated by the price action making lower highs and lower lows.
Chart Setup: The chart shows a descending triangle pattern, which typically signals a continuation of the bearish trend, as the price struggles to break through the resistance at the upper boundary while consistently making lower lows.
Trade Rationale:
Descending Triangle Pattern:
The formation of a descending triangle indicates a strong bearish bias, where the sellers have been consistently defending the resistance level.
The price is making lower highs and has found support at the 1.16177 level, a key point where the downtrend has previously gained momentum.
A breakdown from this triangle often leads to a continuation of the downward movement, reinforcing the bearish outlook.
Entry Setup:
The entry point at 1.16177 is set below the support level, confirming that the price is likely to break through and continue downward.
A close below this level would provide confirmation for the short position, as the breakdown indicates further downward potential.
Stop Loss Placement:
The Stop Loss (SL) is set at 1.16521, just above the last significant swing high and the trendline of the triangle. This allows for some room in case of a false breakout while minimizing risk if the price reverses above this level.
Take Profit Target:
The Take Profit (TP) is set at 1.15763, where the previous support has been observed. This level represents a logical exit point, based on the measured move of the triangle pattern and the market's reaction at this support area.
Risk-to-Reward Ratio (RRR):
This setup offers a favorable risk-to-reward ratio, with a stop loss of approximately 45 pips and a take profit target of approximately 114 pips. This results in an RRR of about 1:2.5, which aligns with a solid risk management strategy for a favorable trade.
Technical Indicators:
Exponential Moving Averages (EMA):
The chart indicates the use of EMAs, which are still in a bearish alignment. The price is below both the 9-period and 20-period EMAs, suggesting that the overall trend is downward.
The EMA setup confirms the bearish momentum, reinforcing the rationale for the short position.

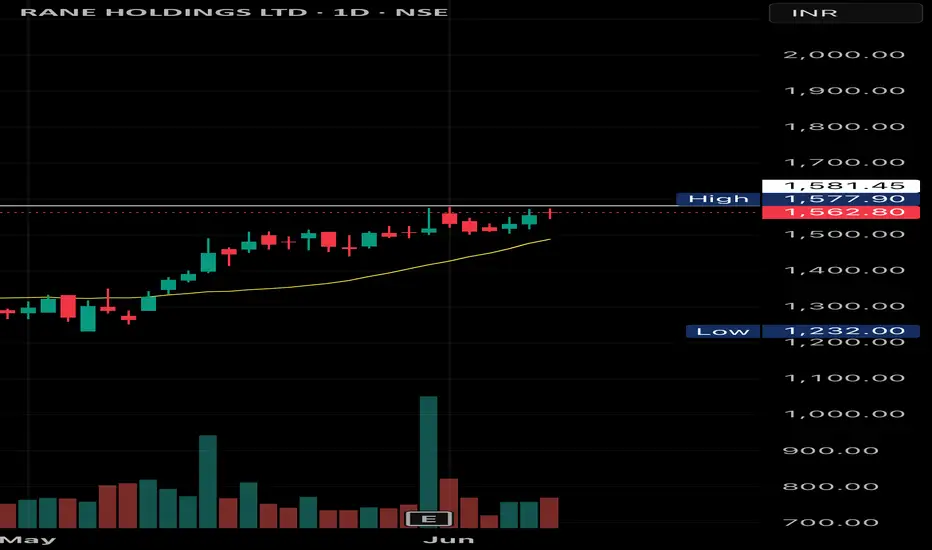
RANE HOLDING SWING TRADE SETUPRane holding swing trade setup. Breakout soon possible, can be a good breakout above 1581 and stop loss Below 1544. Analyse yourself before entry
Share your view on this
BANKNIFTYBank Nifty has taken support and shown a change of character on the daily timeframe. I’m now waiting for it to collect liquidity and retest the daily point of interest. Seeking confirmation on the one-hour timeframe would also be a prudent approach.

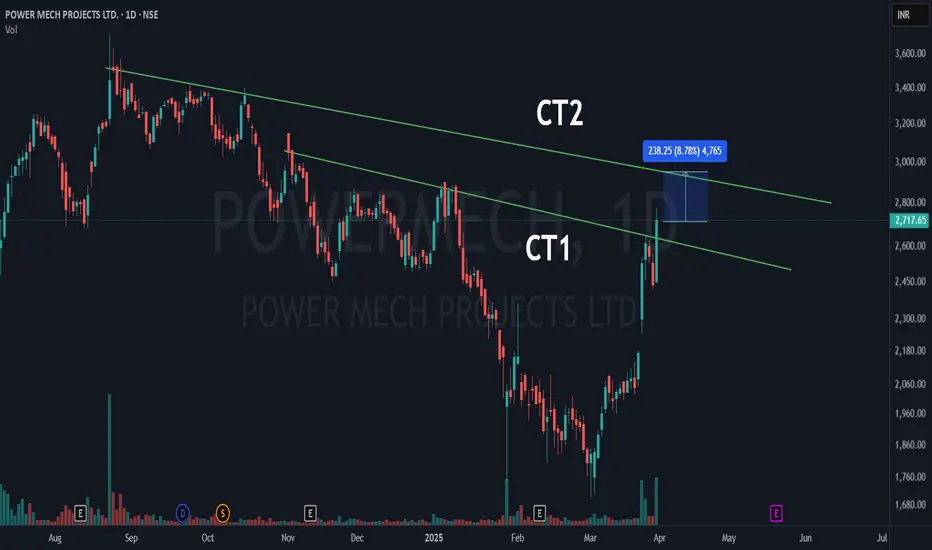
power mech projects ltd | unique DTF trade setup unfolding!📌 counter trendline 1 (ct1) – The first counter trendline (marked in green) has been successfully broken, indicating an early breakout and a shift in trend.
📌 counter trendline 2 (ct2) – The second counter trendline is the next key resistance. If the stock clears this level.
📌 two patterns in play – One pattern has already seen a breakout, while the second pattern’s resistance (ct2) still holds .
📊 volume confirmation – Increased volume supports the breakout, indicating strong participation from buyers.
Will ct2 break, or will it act as a resistance? 🤔📈
#NH - Breakout Soon Candidate / Keep in Watchlist / Feb'25📊 Script: NH
Key highlights: 💡⚡
📈 VCP Formation in Daily chart.
📈 Price gave a good up move.
📈 Went into a Side Ways consolidation for over a Nine months.
📈 Volume spike seen in past
📈 MACD Cross Over.
📈 One can go for Swing Trade.
🟢 If you have any questions regarding the setup, please feel free to leave your inquiries in the comments, and I will respond promptly.
BUY ONLY ABOVE 1415 DCB
⏱️ C.M.P 📑💰- 1357
🟢 Target 🎯🏆 – NA%
⚠️ Stoploss ☠️🚫 – NA%
⚠️ Important: Always Exit the trade before any Event.
⚠️ Important: Always maintain your Risk & Reward Ratio.
✅#Boost, #Like & #Follow to never miss a new idea! ✅
Disclaimer: I am not SEBI Registered Advisor. My posts are purely for training and educational purposes.
Eat🍜 Sleep😴 TradingView📈 Repeat 🔁
Happy learning with MMT. Cheers!🥂

XAU/USD 4H Analysis: Bullish Momentum Towards $2,780📊 XAU/USD 4H Chart Analysis – Bullish Momentum 🚀💰
📌 Key Observations:
🔹 Current Price: $2,754.16 (+0.19%)
🔹 Support Zone: $2,740 - $2,750 (Previous resistance turned support ✅)
🔹 Resistance Zone: $2,780 (Next potential target 🎯)
🔹 200 EMA: $2,687.43 (Price is above = Bullish signal 📈)
🔹 Breakout Confirmation: Price has broken past a key level and might retest before moving higher 🔄📊
📉 Potential Scenarios:
✅ Bullish Case: If price holds above $2,750, we could see a rally towards $2,780+ 🚀
❌ Bearish Case: If price drops below $2,740, we might see a correction back to $2,720 ⚠️
🔥 Conclusion:
Gold is showing strong bullish momentum and may continue its uptrend towards $2,780+ if it sustains above the breakout level! Keep an eye on support at $2,750 for confirmation. 👀💎
Tell me in Comments Would you like further indicators or a different timeframe analysis? ⏳📊

Amazing swing trading idea for 20 September markets I make educational content videos for swing / positional trading

Bajaj finserve multiyear breakoutIPO is near of a division and the parents started running.
bajaj finserve ready for a breakout. levels are similar with trendlines shown
best RR ration soon will be all time high.

3 Amazing weekly time frame ideas for 12 August markets I make educational content videos for swing / positional trading

Amazing Swing trading idea for 1 August MarketsI daily make educational content videos for swing / positional trading

Amazing Positional trade idea for 25 july markets I make educational content videos for swing / positional trading

Watch the price action like I do in 2024 I make educational content videos for swing / positional trading

2 Swing trading ideas for 22 April marketsI daily make educational content videos for swing / positional trading

BTC can be follow some short move BTC can be follow some short move
TimeFrame - 5 min
This is the Best Example of Trendline Breakdown Trades.
BTC has broken a 5 min trendline near 66338 level and is following its short momentum till,
TARGET - 64750
Which is around 1575 points from Breakdown Level

CGPOWERThere is a one more stock Which is showing a great opportunity, stock is in near resistance. what is your view please comment it down. We are NISM Certified. All views shared on this channel are my personal opinion and is shared for educational purpose and should not be considered advise of any nature. Pasted a image from my private idea because daily idea post limit is reached.

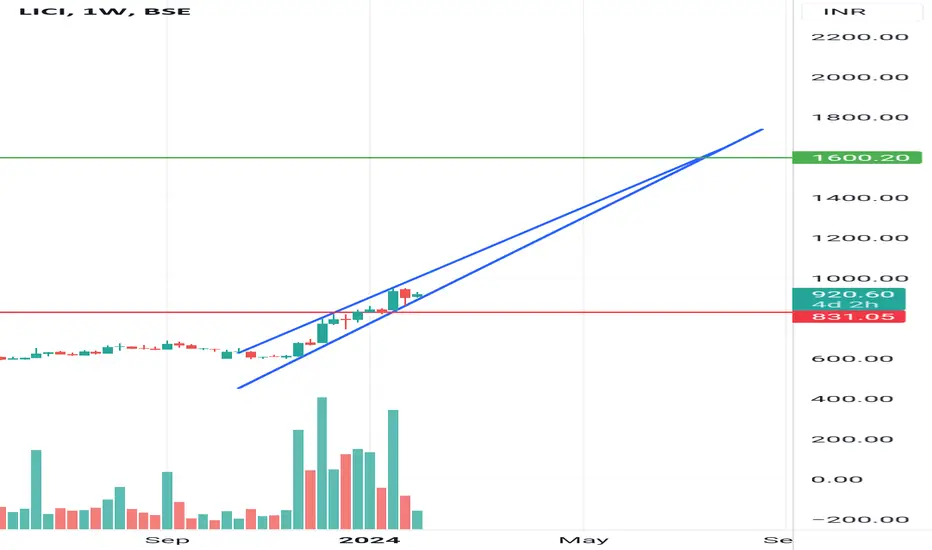
LICI Analysis After a long time, LIC has finally got good positive and a very confident results.
•CMP: 922
•Targets:
-Very Short term target: 950
- Short term target- 980
- Medium Term target 1175
-Long term Target of 1600
You shouldn't miss this Multibagger.
What do you think?