Amazing swing trading idea for 20 September markets I make educational content videos for swing / positional trading
Setup

Bajaj finserve multiyear breakoutIPO is near of a division and the parents started running.
bajaj finserve ready for a breakout. levels are similar with trendlines shown
best RR ration soon will be all time high.

3 Amazing weekly time frame ideas for 12 August markets I make educational content videos for swing / positional trading

Amazing Swing trading idea for 1 August MarketsI daily make educational content videos for swing / positional trading

Amazing Positional trade idea for 25 july markets I make educational content videos for swing / positional trading

Watch the price action like I do in 2024 I make educational content videos for swing / positional trading

2 Swing trading ideas for 22 April marketsI daily make educational content videos for swing / positional trading

BTC can be follow some short move BTC can be follow some short move
TimeFrame - 5 min
This is the Best Example of Trendline Breakdown Trades.
BTC has broken a 5 min trendline near 66338 level and is following its short momentum till,
TARGET - 64750
Which is around 1575 points from Breakdown Level

CGPOWERThere is a one more stock Which is showing a great opportunity, stock is in near resistance. what is your view please comment it down. We are NISM Certified. All views shared on this channel are my personal opinion and is shared for educational purpose and should not be considered advise of any nature. Pasted a image from my private idea because daily idea post limit is reached.

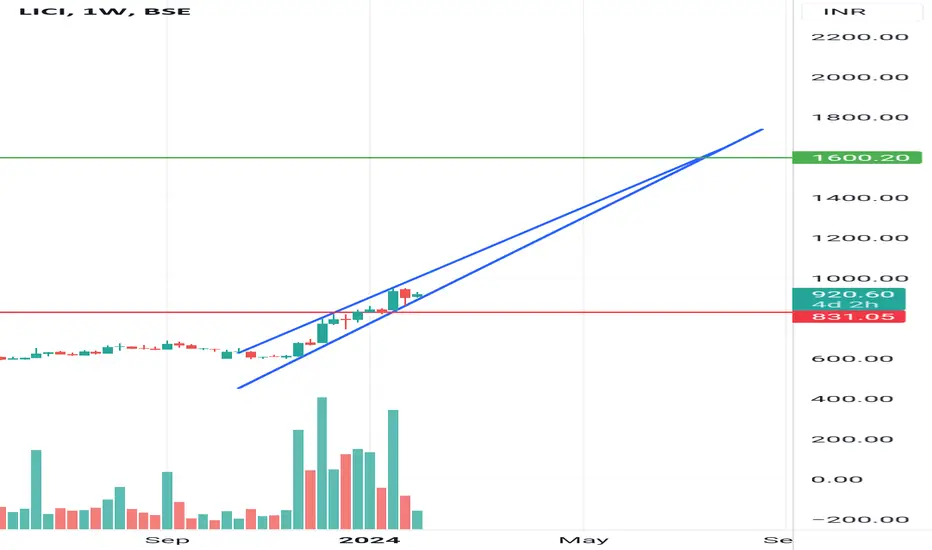
LICI Analysis After a long time, LIC has finally got good positive and a very confident results.
•CMP: 922
•Targets:
-Very Short term target: 950
- Short term target- 980
- Medium Term target 1175
-Long term Target of 1600
You shouldn't miss this Multibagger.
What do you think?
NIFTY50 LEVELS FOR TOMORROW, 14TH DECEMBER 2023.Fibonacci 0.5 zone respected.
Wait for 0.3 level sustain completely to go futher.
Gift nifty showing 150+ points
Dow Jones 400+points
Nasdaq 130+ points
Big breakout will there on 14th December. NSE:BANKNIFTY NSE:NIFTY

Nifty 50 Trading setup for todayHey Guys Nova this side,
Here is the trading setup for today, which will help you to find the S/R levels to make clear decision before jumping for the trade

CAMS - LONG ENTRYCAMS Looking very good for Swing as per my Analysis :-
Volume:
Volume is greater than previous session by 1475.32%.
Volume is greater than last 10 sessions average volume.
Volume is greater than last 10 sessions volume. That is a high volume.
Highest volume marked in last 20 sessions. That is a volume spurt.
Highest volume marked in last 50 sessions. That is unusual volume.
Highest volume marked in last 100 sessions. That is unusual volume.
Highest volume marked in last 1 year. That is huge and unusual volume.
Volatility:
ATR% of the stock is 3.14%
Average of last 20-day is 3.07%
Volatility is high.
Moving Average Observations:
Price remains above 200-day Moving average.
Price above 50-day, 100-day and 200-day Moving average.
Moving average alignment is bullish. It is an uptrend & a bullish setup.
RSI Observations:
The Daily RSI indicator has remained above 50. This is a bullish zone. Current Daily RSI reading is 68.29.
The Weekly RSI indicator has remained above 50. This is a bullish zone. Current Weekly RSI reading is 63.56.
The Monthly RSI indicator has remained above 50. This is a bullish zone. Current Monthly RSI reading is 61.21.
ADX Observations:
The Daily DMI position remains bullish.
The Daily ADX went up by 10.38%. Current ADX reading is 17.01.
The Daily distance between DMI lines is 54.87%.
The Weekly DMI position remains bullish.
The Monthly DMI position remains bullish.
Donchian Channel Observations:
Price is above middle Donchian channel (Bullish).
Price is at Upper Donchian channel band.
Upper band is rising. 20-day new high marked.
Difference between bands is 22.35%.
Ichimoku Observations:
Price above Ichimoku clouds.
Clouds are bullish.
Tenkan line went above Kinjun line in current session. Bullish crossover.
Tenkan line is above Kijun line. Ichimoku setup is bullish.
Current cloud range is 0.17% and Future cloud range is 0.22%.
Bollinger Band Observations:
Price is above middle Bollinger band (Bullish).
Price is above Upper Bollinger band.
Bands are expanding.
Difference between bands is 21.96%.
The Setup will change below 2470.

SMS PHARMA 1WThis is enter on pullback trade with my own strategy. And this is lower high so if we will be wrong there will be a small loss nut with big targets.
1st tgt 160
2nd tgt 200

3 Amazing swing trading ideas for 19 October I daily make educational content videos for swing / positional trading

Finnifty direction and levels for #October18th"Good morning, friends! As of October 18th, the global market sentiment is neutral to slightly negative, as indicated by the Dow Jones. However, our market is still within a range. It may open neutrally. If it breaks the previous day's low, the 50% Fibonacci level will act as strong support. If the market finds support there, we can expect the range market to continue its rally. However, if it breaks or consolidates, the correction will likely continue. On the other hand, if the market breaks the previous day's high, we can set our target at the next resistance level."

nifty finserviceslong only after the closing of 15 min. candle above 19920...
Educational purpose only..

05 Sep ’23 Post Mortem on FinNifty | Weekly Expiry AnalysisFinNifty Weekly Expiry Analysis
Between the last expiry and today, Finnifty has only fallen 0.21% ~ 41pts. From a headline level the fall of 1.83% ~ 365 pts and its recovery is not obvious. Moreover FinNifty has respected the support level of 19421 and is trading at a safe distance from it.
As it stands Finnifty is not showing any directional sentiment, this was the reason the options premium were very less today. In fact Nifty50 and BankNifty far OTM options had good juice today, I am assuming it would be because the liquidity was sucked out by the FinNifty expiry traders.

Caplin point Daily flag and pole B/OA bullish flag and pole b/o has been confirmed on daily chart of NSE:CAPLIPOINT . Here one can create a fresh position in the scrip. Buy@840 SL@800 TGT@880/920/960
The risk to reward ratio is 1:3
Exit the position if the stop loss is triggered on DCB.
DO YOU WANT ALL MY RESEARCH FOR FREE THEN DON'T FORGET TO FOLLOW ME.
I AM EAGERLY WAITING FOR YOUR COMMENTS ON THE STUDY...
Disclaimer: Content shared is for information and education purposes only and should not be treated as investment or trading advice. Please do your own analysis or take independent professional financial advice before making any investments based on your own personal circumstances. Investment in securities are subject to market risks, please carry out your due diligence before investing. And last but not the least, past performance is not indicative of future returns.

SBIN: Kuch Kuch hogaHi,
An inverted Head & Shoulder is visible on the daily chart of SBIN. One can look to create a fresh Position in the scrip.
One can buy the scrip at around 596-600, SL@584 and Targets are 610/620/630
The risk to reward ratio is 1:2.5
Exit the position if the stop loss is triggered on DCB.
DO YOU WANT ALL MY RESEARCH FOR FREE THEN DON'T FORGET TO FOLLOW ME.
I AM EAGERLY WAITING FOR YOUR COMMENTS ON THE STUDY...
Disclaimer: Content shared is for information and education purposes only and should not be treated as investment or trading advice. Please do your own analysis or take independent professional financial advice before making any investments based on your own personal circumstances. Investment in securities are subject to market risks, please carry out your due diligence before investing. And last but not the least, past performance is not indicative of future returns.

BANKNIFTY : (PIVOT AUCTION CHART) Hey Pivster's
NSE:BANKNIFTY having a beautiful and smooth weekly pivot auction chart where you can see the "support" (WH3-MH3 zone) turned into "resistance" alongside the Weekly Bearish GPZ setup.
A brief synopsis for BankNifty:
-> We see a gap-up opening in the month of July'2023 with the first 30m candle close above WH3 and MH3 zone.
-> After making a swing high of 45353.20 it goes to dip and retest the WH3-MH3 zone (responsive players zone) where BNF takes a clean initial support by making a swing low as 45000.25 (round number) but does not breaks 45000.
-> BNF proceeds with the strength of daily intraday pivot based initiative players and a wild move happens in 2nd trading session of the month on 4th July,2023 where the price travels upside to mark a swing high 45655.50 which basically is above the MH4-WH4 zone (initiative players zone) but crisply closes within the zone and immediately a long sellers candle can be in the following 30min candle.
-> We see a responsive ranged based move for next 2 trading sessions (Check the Mother Candle of 5th July, 2023).
-> And as much needed breakout/breakdown on the last trading session of the previous week i.e. 7th July, 2023 we get a gap down opening which takes support from the marked zone and also 2D mother candle low.
-> Comes the awaited breakdown with a clean price-action as follows-
* Breakdown of Intraday 30min ORB range
* Breakdown of WH3-MH3 zone marking a comeback of broader responsive players
* Breakdown of 2D Mother Candle range
And, as we see price now travels to the 'GAP-UP ZONE' which was created on the starting of the July month.
-> What happens today must now be very clear and fun to interpret as per the pivot auction theory which is as follow -
* Price pushed to gap up opening towards the WH3-MH3 zone which is beautifully in confluence with the 'Daily Bearish GPZ'
* As we expect the support turns resistance and we see a ORB (30min) breakdown in the second half.
I hope you enjoyed the read time for the BNF synopsis and hopefully take home a lot of things, factors and situations to your learning desk and sharp mind which is powerful enough to decode every problem.
MORAL - Stock Market is EASY, but not SIMPLE :)
If you thought this was helpful to you then share the same with your fellow traders / friends / family etc.....
Regards,
Mukkull

Bank Nifty Monday PredictionBank Nifty Monday Prediction.
Bank Nifty is on an important level of 44884, which a 38% of FIBONACCI Level
Possible next Target are 50% - 61%
50% - 44595
61% - 44345

USDCHF: Potential Sell trade near the supply area #USDCHF #ForexThe price is continuously breaking Demand Zones, which means we are in a downtrend. When the demand zones are weak, the supply zones gain strength.
Thus, Sell near the supply area. Its not a set and forget trade. Waiting for lower timeframe structure is key.
