SHAREIND (D) - Explodes 31%, Now Challenges Major ResistanceShare India Securities has shown an incredible burst of strength over the past two sessions, signaling a potential trend reversal. However, this explosive rally has now run directly into a major historical resistance level, setting up a critical test for the bulls.
The Context: A Powerful Reversal Attempt
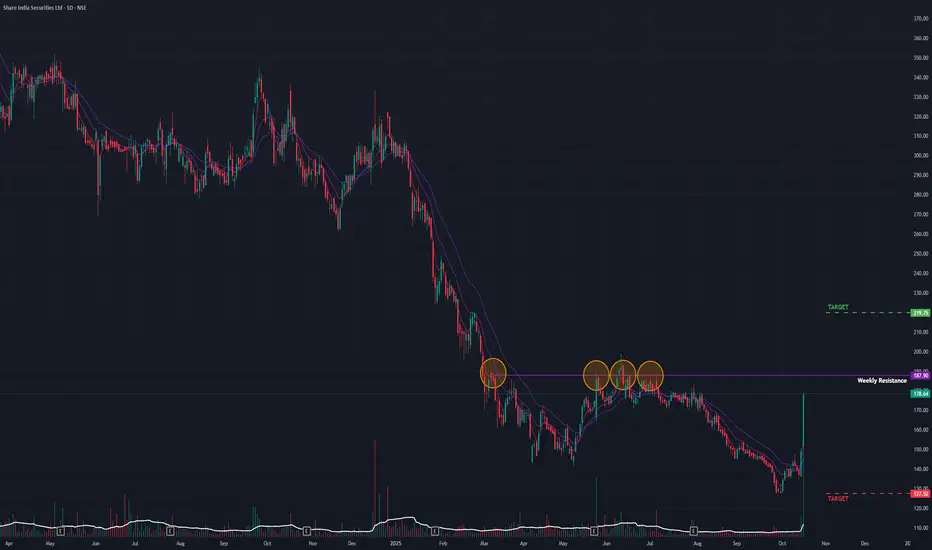
After a prolonged downtrend from its All-Time High in February 2024, the stock recently began showing signs of life by forming a series of Higher Lows . This subtle shift culminated in an explosive rally over the past two sessions:
- The stock has surged by a massive 31% in just two days.
- Today's session (Thursday, October 16, 2025) saw a gap-up opening and a +19.96% gain on huge volume of 10.5 million shares.
This powerful move has brought the price right up against a key horizontal resistance trendline — a level that has successfully rejected several rally attempts in the past, making it a significant hurdle.
A Nuanced Look at the Indicators
The technical indicators paint a picture of a new, but not yet fully confirmed, uptrend:
- Positives: The Relative Strength Index (RSI) is now rising across the Monthly, Weekly, and Daily timeframes, indicating a broad-based improvement in momentum. The short-term EMAs have also turned bullish on the Daily chart.
- Points of Caution: The short-term EMAs on the longer-term Weekly and Monthly charts have not yet registered a bullish crossover . This suggests that while the short-term trend has reversed, the long-term trend has not yet fully confirmed the move.
Outlook and Key Triggers to Watch
The immediate future of the stock depends entirely on the outcome of the battle at this key resistance.
- Bullish Breakout Scenario: A decisive close above the horizontal resistance on high volume would be a major victory for the bulls. It would confirm the trend reversal and could propel the stock towards the ₹220 level.
- Potential Rejection Scenario: If the stock is unable to breach this strong resistance, the rally may stall, leading to a pullback. In this case, the stock could retrace to the recent support level around ₹125 .
In conclusion, Share India is at a "prove it" moment. While the recent surge is incredibly powerful, it must now overcome a historically significant resistance level to prove that this is the start of a sustainable new uptrend and not just a sharp bear-market rally.
Shareindiasecurities
Share India Securities Ltd. ---- Deep AnalysisShare India Securities Ltd.
1. -----Company Technical Analysis Data
Analysis -- Based on ICT and SMC Concepts
TIME Frame -- 1 hour
Chart Elements & Observations ----
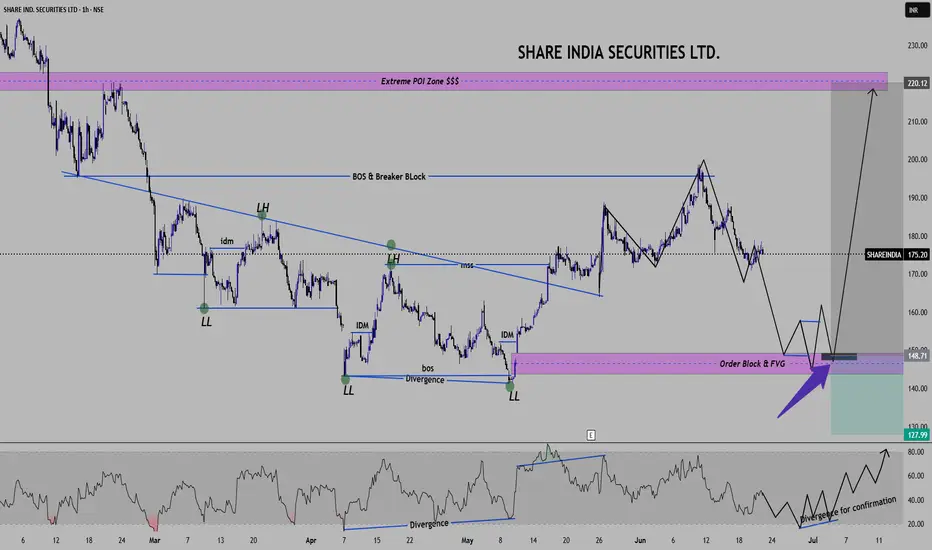
Market Structure -- 1. Clear bearish structure earlier with Lower Lows(LL) and Lower High(LH).
-- 2. Market Structure Shift (MSS) observed which indicates a possible reversal
-- 3. BOS(Break of structure) confirms shift from bearish to bullish bias.
Short Term Outlook (3-6 Weeks) ---
-- Price is currently retracing after recent high (190 levels)
-- We are projecting price to move down to the demand zone @150-160 levels followed by accumulation and reversal.
-- Short term plan is just watch price around 145-150, if price forms a liquidity sweep + Bullish structure then
this is a potential buy Zone.
-- RSI confirmation will strengthen this zone (here we will look for bullish divergence again.)
Short term trade plan -- Buy zone - 145-150 (after confirmation Liq. sweep, bullish engulfing candle and OB Tap)
Stop Loss - 135--138 (Liquidity Below demand)
Target -1 ---- 175 (Retest structure)
Target -2 ---- 190 (Recent High),
Target -3 -----220 (Extreme Liquidity Zone)
Keep note that ----- If price 148-145 demand zone fails then next Higher Time Frame demand may come near 135 levels.
All Traders and Market Influencers, Your Views or comments are most welcomed. Thank You.
==============================================================================
Stock Brokers BreakoutAngelone, shareindia securities, IIFL Sec, Icici securities, Motilal Oswal etc stocks are looking good.

Shareindia securities flag breakoutAfter technical correction after reaching target(check previous charts) and stock split shareindia reversal happening with a flag breakout. Shareindia has very good fundamentals.

ShareIndia Securities ReversalShareIndia 61.8% fib level of wave 2 to 3 held as support. Looks like wave 3 to 4 is over. Still don't see positive divergence in weekly chart. Can expect final wave to rise and reach above target levels as per chart.
