ETHUSD · 15M · SMC NarrativePrice has rallied cleanly into a premium HTF supply zone, tapping into a pool of resting buy-side liquidity above prior highs.
HTF Context
Previous range high clearly defined and respected.
Liquidity engineered above equal highs.
Current price trading in premium, far from value.
LTF Structure
Strong impulsive move up, low-quality pullbacks.
Final leg shows momentum expansion, typical of a liquidity run.
High probability this move is exit liquidity, not continuation.
Expectation
Brief push or reaction at highs to fully sweep buy-side.
Sharp bearish displacement post sweep.
Price to rotate lower toward:
Internal range low
Prior demand imbalance
HTF discount zone below
Execution Plan
No longs at these levels.
Patience for:
Liquidity sweep above highs
Bearish displacement
LTF MSS confirmation
Shorts favored after confirmation.
Scale partials at internal lows, runners into deep discount.
Shark

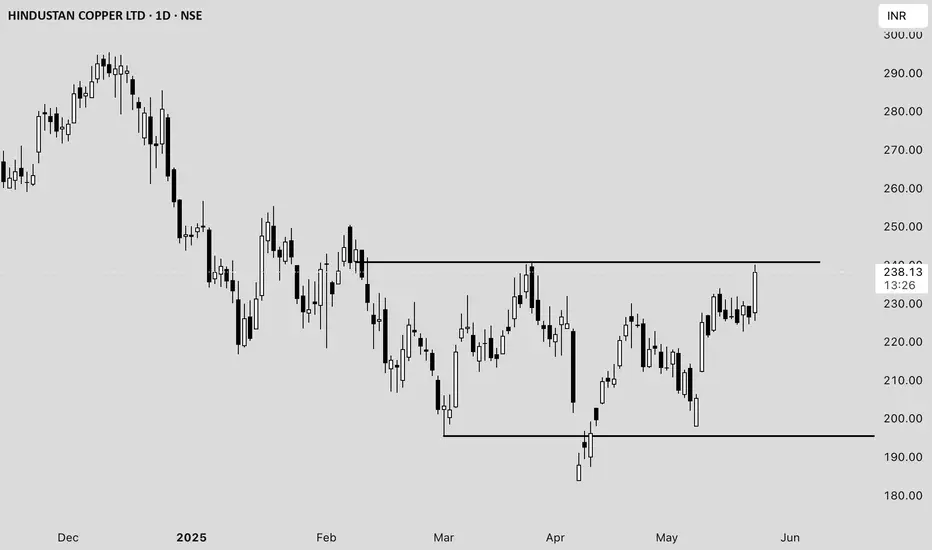
Hindustan Copper Ltd. (HINDCOPPER) Price Analysis **Date:*#### **Current Price and Intraday Movement**
- **Latest Price:** ₹237.98 (+5.09% / +₹11.52)
- **Day’s Range:** ₹225.50 – ₹240.10
- **Open:** ₹227.60
- **Previous Close:** ₹226.46
- **Volume:** 1.63 crore shares (well above average daily volume of 55.89 lakh)
#### **Technical Overview**
- **52-Week Range:** ₹183.82 – ₹381.90
- **50-Day Average:** ₹216.99
- **200-Day Average:** ₹260.58
- **Market Cap:** ₹23,013 crore
- **P/E Ratio:** 57.48
- **EPS:** ₹4.14
#### **Recent Performance and Trends**
- **Short-Term Trend:** The stock surged over 5% today, outperforming its sector and showing strong buying interest .
- **Volume Spike:** Today’s volume is nearly triple the average, indicating heightened trader participation .
- **Technical Position:** The stock is trading above its 50-day moving average but remains below the 200-day average, suggesting a recovery from recent lows but still under medium-term resistance .
- **Support/Resistance:** Immediate resistance is near ₹240–₹249 (upper circuit), with support at ₹225 and ₹216 (50-DMA) .
#### **Fundamental Snapshot**
- **Valuation:** High P/E ratio (57.48) signals expensive valuation relative to earnings .
- **Profitability:** EPS at ₹4.14; profit margins have been under pressure.
- **Industry Position:** Hindustan Copper is India’s primary copper producer, with exposure to global copper price trends and domestic infrastructure demand.
#### **Outlook**
- **Short-Term:** Strong momentum and volume could drive further upside if it breaks above ₹240, but overbought conditions may trigger profit booking near resistance.
- **Medium-Term:** Needs to sustain above the 200-DMA (~₹260) for a confirmed trend reversal.
- **Risks:** High valuation and recent volatility; global commodity price swings can impact earnings.
---
**Summary:**
Hindustan Copper is showing robust short-term momentum with strong volume and price gains, but faces resistance near ₹240–₹249. The stock remains fundamentally expensive, and investors should watch for sustained moves above the 200-DMA for a longer-term bullish signal .
ADA longBullish shark pattern. Should see a bounce towards the 0.382-0.5-0.618 if price turns to the upside.

XAUUSD – 15M | SMC-Based Trade PlanGold is currently in a corrective phase after a strong impulsive move to the upside. Price has delivered a clear displacement, followed by a pullback into a refined demand zone, highlighted on the chart. This area aligns with prior bullish order flow and acts as a discount zone within the higher-timeframe range.
The current sell-off appears corrective, not impulsive. Expectation is for price to mitigate demand, sweep weak lows if needed, and then resume the primary bullish structure.
Execution Plan (Important):
➡ No blind entries.
➡ Entry will be taken only if LTF confirms bullish intent (CHoCH, BOS, displacement from demand).

Gold Intraday Setup (XAU/USD)Price tapped into the premium zone after a sharp impulsive leg, showing signs of exhaustion near 4139–4140 levels. Expecting a potential short-term correction as liquidity above recent highs has been swept.
Bias: Short
Entry: 4134
Stop Loss: 4140
Target: 4120
R:R: ~2:1
Watching for confirmation on lower timeframes before continuation.
#Gold #XAUUSD #PriceAction #LiquidityGrab #YCGHCapital

INTELLECT Price ActionAs of **October 24, 2025**, **Intellect Design Arena Ltd (NSE: INTELLECT)** closed at **₹997.95**, gaining around **3.6%** from the previous close of ₹963.50. The stock opened at **₹965.00**, reached a **high of ₹1,008.00**, and a **low of ₹950.50**, supported by a trading volume of about **4.01 lakh shares**.
The company’s **market capitalization** stands around **₹13,760 crore**, with an **EPS of ₹25.05** and a **P/E ratio near 39.8**, suggesting a moderate premium valuation compared to the IT sector average. The **50-day moving average** is around ₹985, and the **200-day moving average** near ₹925, indicating a continued uptrend in both short-term and medium-term momentum.
From a technical perspective, the stock shows signs of strength after recent consolidation between ₹940 and ₹995. The **RSI level at ~60** supports sustained positive momentum without nearing the overbought zone. **Immediate support** lies near ₹970–₹975, while **resistance** is placed at ₹1,010–₹1,025. If the stock sustains above ₹1,010, it could aim for the next target range of ₹1,050–₹1,080.
In the broader outlook, **Intellect Design Arena** remains fundamentally strong with consistent revenue growth in digital banking and fintech solutions. Robust margins, recurring international contracts, and growing adoption of its AI-driven platforms reinforce a bullish medium-term trend, though investors should watch for consolidation near ₹970 as a potential accumulation zone.

TATAINVEST Price ActionAs of **October 24, 2025**, **Tata Investment Corporation Ltd (NSE: TATAINVEST)** closed at **₹839.00**, marking a **1.45% gain** from the previous session’s ₹827.00. The stock traded between **₹821.00 and ₹849.00** during the session, with total trading volume around **4 million shares**. The company’s **market capitalization** stands close to **₹42,450 crore**, keeping it well within the mid-cap investment and financial services category.
The **52-week range** spans between **₹514.52 (low)** and **₹1,184.70 (high)**, indicating the stock is consolidating significantly below its yearly peak after a steep rally earlier in the year. The company currently trades at a **P/E ratio of around 130**, with an **EPS (TTM)** of **₹6.45**, suggesting an extended valuation driven by investor sentiment around Tata Group’s holding entities rather than direct earnings growth.
From a **technical viewpoint**, TATAINVEST shows stabilization above recent support zones. The **50-day moving average sits around ₹802**, and the **200-day average near ₹675**, confirming longer-term trend strength. The **RSI** remains near **58**, reflecting steady bullish momentum without entering extreme zones. Immediate **support** levels are around ₹820–₹825, while **resistance** lies near ₹850–₹860. A breakout above ₹860 could lead to the next target zone of ₹885–₹900.
In the broader context, the stock maintains a **positive medium-term outlook**, supported by strong group synergies, consistent dividend policy, and value unlocking potential within the Tata ecosystem. However, valuations remain on the higher side, and investors may expect moderate consolidation before renewed upside above ₹850.

IFBIND Price ActionAs of October 23, 2025, **IFB Industries Ltd (NSE: IFBIND)** was trading around **₹1,893**, showing a modest weekly gain of about 4% and up nearly 40% over the past three months. The stock has recently fluctuated between the **52-week high of ₹2,319.85** and **low of ₹1,060**, indicating strong recovery momentum after several quarters of underperformance.
The company’s **market capitalization** stands near **₹7,480 crore**, placing it in the small- to mid-cap category. The current **P/E ratio** ranges between **60 and 66**, while the **P/B ratio** is close to **8.9**, reflecting that the stock trades at a premium to its book value but roughly in line with other consumer durables peers like TTK Prestige and Voltas. Its **EPS (TTM)** is about **₹26.6**, with **no dividend** declared at present.
Technically, IFBIND maintains a bullish medium-term structure. It has broken out above its 200-day moving average, and the **RSI remains strong around 62–65**, suggesting continued upward momentum without being overbought. Key **support levels** are near **₹1,820–₹1,850**, and **resistance** lies around **₹1,940–₹1,960**. A breakout above ₹1,960 may propel the stock toward ₹2,050–₹2,100, while sustained trade below ₹1,820 could signal a brief pause or retracement.
Overall, the outlook for IFB Industries appears constructive, supported by solid sales growth in its home appliances and motor divisions, improving profitability, and strong cash flow metrics. Short-term consolidation aside, the medium-term bias stays positive as valuations normalize and operational growth remains consistent.

TFCILTD Price Action## TFCILTD – Price Analysis (August 2025)
### Price & Market Metrics
- **Current share price:** ₹297.75 (as of August 13, 2025; latest close).
- **Market capitalization:** Approx. ₹2,757crore.
- **52-week range:** ₹122.32 (low) – ₹303.50 (high); new high reached in early August.
- **All-time low:** ₹4.45 (Sep 2001).
- **All-time high:** ₹303.50 (July–August 2025).
- **Day’s range (Aug 13):** ₹282.60–₹303.50.
- **Volume:** 3,955,421 shares traded on Aug 13.
- **Beta:** 1.24, showing moderate volatility.
### Returns & Volatility
- 1-week gain: Around 8.25%.
- 1-month gain: Approximately 4%.
- 1-year return: Roughly 67%.
- Daily moves of 5-6%; volatility is moderate to high recently.
### Valuation
- **Price/Earnings (P/E) ratio:** 31.10–31.47 (much higher than sector average of ~11.4).
- **Price/Book (P/B) ratio:** 2.69–3.14.
- **Book Value Per Share:** ₹94.80–₹110.54.
- **Dividend yield:** About 1.01%; ex-dividend date August 14, 2025.
- **EPS (TTM):** ₹9.46–11.77.
- **Intrinsic value estimate (GF Value):** ₹152.95—current price trades at a 95% premium over this fair value estimate.
### Financial & Business Highlights
- Revenue (TTM): ₹1.58billion.
- Net profit (TTM): ₹1.09billion.
- Net profit margin: Approximately 69%.
- Debt/Equity Ratio: ~70.9% (moderate leverage).
- Gross margin: 99% (financial lending business).
### Technical & Sentiment Overview
- Stock made a new all-time high in early August.
- Trend is bullish, supported by heavy volumes.
- Dividend payout scheduled for September 20, 2025.
- Overall business cited as "average growth, high valuation" in recent analysis.
***
## Summary
TFCILTD is trading near record highs at ₹297.75, well above its estimated fair value and sector norms. The stock’s valuation metrics—particularly its P/E and P/B ratios—are elevated, reflecting strong price momentum and investor enthusiasm. Financial performance shows very high profit margins and reasonable growth, but the premium to intrinsic value signals potential overvaluation risks. Volatility and recent price swings are moderately high. Investors should weigh current optimism and momentum against valuation concerns and sector returns.

Godrej Agrovet LtdAs per harmonic patter Alt shark formed
DISCLAIMER
Information provided is for informational purposes only and should not be construed as investment advice or an offer to buy or sell securities. Investors are advised to carefully review all materials and consult with a financial advisor considering their own financial situation and risk tolerance before making investment decisions. The disclaimer also often includes statements about no guarantees or warranties regarding the accuracy, adequacy, or completeness of the information provided and emphasizes that investments can fluctuate in value and there is a risk of loss.

Fortis Healthcare’s share price analysisFortis Healthcare’s share price is currently around ₹667, reflecting strong momentum and significant outperformance over the past year, with a return of about 49%. The stock recently touched a 52-week high of ₹744.5 and a low of ₹406, indicating a broad trading range and robust investor interest
Analyst sentiment remains bullish, with most forecasts targeting a price range of ₹736 to ₹850 over the next 12 months, suggesting a potential upside of around 10–20% from current levels . Some projections are even more optimistic, with year-end 2025 targets as high as ₹933 if market conditions remain favorable . Technical indicators currently point to a bullish trend, supporting the positive outlook .
Fundamentally, Fortis Healthcare has reported strong financial results, including an 84% year-on-year jump in net profit for Q3 FY2024-25 and a 40% quarterly profit increase, underscoring operational momentum . The company trades at a price-to-earnings (PE) ratio of about 65, which is above the sector average, indicating that the stock is priced at a premium due to its growth prospects . The price-to-book (PB) ratio is 3.49, and the dividend yield is modest at 0.24% .
In summary, Fortis Healthcare is in a bullish phase, supported by strong earnings growth and positive analyst outlooks. While the stock is trading at a premium valuation, its growth trajectory and sector leadership continue to attract investor interest, with further upside likely if current trends persist

Cupid Price ActionCupid Limited’s stock is trading around ₹158 as of early August 2025, having recently hit new record highs above ₹162. The share price surged over 45% in the past month and is up more than 100% year-to-date, significantly outperforming both its FMCG peers and the broader market. Volatility is high: daily moves of 5–6% are common, and intraday swings have reached as much as 8%. The stock is trading well above all major moving averages, reflecting strong buying momentum.
Long-term performance is outstanding: over 1,300% returns in three years and more than 2,100% across ten years. That said, short-term technical signals show that Cupid is “overbought” (very high RSI) and potentially due for a corrective pullback, though robust momentum could drive further gains. The high PE ratio near 104 and price/book around 21 indicate a rich valuation versus historic averages and sector norms.
Market capitalization is about ₹4,240 crore. Despite being expensive on most valuation models, the company is seen as fundamentally strong: steady operational performance, minimal debt, and no significant pledged shares. The company’s next earnings announcement is due August 8, and recent market behavior suggests results can drive significant further volatility.
Compared to other FMCG names, Cupid’s returns are exceptionally strong while most large and mid-cap sector players (like HUL, Dabur, and Colgate) have posted declines over the past year. Liquidity has increased with heavy volume spikes during rallies, supporting the uptrend.
In summary, Cupid is a high-momentum, high-volatility small-cap outperformer exhibiting extraordinary multi-year returns. The stock trades at elevated valuations and, while short-term corrections may occur, its leadership in the sector and technical strength continue to attract aggressive buyers.

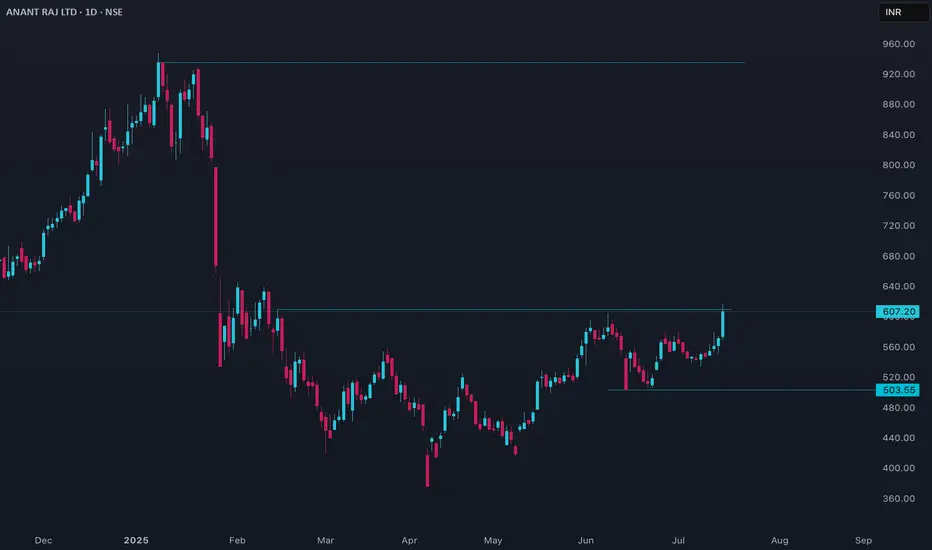
ANANTRAJ Price Action
## Current Price & Performance
- Last close was ₹607.20.
- Over the past week, the stock is up more than 10%, showing strong short-term momentum.
- Over the past year, it has gained nearly 25%, but suffered a sharp 32% drawdown over six months.
- The 52-week price ranged from ₹376.15 to ₹947.90, reflecting high volatility.
## Valuation and Metrics
- ANANTRAJ trades at a high valuation, with price-to-earnings and price-to-book ratios above typical industry averages.
- Its market capitalization puts it among the stronger players in the real estate sector.
- Key valuation multiples such as PE and EV/EBITDA are elevated, indicating investors are paying a premium for expected growth.
- The stock’s PEG ratio suggests its growth is reasonably in line with its price.
## Analyst Sentiment and Targets
- Most analysts rate the stock as a strong buy, highlighting strong upside potential with target prices higher than the current market price.
- The consensus one-year price targets suggest potential returns ranging between 24% and 49% from current levels.
## Technical & Fundamental Observations
- Compared to sector peers, its PE is lower than certain high-flyers but remains above the overall industry average, making it expensive by historical standards.
- Return on equity has hovered around 8.5% recently, with efficient operating and employee costs supporting margins.
- A modest dividend has recently been declared.
- A slight increase in promoter holding indicates management confidence.
## Risk Factors
- Substantial volatility in recent months may raise concerns for risk-averse investors.
- Both intrinsic value models and relative measures suggest the shares may be overvalued by over 20% at current prices.
- While momentum and sentiment are positive, valuation risk remains a key factor for new investors.
## Conclusion
ANANTRAJ is benefiting from strong momentum and positive sentiment, with analysts forecasting further upside. However, current valuation levels are high, and investors should carefully weigh the potential for price appreciation against the risk of overvaluation and ongoing volatility. Consider both the fundamental strengths and the elevated price multiples before making an investment decision.
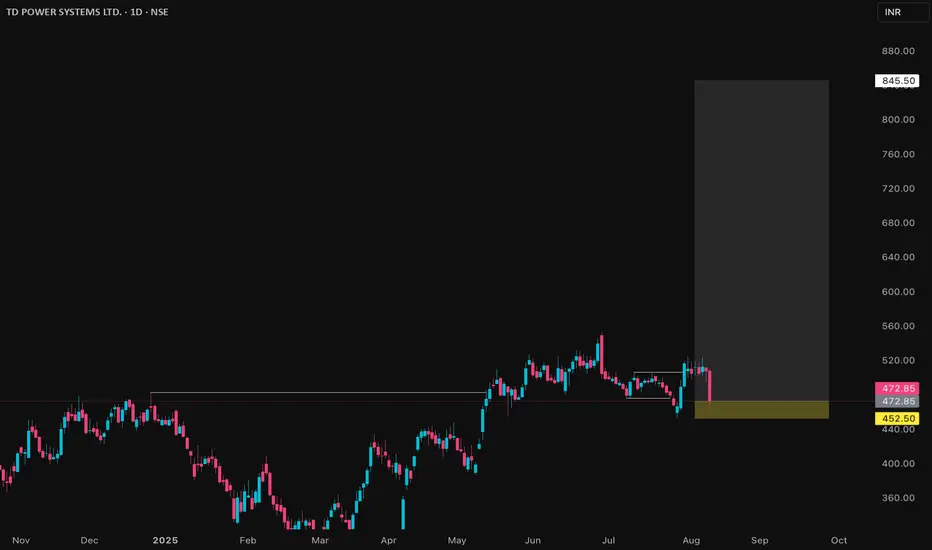
TDPOWERSYS Price Action## TDPOWERSYS Price Details (as of August 8, 2025)
### Market Metrics
- Current share price is ₹472.85.
- Market capitalization is ₹7,385crore.
- The 52-week price range is ₹293 to ₹552.75.
- Its all-time low was ₹14 in March 2020; all-time high is ₹552.75 in June 2025.
### Returns & Volatility
- 1-month return: -1.48%.
- 1-year return: about 18%-20%.
- 3-year return: over 300%.
- 5-year return: over 1,900%.
- Weekly volatility is 6%, which is above average.
- Beta is 2.04, indicating higher risk and volatility versus the overall market.
### Valuation
- Price/Earnings Ratio: 42.31, higher than sector average.
- Price/Book Ratio: 8.58, above sector average.
- Dividend yield is 0.25%.
### Company Fundamentals
- Trailing 12-month revenue: ₹13.77billion.
- Net Profit Margin: 13.75%.
- EPS: ₹12.12.
- Gross margin: 34.13%.
- Debt to equity: 1.4%, showing low leverage.
### Valuation Analysis
- Estimated intrinsic value is ₹258.02.
- Current price is about 45% over this value, meaning the stock is overvalued.
### Qualitative Notes
- Strong profitability and cash flow, but price reflects high growth expectations.
- High volatility, especially in the short term.
- Dividend policy: small but regular.
- Recent technical signals showed buy recommendations, but the stock has been correcting lately.
**Overall:** The stock is highly priced relative to its value and historical norms, with impressive growth but also increased volatility and a potential for continued price correction.
BTC/UsDT Short sideHere is a description of the downside scenario as depicted:
1. The Short Entry Point: The short trade is set up to begin at the approximate current price level, which is around $122,000 to $123,000. This suggests a trader is anticipating that the current strong bullish move has reached its peak and a reversal is imminent.
2. The Stop-Loss (Risk):
• The top boundary of the red box, which extends into the red area above the entry, represents the stop-loss level.
• This red area is relatively small compared to the profit target, suggesting a favorable Risk/Reward ratio.
• The stop-loss price appears to be around $126,864.5 (the highest point in the image is $126,864.5). If the price moves above this level, the trade would be closed for a manageable loss.
3. The Take-Profit (Reward/Target):
• The lower boundary of the red box, which extends significantly downwards, represents the take-profit or target area for the short trade.
• The profit target line appears to be around the $108,500 to $108,800 level, which is a key low from late September.
• This is where the trader would expect to close the trade for a profit if the anticipated downside move materializes.
4. The Context: The "downside chart" fundamentally represents a trade where the trader is betting on a significant price decline back toward the prior support levels after the large recent rally.
In summary, the downside chart (the red box) illustrates a hypothetical short position where a trader is risking a small amount of profit from the recent rally to potentially capture a much larger drop in price, targeting the strong support zone established just before the recent V-shaped recovery.
The term "downside chart" in this context refers to the short trade setup that has been drawn on the chart, which is visualized using the large red shaded box.
This setup represents a trader's prediction that the price of BTCUSDT will reverse and fall significantly from its current high.
Here is the breakdown of the downside trade setup:
• Entry Point (Current Price): The trade is initiated for a short position (selling) near the current market price, which is around $122,379.1. This is the belief that the recent powerful rally is exhausted and a reversal is starting.
• Stop-Loss (Risk): The area above the entry point, colored in the brighter red on the chart, represents the Stop-Loss level.
• The stop-loss price appears to be around $126,864.5 (the high shown in the top right).
• This is the level where the trade would be automatically closed to limit the loss if the price continues to rise against the short position.
• Take-Profit (Reward/Target): The large green shaded area below the entry represents the Take-Profit or profit target for the short trade.
• The target price is set significantly lower, near the prior support/lows from late September, likely around the $108,500 to $108,800 range.
• This is where the trader expects to close the short position to realize a profit.
• Risk/Reward Ratio (R:R): By comparing the distance from the entry to the stop-loss (the risk, in red) versus the distance from the entry to the take-profit (the reward, in green), the trade demonstrates a favorable Risk/Reward ratio. The reward (green box) is visually much larger than the risk (top red portion), suggesting the trader is attempting to risk a small amount to potentially gain a large profit.
In summary, the downside chart is the visual representation of a bearish trading strategy, expecting a move down from over $122k to the support area near $108k.

MEDANTA Price ActionMedanta (Global Health Ltd) is currently trading in the ₹1,300–₹1,335 range, having shown a notable run-up over the past six months, but with increased volatility in recent weeks. The stock reached a recent high near ₹1,393 and a low around ₹935 during the past year.
Fundamentally, Medanta continues to deliver robust revenue growth: annual revenues for FY25 rose to ₹3,692 crore, up approximately 13% from the previous year. Operating profitability remains strong, with margins in the 23% range and net profits exceeding ₹480 crore for the latest fiscal year. However, the most recent quarter saw a profitability dip due to a non-recurring expense, reflecting some variability in the bottom line.
On valuation, Medanta trades at a high price-to-earnings (P/E) ratio of more than 73 and a price-to-book (P/B) above 11, both of which are elevated compared to sector averages. This premium reflects market optimism about its growth prospects but also limits the scope for immediate, significant upside. The company has a modest dividend yield and consistently generates healthy cash flows, contributing to financial strength.
The outlook from analysts remains moderately positive: one-year price targets are clustered around ₹1,300–₹1,500, with the company expected to benefit from long-term sector growth and its strong operating metrics. Near-term, the share price may consolidate after recent gains, with moves likely guided by the next round of earnings and overall market sentiment. Medanta’s key strengths are scale, profitability, and discipline, but its premium valuation requires steady execution and increasing returns to justify further appreciation.

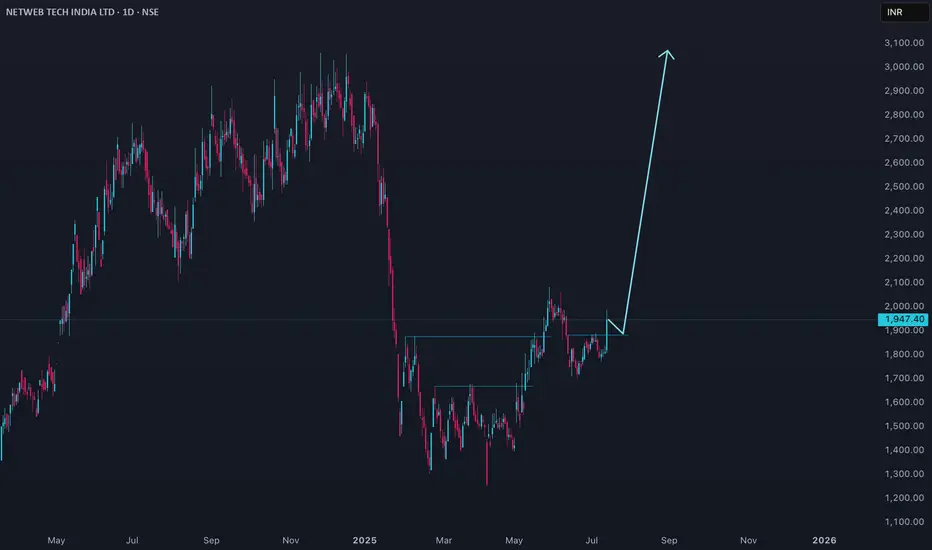
NETWEB Price actionNetweb Technologies (NETWEB) is trading at ₹1,947.40 as of July 11, 2025. The stock has shown a strong short-term recovery, up about 7.4% in the last session and nearly 6.8% over the past week, but it remains down by over 25% in the past six months. The 52-week high is ₹3,060 and the low is ₹1,251.55.
Valuation-wise, NETWEB is trading at a high price-to-earnings ratio (around 90–96) and a price-to-book ratio near 20, indicating a premium valuation. The company’s market capitalization is approximately ₹11,000 crore. Promoter holding has slightly decreased in the recent quarter.
For the near term, technical targets suggest resistance around ₹2,000–2,040 and support in the ₹1,750–1,850 range. Analyst forecasts for the next year place price targets between ₹1,824 and ₹2,805.
Fundamentally, the company is considered overvalued at current levels, despite strong recent profit growth. The stock’s premium valuation and recent volatility suggest caution for new investors, with further upside dependent on continued earnings momentum and broader market sentiment.
SYRMA Price ActionSyrma SGS Technology Ltd closed at ₹816.25 today, down 1.39% with a loss of ₹11.5 from the previous session. The stock opened at ₹834.80 and traded within a range of ₹811.95 to ₹836.95, reflecting a mildly bearish session after demand failed to sustain above recent highs. Despite the pullback, Syrma SGS remains in a firm uptrend on longer time frames, still trading well above its 50-day and 200-day averages.
The price action signals some profit booking near resistance zones close to ₹837, while immediate support now lies at ₹812 and secondary support at ₹800. With the recent rally, momentum indicators are cooling but not oversold, suggesting a potential for pause or minor consolidation before the next directional move. With a price-to-earnings ratio near 72.5, Syrma trades at a premium on growth expectations, and market cap continues to expand, standing around ₹14,544 crore.
Overall, the technical posture remains bullish in the medium term, though short-term traders should watch for stabilization near support zones and a decisive close above ₹837 for renewed upside momentum.

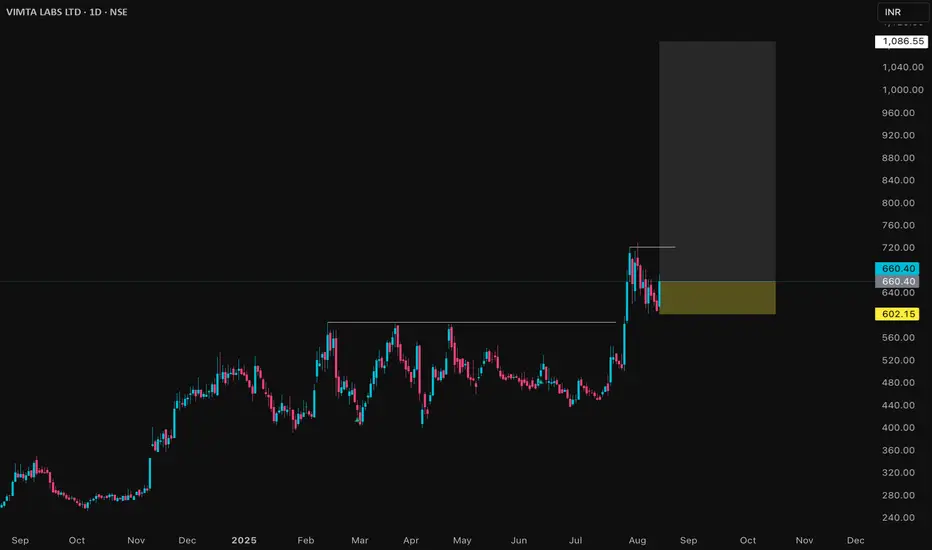
VIMTALABS Price Action## Vimta Labs Ltd – Price Analysis (August 2025)
### Price & Market Metrics
- Current share price is around ₹646–₹659 as of August 13, 2025.
- Market capitalization is approximately ₹2,900 crore.
- The 52-week price range is ₹241.30 (low) to ₹728.95 (high).
- The all-time high was ₹728.95 recorded in early August 2025.
- Recent price movement shows a strong rebound with gains around 6-7.5% over the past day.
### Returns & Volatility
- Over the last 1 year, the stock has surged by approximately 150-160%.
- The 6-month growth pace is about 14-16%.
- Weekly price moves have shown notable volatility, with recent declines around 7.5% in a short time frame.
- The stock exhibits moderate volatility consistent with strong recent price momentum.
### Valuation
- Price/Earnings (P/E) ratio is around 38.
- Price/Book (P/B) ratio is low, roughly 0.14 based on some sources, though others note around 3.6, indicating possible variation in book value interpretation.
- Dividend yield data is not prominent, indicating limited or no regular payout.
### Business & Fundamentals
- Vimta Labs is in the testing, inspection, and certification sector focused on quality control and laboratory testing services.
- The company benefits from growth in industrial and infrastructure sectors fueling demand for quality and compliance services.
- Recent market action indicates investor interest fueled by strong earnings growth expectations.
### Technical & Sentiment Overview
- The stock hit a fresh 52-week high recently but has shown some corrective pullbacks.
- Volume remains healthy reflecting active trading interest.
- The stock price is trading well above average levels, supported by positive market sentiment and sector tailwinds.
***
### Summary
Vimta Labs Ltd has exhibited a strong price rally in the past year with over 150% gains, reaching new highs in early August 2025. The current valuation by P/E stands elevated at about 38, reflecting growth optimism. The share price volatility is moderate but notable due to recent sharp moves. Market capitalization is close to ₹2,900 crore, with the stock trading near its peak levels. Investors should consider the premium valuation against ongoing growth prospects and sector dynamics, while monitoring for potential short-term price fluctuations or corrections.
Overall, Vimta Labs appears to be a growth-oriented stock with robust recent performance, but with valuation levels demanding careful risk assessment for new investors.
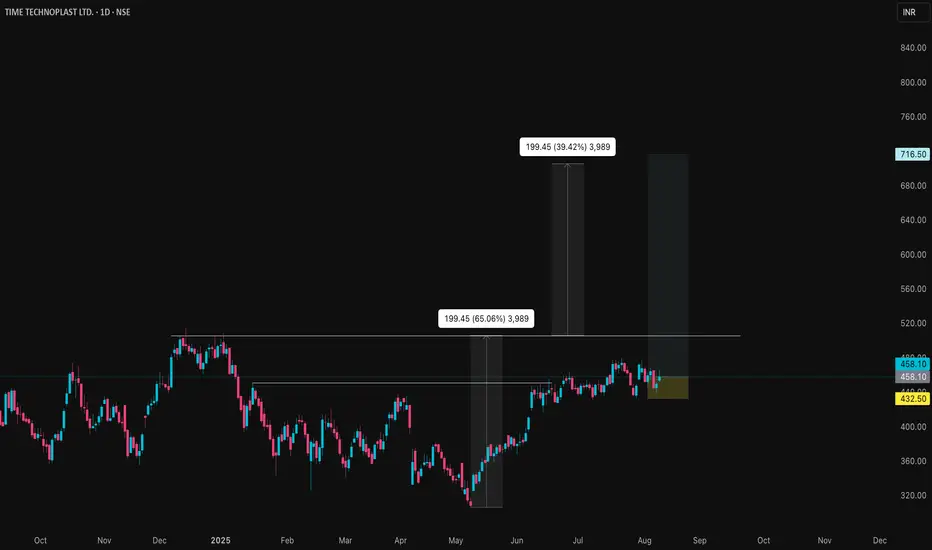
TIMETECHNO Price ction
### Market Metrics
- **Current share price:** ₹458.10.
- **Market capitalization:** ₹10,396crore.
- **52-week price range:** ₹306.60 (low) to ₹513.55 (high).
- **All-time low:** ₹17.55 (Feb 19, 2009).
- **All-time high:** ₹513.55 (Dec 13, 2024).
### Returns & Volatility
- **1-week change:** Down 1.98%.
- **1-month change:** Up 4.83%.
- **1-year return:** Up 43.18%.
- **Recent volatility:** Daily moves between ₹451.70 and ₹466.10 common.
- **Beta:** Not specified, but price swings indicate moderate volatility for sector.
### Valuation
- **Price/Earnings Ratio:** 26.79, above sector average.
- **Price/Book Ratio:** 3.88, also higher than sector average.
- **Dividend yield:** 0.55%.
### Company Fundamentals
- **Revenue (Trailing 12 months):** Approximately ₹54,570million.
- **Net profit margin:** 7.1%, improved over last year.
- **EPS (Trailing 12 months):** ₹17.10 (16.29% YoY growth).
- **Book value per share:** ₹118.21.
- **Return on Equity:** 13.3%.
### Growth & Profitability
- **Annual earnings growth:** 25% (past year), average 25.4% over 5 years.
- **Net profit for Q1 2025:** ₹10,952lakhs, up 18.6% YoY.
- **Free cash flow remains positive; margin improvement noted over 5 years.**
- **Return on assets:** 9.04%.
### Valuation Analysis
- **High PE and PB ratios indicate the stock is priced above sector averages.**
- **Recent buy recommendations from analysts; fair value status varies by source.**
### Qualitative Notes
- **Strong earnings and steady sales growth, but trading above intrinsic metrics.**
- **Growth momentum has slowed versus earlier years, though above industry norm.**
- **Stable dividend payout policy, but yield remains modest.**
- **Technical signals ranged from neutral to bullish in July and August 2025.**
**Summary:** The stock is trading at a high valuation given its growth history and sector performance. Investors should consider recent price corrections, volatility, and elevated PE/PB ratios before entering at current levels. The company maintains strong growth and profitability but is subject to valuation risk if sector trends reverse.
WABAG Price Action## VA Tech Wabag Ltd – Price Analysis (August 2025, without references)
### Price & Market Metrics
- Current share price is around ₹1,580 to ₹1,585.
- Market capitalization is close to ₹9,850 crore.
- The stock's 52-week price range is roughly ₹1,110 (low) to ₹1,944 (high).
- Daily trading range recently has been between ₹1,510 and ₹1,595.
- The stock is trading above both its 50-day (~₹1,525) and 200-day (~₹1,515) moving averages, indicating solid recent momentum.
### Returns & Volatility
- The stock has rebounded strongly from its lows near ₹1,110 over the past year.
- Price movements show moderate volatility typical for the infrastructure sector.
- Recent sessions saw gains around 3-4%, with intraday swings in the 2-5% range.
### Financial Performance & Growth
- Recent quarterly revenue growth stands around 17% year-on-year.
- EBITDA margin is stable at about 13%.
- Net profit increased by approximately 20% year-on-year in the latest quarter.
- Earnings per share (EPS) is near ₹10.5 for the latest quarter, up from about ₹8.8 a year ago.
- The company has a healthy order book valued around ₹15,800 crore, more than four times its annual revenue.
- Large ongoing projects in desalination and wastewater treatment support steady future revenue visibility.
### Valuation Metrics
- Price-to-Earnings (P/E) ratio is about 32.7, which is moderately above typical sector averages.
- Dividend yield is low, around 0.25%, typical for growth-focused infrastructure firms.
- The stock trades at a premium relative to intrinsic value estimates based on growth prospects and margin stability.
### Qualitative Notes
- The focus on engineering, procurement, construction (EPC), and operations & maintenance (O&M) in high-margin segments bodes well for margin improvements.
- Expansion into emerging markets in India, the Middle East, Africa, and CIS regions supports diversified growth.
- The company's net-cash position and free cash flow generation underpin financial stability.
- Analysts see a 15-20% revenue CAGR for the next several years, with steady EBITDA margin expansion.
### Technical & Sentiment Overview
- The stock has positive momentum and has recently sustained levels near multimonth highs.
- Trading volumes have been healthy, reflecting strong investor interest.
- Some historical negative return tendencies in August exist but current momentum seems intact.
***
### Summary
VA Tech Wabag Ltd is currently trading near ₹1,580, supported by solid financial growth, a robust order book, and stable margins. The valuation is moderately elevated with a P/E around 33, reflecting investor confidence in future growth. Profitability improvements and expansion into new markets enhance the outlook. While the dividend yield remains low, the company's focus on reinvestment and cash flow generation is positive. Investors should consider the stock's growth potential balanced against typical sector volatility and a premium valuation.
Overall, VA Tech Wabag presents a growth-oriented investment case with a strong revenue backlog, supportive operational fundamentals, and reasonable technical strength. Caution is warranted due to valuation premiums and historical seasonal volatility, but the outlook remains bullish.

JMFINANCIL Price Action ## JM Financial Limited – Price Analysis (August 2025)
### Price & Market Metrics
- Current share price: ₹186.95.
- Market capitalization: Approximately ₹17,875 crore.
- 52-week price range: ₹78.00 (low) to ₹189.90 (high).
- Day's trading range recently: ₹163.60 to ₹189.90.
- Significant price increase noted recently, with a 14.87% rise on the day observed.
### Returns & Volatility
- The stock has gained about 69% over the last 3 months.
- 12-month return is roughly 97%, showing strong growth.
- 3-year return stands near 182%.
- Recent intraday volatility with daily price swings within a wide range.
### Valuation Metrics
- Price/Earnings (P/E) ratio: Around 16.23.
- Earnings per share (EPS): ₹11.52.
- Price/Book (P/B) ratio: Approximately 1.52.
- Dividend yield: Around 1.46%.
### Financial & Business Notes
- The company has posted moderate sales growth (around 5% year-over-year as per last known data).
- Profitability remains solid with steady net income growth.
- Market sentiment has been strongly positive, driving recent price appreciation.
- Technical indicators show the stock trading well above its 50-day and 200-day moving averages, signaling bullish momentum.
### Summary
JM Financial is currently trading near its 52-week high with strong recent price performance and solid returns over multiple timeframes. The valuation metrics like P/E around 16 and P/B near 1.5 suggest relatively reasonable valuation for a financial services firm with stable profitability. The significant price gains recently reflect positive market sentiment and business fundamentals, though some volatility is present. Investors should consider the solid growth and moderate valuation in the context of overall sector and market conditions when evaluating the stock.

ITDCEM Price Action## ITD Cementation India Limited (ITDCEM) Price Analysis (August 2025)
### Price & Market Metrics
- **Current share price:** Around ₹793 (NSE, August 13, 2025).
- **Market capitalization:** Approximately ₹13,622 crore.
- **52-week range:** ₹467 (low) to ₹944 (high).
- **Day's trading range:** ₹762–₹804.
- **Recent price change:** Up about 4.5% on the day.
- **Average volumes:** About 762,000 shares traded daily in recent periods.
### Returns & Volatility
- The stock has seen a strong rebound from lows around ₹467 in the past year to near ₹793 currently.
- Price movements recently show moderate volatility within a range of about 5% intraday.
- The 52-week high near ₹944 was achieved recently in July 2025.
### Valuation Metrics
- Price/Earnings (P/E) ratio: Approximately 33.3, which is moderately high.
- Earnings per share (EPS): ₹23.83.
- Dividend yield is low at around 0.25%.
- The stock currently trades above its 50-day average price (~₹812) and significantly above its 200-day average (~₹612), indicating recent bullish momentum.
### Financial & Business Highlights
- ITD Cementation is in the infrastructure sector, focusing on construction and civil engineering.
- The company is supported by a solid order book and infrastructure demand growth.
- Market sentiment has been positive with institutional investor meetings scheduled mid-August 2025.
### Technical Sentiment
- The stock price has recently pulled back slightly from highs but remains strong overall.
- Moving averages suggest upward momentum.
- Volume patterns indicate active trading and buyer interest.
***
### Summary
ITDCEM is trading near its upper range for the year, with a current price around ₹793 and a strong market capitalization above ₹13,000 crore. The valuation is moderately high with a P/E above 30 and EPS near ₹24. Recent price momentum is positive supported by infrastructure sector tailwinds and investor interest. While the stock has experienced some volatility, the technical indicators point to sustained buying at current levels. Dividend yield remains low, consistent with growth-oriented infrastructure companies. Investors should consider valuation moderately stretched but justified by growth prospects and market position. Caution is advised for short-term price swings given past volatility.
