BTC Breaks Free from Downtrend: Next Stop $72KBitcoin Shows Bullish Signs: Breaks Downtrend, RSI Rebounds, Targeting $85K and $90K
Bitcoin has recently displayed strong bullish signals in the market. It formed a bullish divergence and successfully broke its downtrend. The RSI (Relative Strength Index) has bounced back from oversold levels, indicating increasing bullish momentum.
To sustain this upward trend, Bitcoin now needs to surpass key resistance levels at $64,500 and $72,000. If these levels are breached, new targets of $85,000 and $90,000 come into focus, potentially marking significant milestones for BTC's price trajectory.
This combination of technical indicators suggests a bullish outlook for Bitcoin in the near term.
Shark

LINK's Bullish Shark Pattern: Retest Bounce Targets $23 with 100#Chainlink ( BIST:LINK ) is currently forming a bullish shark pattern, a harmonic pattern that indicates a potential reversal and a strong buying opportunity.
In this scenario, LINK's price is expected to bounce with retest of a crucial support level. The RSI (Relative Strength Index) has reached the oversold area, suggesting that the asset is undervalued and may soon experience a reversal.
If LINK successfully retests the support level and bounces, the bullish momentum could propel it to a significant target of $23. This move would represent an almost 100% return from the current price level.

NEAR/USDT: Bullish Shark Pattern Signals a Potential 60% Upside#NEAR/USDT has formed a bullish shark pattern & the RSI (Relative Strength Index) is currently in the oversold area, suggesting that for a rebound.
Currently, NEAR is standing at a bullish support trend line, which further reinforces the potential for an upward move. Given these strong technical signals to deliver a 60% profit.

#LINK/USDT FORMED DOUBLE BOTTOM PATTERN #LINK/USDT has recently shown a bullish shark and double bottom pattern, indicating a potential uptrend. The price has bounced from the buy liquidity support area at $11.5, suggesting a strong level of buying interest at that price point. This could signal a reversal in the current downtrend and a possible move towards higher price levels.

#ETH/USDT FORMED BULLISH SHARK PATTERN #ETH/USDT has recently formed a bullish shark pattern and also displayed a clear bullish divergence, leading to a bounce from the $3100 area to grab liquidity.

#LINK/USDT FORMED BULLISH SHARK #LINK/USDT has recently formed a bullish shark pattern, indicating a potential double bottom formation. If this pattern plays out, there is a chance for the price to reach around $11, where it could potentially grab liquidity before making a significant upward move towards the moon.

#BTC/USDT MOST LIKELY TO FORM BEARISH SHARK#BTC/USDT chances to move 3 direction :
1. CHACNCE to form bearish shark after retest 60k
2. consolidation near 62500 and move to 72500$
3. if lost 59200$ support, it will fall down to 53k level with 10 to 15% correction

Banknifty Today prediction Banknifty Forming a Harmonic pattern entry exit mentioned so do u r own analysis and trade

Breakout and life time high1) bearish market but stock hitting it's life time high
2) sustain it's sentimental resistance 2500
3) no recommendation for buy and sell
4) volume buildings

Nifty Prediction Today NSE:NIFTY Forming M pattern take support that Zone so Do u r own analysis and tarde


USDT.D FORMED BEARISH SHARKUSDT.D REJECTED FROM TREND LINE RESISTANCE AND ALSO FORMED BEARISH. Normally USDT.d and btc and alts are inverse related so now we can see the market will go high.

BTC FORMED BEARISH SHARKBTC formed bearish shark and continuing its bearish trend, in last analysis i told to make long in retest and now time to go short and support around 64500 and 62500 levels.

FET formed bullish divergence FET formed bullish divergence and bullish shark pattern. So now it time for good scalp long.

ATOM formed bullish sharkAtom formed bullish shark in 4hr and it standing on imp support line , so we can expect bounce here and next resistance is 12$

USDT.D formed bearish shark in 4hrUSDT.D formed bearish shark , it will cool down for sometime and again mostly it will move upwards so that we can expect bullish move which causes alts and btc bleed becoz usdt.d and alts are inversely related.

ETH FORMED BULLISH SHARKETH shows short term bullish sign becoz of bullish shark. Eth will retest 3675$ and then fall to 3000$.

ETH BEARISH DIVERGENCE ETH formed bearish shark, double top and bearish divergence , targets and supports are 3420, 3300, 3150

BTC FORMED BEARISH SHARKBTC now bearish for 4hr time frame bearish shark, bearish divergence and macd crossing bearish , next support levels are 67000$ and 64000$. now time to short.

BIG Bounce Or Fall? Banknifty Simple Analysis for tomorrowRecap:
As mentioned yesterday's analysis Bank nifty started with fake break out after firing 2 strong bullish candle on 15min & then a sudden dip trapped many players. But still strong support 46900 helped saved bulls to reach again for a breakout but failed & BN closed at support 46900.
Analysis for Next Day:
Bears have started dominating as seen today bulls failed to break 47200-47300 level twice also confirms bears presence more then bulls. Again mentioning bullish presence is strong above 47300.
Trend line support has also been broken in last 30 min session today & closed at support. if BN open below 46900 this can be bearshish move. Keep eyes on opening print.
Bulls can bounce from daily resistance if gap up opening is seen & for momentum they need to cross 47300.
Looks like may be it will a sideways day tomorrow.
Support : 46900,46700
Resistance : 47100,47300
Note : Do your own analysis before making any trade decesions.

Bajaj Finance : Free fall on the way ?? Alert! Bearish Pattern Spotted! 🐻
📊 Pattern: Rising Channel
📌 Symbol/Asset: BAJFINANCE
🔍 Description: Stock has made Broadening pattern and then not able to cross the resistance.
Now stock is making Rising channel and its near to the resistance.
If resistance is not broken then
We can see fall from 8250-8350 levels.
👉 Disclosure: We are not SEBI registered analysts, this is not a buy or sell recommendation.

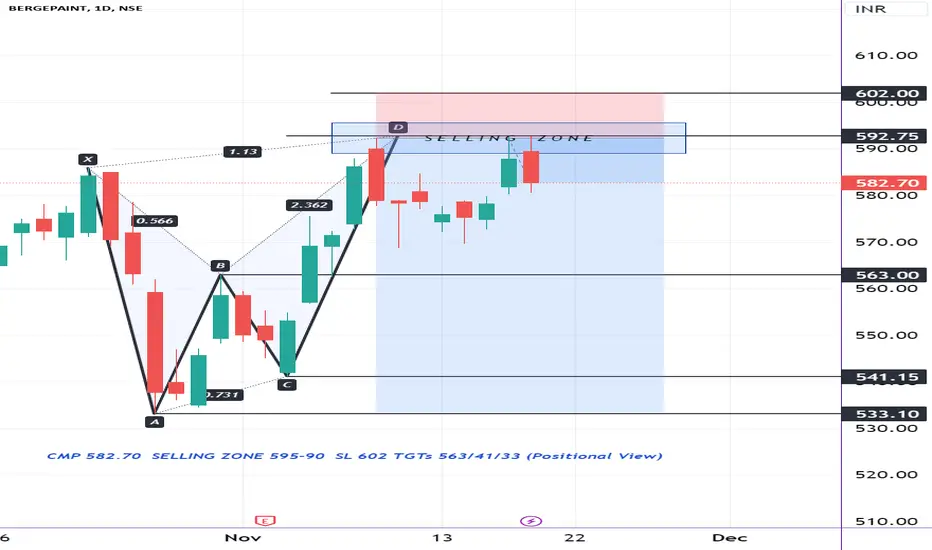
BERGEPAINT BEARISH HARMONIC PATTERN IN DAILYCMP 582.70 SELLING ZONE 595-90 SL 602 TGTs 563/41/33 (Positional View)
Take DIVGIITTS for 30% upsideStock with medium financial performance and average valuation, but technical indicator shows weak price momentum but still sector is bullish so this is very good price to entry .
take entry at cmp 966
Target 1266
Next average at 800 and 596 ( at this level you have to invest same amount again)
