EURUSD 4H chart - Short Setup🔍 Chart Overview
Pair: EURUSD
Timeframe: 4H
Pattern Identified: Head & Shoulders (bearish reversal pattern)
Trendline: Broken — signals end of previous uptrend
Market Structure: Lower highs forming → beginning of a downtrend
📉 Bearish Trade Setup
1. Entry Zone
Marked just below the broken trendline and neckline of the Head & Shoulders.
Entry: ~1.12450–1.12500
Price has already broken below neckline → confirming the pattern.
2. Stop Loss (SL)
Placed above the right shoulder, around 1.14096.
Smart placement as a break above would invalidate the Head & Shoulders pattern.
It also covers any minor retracement into the supply zone.
3. Take Profits (TP)
1st TP: ~1.09000 zone
🔹 This zone acted as previous structure support
🔹 Good area to book partials or move SL to breakeven
2nd TP: ~1.03258
🔹 Long-term target
🔹 Based on major previous demand zone visible on the left (possibly from daily chart)
🔻 Technical Analysis
✅ Bearish Confirmation
Head and Shoulders formation: Reliable trend reversal signal
Break of Trendline: Confirms the structure has shifted
Break of neckline: Entry confirmation
Retest of neckline/structure: Entry after confirmation makes it safer
🔎 Confluences
Confluence Result
Head & Shoulders ✅ Strong reversal pattern
Break of trendline ✅ Indicates shift in trend
Break + Retest of neckline ✅ Classic confirmation
Entry after confirmation ✅ Higher probability
SL above right shoulder ✅ Strategic placement
TP levels at structure & demand ✅ Logical TP zones
🛡️ Risk to Reward (RRR)
RRR is very favorable, roughly:
1st TP ≈ 1:2
2nd TP ≈ 1:4 or higher
A well-planned swing trade
📌 Final Recommendation
✅ This is a clean swing trade setup based on price action, pattern, and structure shift.
🔄 Consider partial close at 1st TP and trail SL.
🧠 Maintain discipline on SL—if price violates the right shoulder, exit.
Shortsetup

Max Financial - Positional Short SetupCMP 1305 on 02.05.25
In the last 2 months, the stock price has increased by around 30%. This time forming a double top-like pattern. If the price is rejected from these levels, a bearish move may come ahead.
If the price remains below the 1300 levels, targets of 1245/1210 and 1165 may be seen.
One should wait for the confirmation for a short setup, while considering risk management.
The setup fails if the price sustains above 1330.
All these illustrations are only for learning and sharing purposes, not a trading recommendation. It is only for paper trading.
All the best.

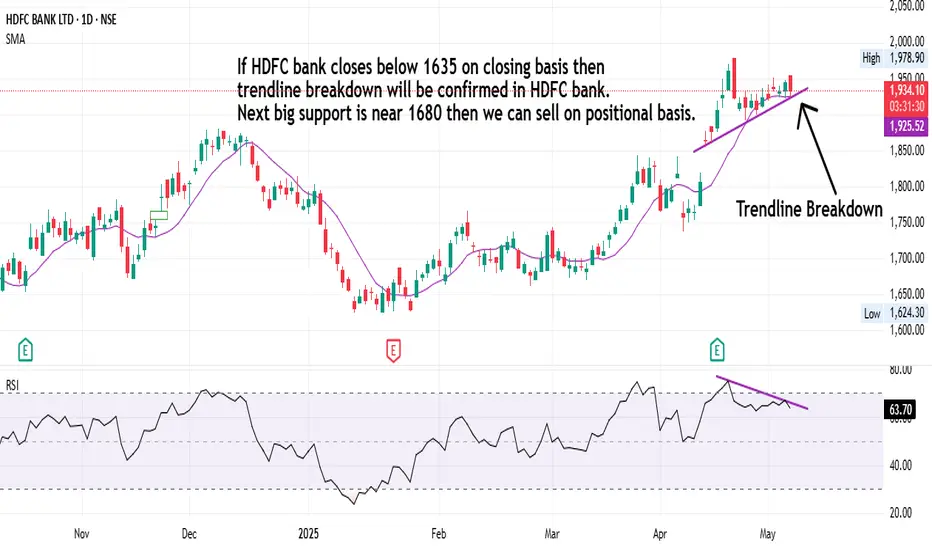
HDFC Bank Swing Trading Strategies!If HDFC bank closes below 1635 on closing basis then trendline breakdown will be confirmed in HDFC bank. Next big support is near 1680 then we can sell on positional basis.
Gold at the Edge: Range Compression Signals Brewing Breakdown !Gold (XAU/USD) has entered a critical phase on the daily timeframe, forming a tight range between ~$3,305 and ~$3,330 after a strong bullish rally. This price action resembles a distribution pattern — a phase where smart money offloads positions while retail gets trapped in volatility. Despite repeated intraday bounces, price has failed to break higher, indicating weakening bullish momentum and growing pressure from zones above.
According to price action this rectangular structure just above $3,300 is not just a pause — it’s a coiling range with heavy potential energy. The failure to push above recent highs shows exhaustion, while the support zone at $3,201.11 emerges as a decisive level. If this support gives way, it would confirm a range breakdown with an immediate target of ~$3,100 and a secondary potential target near $2,900 based on prior zones and volume gaps.
From a fundamental lens, the downside risk is justified. U.S. economic data continues to show resilience, which strengthens the dollar and fuels Neutral Fed sentiment. Sticky inflation and a robust labor market are forcing investors to reprice the probability of further rate cuts — delaying the Fed pivot narrative that previously propelled gold upward. On top of that, real yields are rising again, which historically applies downward pressure on non-yielding assets like gold. With trade wars easing off too this is a downwind for gold .
Geopolitical tensions, which previously supported gold’s safe-haven appeal, have shown signs of de-escalation in recent days, weakening bullish flows further. In short, unless a fresh global catalyst emerges, the fundamentals currently align with the bearish technical setup forming on the chart.
Key Level to Watch:
Breakout 3300 targeting 3210-20 sl above 3350
🔵 $3,201.11 — Decision point for bulls to hold and push back OR a trigger for bears to unleash further downside.
⚠️ Break below this level opens doors to 3,100 first and then 2,900 as liquidity unwinds.
Until a clear breakout or breakdown occurs, this range is a trap. Stay sharp and wait for confirmation — because when this range breaks, it won’t be silent.

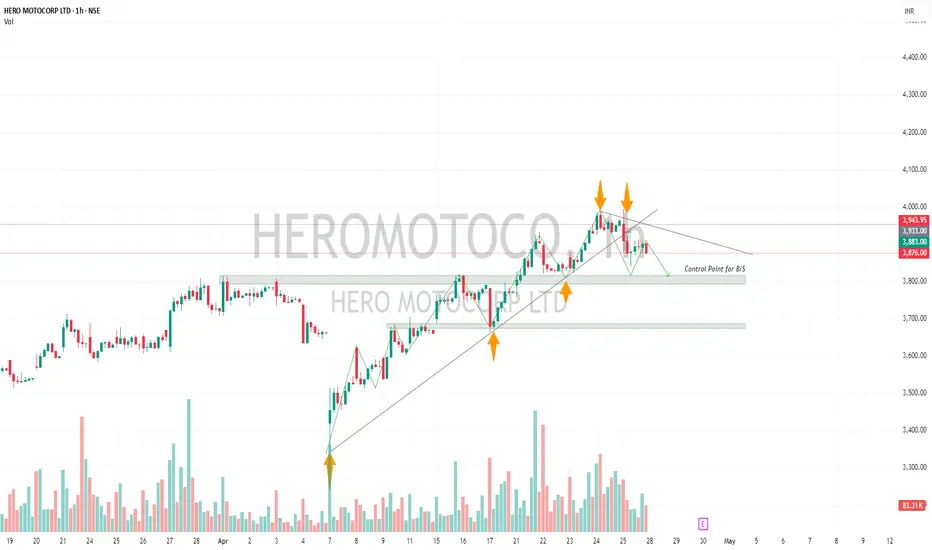
HEROMOTOCO-Positional Short Trade Stock upside taking support from trendline. Friday's session 25'th April The stock has shown weakness potential trend reversal.
There are two possibilities:
1)Head and Shoulder Pattern
2)Descending Tringle Pattern
For both the possibilities it the neckline/Support zone 3800 needs to break. If that happens it may test 3680.
If opens gap up Above 3960 Avoid!
Please don't forget click on follow button so you won't miss any upcoming ideas.
Any confusion, feel free to drop msg. Happy to help :)
This is only for educational purpose, please manage your risk accordingly.
ALKEM IN BEARS PRESCRIPTION????YES!!!! Chart patterns implies a downward possible move in ALKEM LABS.
1. Every detail given in the chart.....highs and lower highs...lows and lower lows forming a evergreat trading pattern
2. Adding to that, 3 Black crows with good volumes adds probability to the trade.
3. Its been travelling in descending channel pattern...now at the resistance....
Let the Market decide!!!! Let's wait and watch!!!!
This is just my opinion....not a tip nor advice!!!!!
Thankyou!!!!
mmjimm.

BANKBARODA-Intraday- Short tradeBANKBARODA has formed Descending tringle in 15minute timeframe.
The key level to watch on 15th April trading session would be 230 if breaks It would be in downtrend for short term till 223 to 220.
If it opens gap up please avoid.
Please don't forget click on follow button so you won't miss any upcoming ideas.
Any confusion, feel free to drop msg. Happy to help :)
This is only for educational purpose, please manage your risk accordingly.

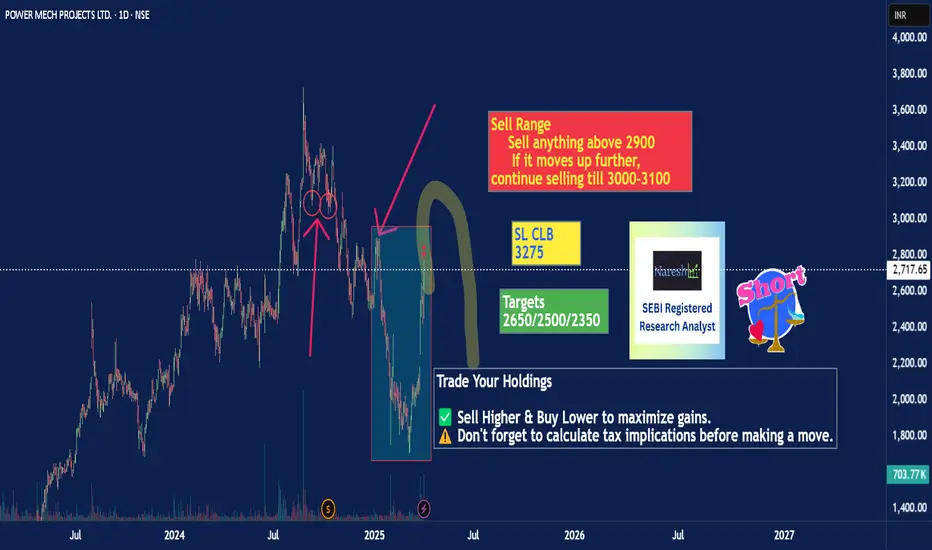
Short Trading idea - Short sell your Holding's - POWER MECH PROJWake Up Your Holdings & Make Them Work !!!
There’s a way to utilize your idle holdings lying in the Demat accounts and generate returns.
A short-sell setup seems to be forming, and we can take advantage of it! 📊💡
🔹 LTP: 2717
🔹 Sell Range: 2900 - 3100
🔹 Stop-Loss: Close above 3275
🔹 Cover-Up Trade - Expected Targets: 2650 - 2500 - 2350
📌 All trade details are mentioned in the chart. Let’s put our holdings to work! 🚀
if you like this idea 💡 --- Plz don't miss to Boost 🚀
For more info - Plz visit my profile & Follow me
Rgds,
Naresh G
SEBI Reg.RA
NIFTY50 - AN INGISHT FOR INVESTORSSymbol - NIFTY50
CMP 25305
If you are a long term investor, one thing that will help you to decide when to invest - Nifty monthly RSI.
As and when RSI moved above 80, markets uniformly correctly (around 20% usually) & as and when RSI came below 40 level, markets uniformly rallied.
Now RSI is at 82
Fundamentals are also showing that overall market is modestly overvalued.
What you want to do or should you be worried ?
tell me in comments below.
P.S. : I'm out of all longs & have entered shorts.

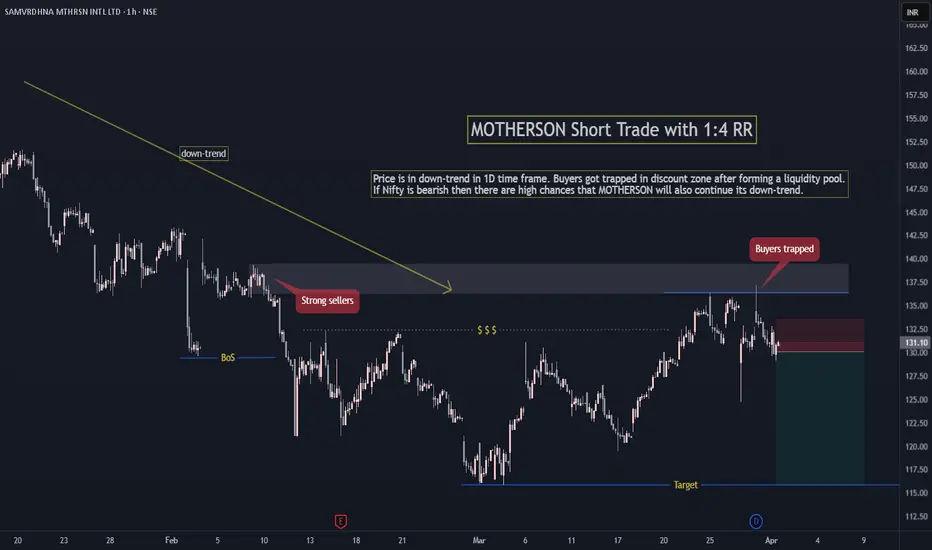
MOTHERSON Short Trade with 1:4 RRPrice is in down-trend in 1D time frame. Buyers got trapped in discount zone after forming a liquidity pool. (Inverse head & shoulder pattern retail traders got trapped )
If Nifty is bearish then there are high chances that MOTHERSON will also continue its down-trend.
Follow for more such simple setups based on Trend, Liquidity Grab and Current market direction. Happy Trading!
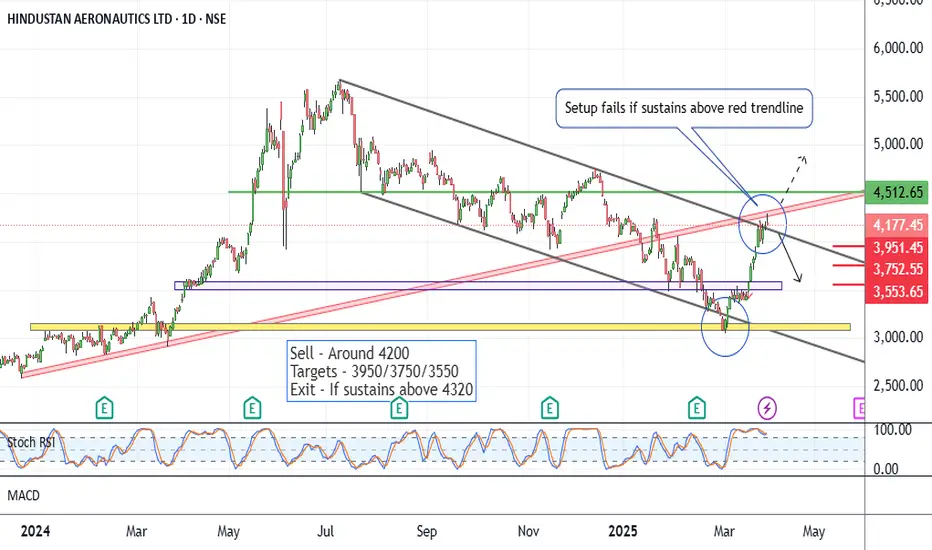
HAL - What Next ?CMP 4177 on 31.03.25
The stock has shown a 40% rise in the recent month. This time may face resistance as shown on the chart (the red trendline).
If the price is rejected from these levels, a downside move can be seen ahead. That can push the price down to the levels of 3950/3750 and 3550.
The setup fails if the price sustains above 4320 levels.
The strategy may be coupled with some hedging options for a wide coverage.
All these illustrations are only for learning and sharing purposes, for paper trading. They are not trading recommendations in any way.
All the best.
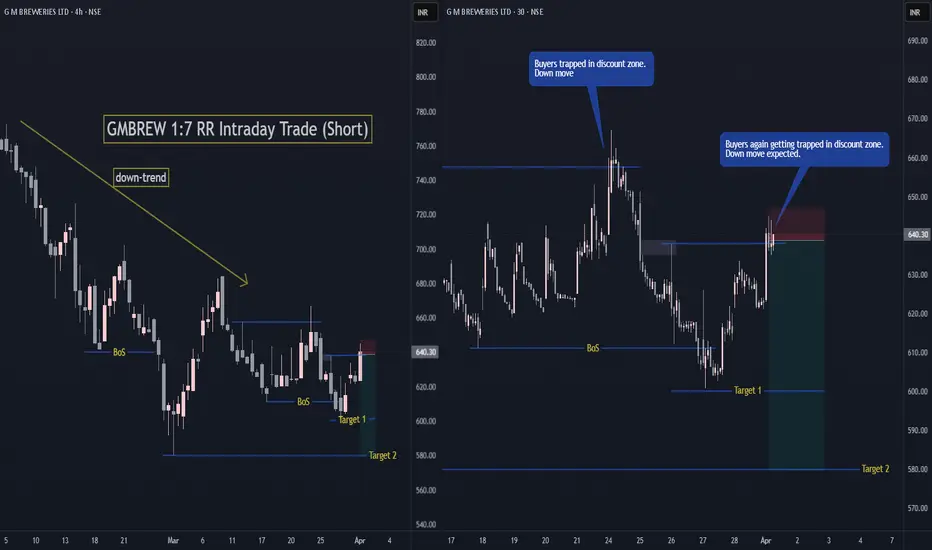
G M BREWRIES Intraday Trade (Short)GMBREW 1:7 RR Intraday Trade (Short) , Simple trade based on Trend and Liquidity Sweep in discount zone.
If Nifty is not bullish from current levels for today and tomorrow's session, then GMBREW has good chances of hitting Target 2.
Britannia - Keep On WatchCMP 4575 on 04.03.25
The price movement has made a head & shoulder-like pattern in recent sessions and showed a breakdown of the pattern.
Also, the price has fallen to a crucial projection level that has acted as a support in the last 5 years. If it breaks down and sustains below this level, a bearish move may be seen.
Downside targets may be 4150/3800 or even more.
This setup remains active if the price sustains below 4700. Above 4820, setup will go weak.
One should keep the position size according to the risk management.
All these illustrations are only for learning and sharing purposes, not a buy or sell recommendation in any form.
All the best.

Nifty ShortLets take risk of minor 60 points in nifty
Entry- 22830-22840
SL- 22900
Target- 22700 and Can book around according to your risk profil.
Reason- Gap filled RSI overbought in 15 min tf at 90 levels. Previous support which was 22800 may act a resistance now.
Disclaimer- This is just for educational purpose.
Jai Shree Ram

Very good shorting opportunity in btc. Setup explained Btc is falling from 1hour supply zone. It has failed rmed M pattern also. Good risk reward trade. Manage risk

BTC broke down the important trendlineBTC broke from the important trendline and headed to $78k.
Momentum looks good and might pick up. Present 4hr candle should be considered

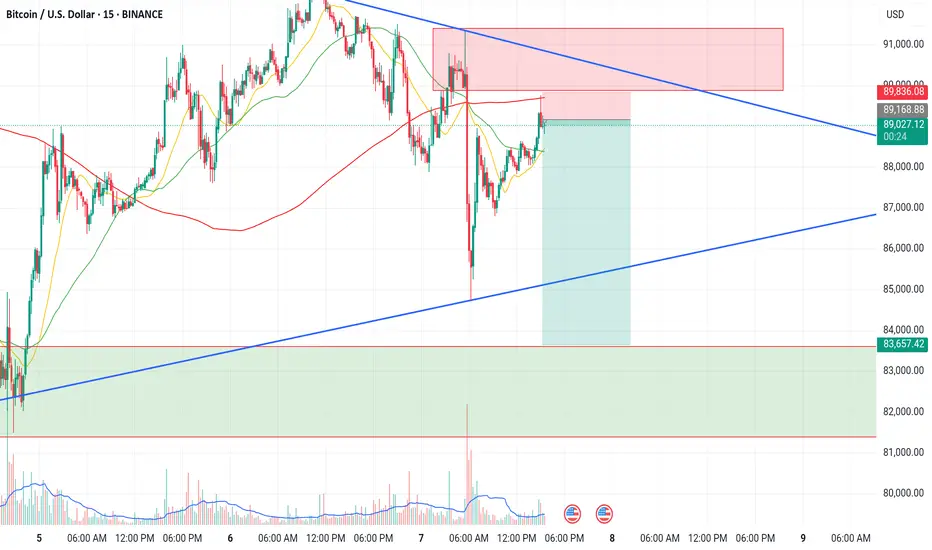
Very good shorting opportunity in BTC. Trade setup explainedBtc is getting rejection from 1hour supply zone. We can short btc with sl of 89840. We can target level of 83650. Risk reward ratio of the trade is very good i.e 1:8. Below at 83000 levels We have a demand zone which will be our target for the trade.
360 ONE WAM Ltd. - Bearish View - HourlyTREND ANALYSIS & TRADE SETUP !
WAVE ANALYSIS !!
Follow Chart Instruction.
Do not be Hurry for entry.
Wait for Proper Entry Setup.
Buy/Sell with Best Risk Reward.
Educational Chart Only.
Wait for ENTRY CONFIRMATION !
Risk : Reward: 5-6 times.

Titan - Keep On WatchCMP 3580 on 03.02.25
The above chart shows that the price has been traveling in a rising parallel channel in recent sessions. At this moment, the price has touched the upper edge of the channel. If rejected from these levels, a bearish move may be seen further.
Targets may be 3510/3330 and 3190.
Please keep in mind the earnings day around 4th February.
This setup fails if the price sustains above 3710.
Plan your trade as per your risk management. ( entry and exit)
The above illustration is my view. It is only for learning and sharing purposes, not a trading recommendation.
All the best.

Midcap ETF forming Dual Rounding PatternThe ICICI Prudential Midcap ETF is currently exhibiting a technically significant dual rounding pattern on its chart, with one smaller rounding top pattern nested within a larger, longer-term rounding formation. The 21 level has emerged as a strong support zone. A breach of this level would likely activate the smaller rounding top pattern, potentially leading to a further decline toward the 19 level.
The ETF initially displayed a bullish structure characterized by higher highs and higher lows, but has now shifted to forming lower highs and lower lows, a common early indicator of a trend reversal from bullish to bearish. This suggests that while the market is in the early stages of this reversal, it's too soon to definitively call the transition.
Volume analysis plays a crucial role in confirming price action, as volume tends to be a more reliable indicator. In the recent chart movement, a clear volume divergence was observed during the last upward move, indicating weakening buying interest. Conversely, there has been volume agreement during the recent price decline, further supporting the possibility of a bearish shift. Close monitoring of volume trends will be essential in confirming this potential reversal and avoiding any price manipulation signals.
****Nifty Midcap forming same pattern but we analyze this because we will do Price Volume Analysis***

animeusdt will take out its target to 0.0310animeusdt has a great target of 0.0310 as my logic and research. will it possible to target??

Try Shorting BTC with small SLI believe it will drop after triggering the stop-losses of the last short positions, potentially turning into a significant trade. I’ve tried this approach before, and it responded well on the sell side, although the results weren't as expected. Let’s give it another shot this time, as the probability seems higher now.

EUR/AUD 4-Hour Chart AnalysisKey Observations:
1. Support Zone:
- The price is currently retesting a key support zone around 1.6540–1.6565, which previously acted as a demand zone.
2. Trendline Break:
- The uptrend has been invalidated with the break of the ascending trendline, suggesting a potential shift in momentum to neutral or bearish.
3. Key Levels:
- Resistance Above: Potential resistance can be seen near 1.6650–1.6700, in case of a bullish retracement.
- Support Below:
- 1.6359 (first support level).
- 1.6199 (major support).
- 1.6018 (long-term support zone).
4. Possible Price Movements:
- A bullish rebound from the current support zone or a bearish continuation if the price breaks below it.
---
Trading Scenarios:
1. Bullish Rebound:
- If the price holds above the 1.6540–1.6565 zone, it may attempt a recovery toward the previous highs.
- Entry: Above 1.6570
- Targets: 1.6650, 1.6700.
- Stop-Loss: Below 1.6530.
2. Bearish Breakdown:
- A decisive break below 1.6540 may open further downside toward the lower support levels.
- Entry: Below 1.6530.
- Targets: 1.6359, 1.6199, 1.6018.
- Stop-Loss: Above 1.6570.
---
- Wait for clear confirmation (e.g., a strong candle close) before entering a trade to avoid false breakouts.
- Use proper risk management with clearly defined stop-loss and take-profit levels.
---
**Disclaimer**:
This analysis is for informational purposes only and does not constitute financial advice. Trading involves substantial risk, and past performance is not indicative of future results. Always conduct your own research and consult a financial advisor before making investment decisions. Trade responsibly.
