Setup for Balkrishna IndustriesAfter a huge rally, retracement is expected, and this is a retracement trade
Overall, Balkrishna Industries is in an uptrend, so be careful
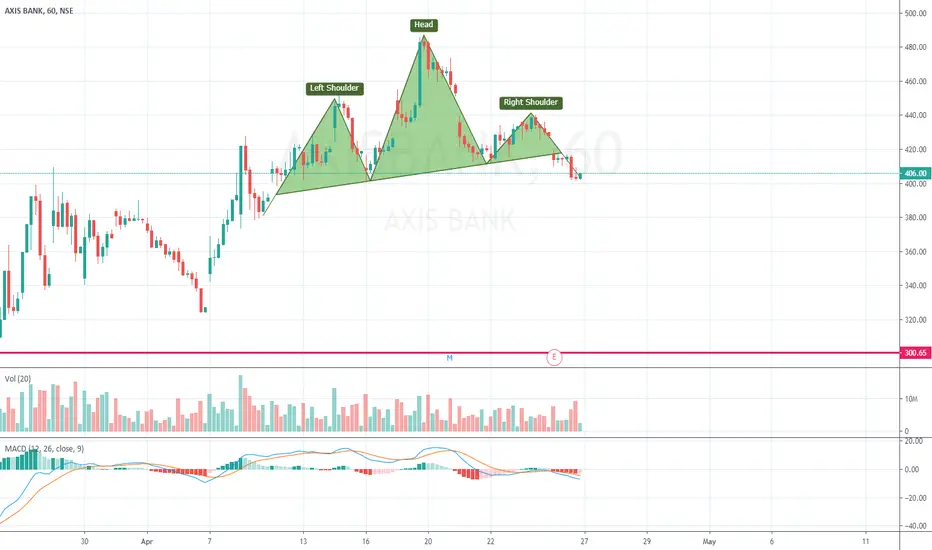
Information is given on the chart
This is an educational post
Grateful!🙏
Shortsetup

SHORT BANKNIFTYI hope you can now see how the BANKNIFTY represents an excellent low risk profit entry setup allowing you to trade in the market.Take positions so that the risk/reward is in your favour.
Disclaimer: It should not be assumed that the methods, techniques, or indicators presented in these chart will be profitable or that they will not result in losses. There is no assurance that the strategies and methods presented will be successful for you. Past results are not necessarily indicative of future results. You should not trade with money that you cannot afford to lose. Examples presented in these CHART are for educational purposes only and it should not be assumed that these are indicative of ordinary trades. These setups are not solicitations of any order to buy or sell. The publisher assume no responsibility for your trading results. There is a high degree of risk in trading.

ShortGood area to go short + volume + no good support till target + target is around 50% retracement.


AUDNZD FORMING ASCENDING CHANNEL PATTERNWe can see an Ascending Channel Pattern being formed on AUDNZD Chart, Seems to be a possible breakout , Only trade after a Breakout of support and take profits of around 500 pips easily

AUDJPY WITH RISING WEDGE PATTERNWe can see a clear rising wedge formation on AUDJPY and there is a very high possibility of breakout of support, if it does then there is a chance of going on SHORT on this trade and get a minimum of 500pips in your pocket

NIFTY WITH HEAD & SHOULDERS FORMATIONWe can spot a clear Head & Shoulders Pattern Formation in NIFTY D1 Chart, I have used Heikin Ashi For clarity , u can even use it as your exit point as soon as it forms a bullish candle (red color)


Kotak Bank Short Trade SetupSell June Future Positional ~ 1178, 1185,
Stop ~ 1210, Target ~ 1050, Lot Size ~ 400

BAJF: Shorting Opportunity Around the Axis LineBajf had a strong sell of which drove it back below the axis line. There could be a possible short setup which i ll present on the lower time frame. For more information on the Axisline topic read my previous post.
Regards

Quick Shorting opportunity on 4 Hr Crude Oil with Risk of 2:1Beautiful shorting setup built on Crude oil 4 hour chart with risk of 2:1. There is a strong supply zone from $ 29.16 to $ 30.04 on 4 hour chart and oil is heading towards the supply zone. This supply zone has been tested only once till now and there is a strong possibility to reverse the trend on this price level one more time.
Short @ $ 29.10
Stop Loss @ $30.10
Profit Target @ $27.20


