BankofIndia - Short to Long Term Investment BuyBank of India - Technical Analysis
Current Price: 129.77
Timeframe: Monthly Chart
Key Technical Observations
1. Currently, PSU banks are exhibiting bullish characteristics with positive sector support influencing the stock positively.
2. Cup and Handle Formation - The stock is displaying a gradually developing cup and handle pattern, a classic bullish continuation setup that suggests potential upside momentum.
3. Rising Channel Support - Bank of India is actively trading within and supported by a rising channel, indicating strength in the uptrend structure.
4. Historical Strength Pattern - Over the years since 2021, the stock has been making higher highs and has recently completed a decent retracement, suggesting a bounce-back scenario in formation.
5. RSI Hidden Divergence Confirmation -A hidden divergence has been identified on the RSI indicator, providing additional technical confirmation for trend continuation.
Potential Target Levels
Based on technical analysis:
- 20% Move: 155.40
- 50% Move: 194.70
- 77% Move: 232.00
Risk Management
Strict Stoploss: 99.18 on Weekly candle closing basis
DISCLOSURE & RISK WARNING:
This analysis is provided for educational and informational purposes only and should not be construed as financial advice, investment recommendation, or an offer to buy or sell securities. Past performance is not indicative of future results.
Shortterminvestment

AdityaBirlaCapital - Investment IdeasAditya Birla Capital Ltd - Technical Analysis
Simple Technical Analysis Summary
Aditya Birla Capital is breaking out from a multi-year resistance zone with a classic and perfect rounding bottom pattern playing out on the monthly timeframe.
Fibonacci targets have been activated!
Key Technical Observations
1. Multi-Year Rounding Bottom Pattern
The stock has completed a textbook rounding bottom formation spanning multiple years. This is one of the most reliable bullish reversal patterns in technical analysis, indicating a fundamental shift from bearish to bullish sentiment.
2. Breakout from Multi-Year Resistance
After years of consolidation and base building, the stock has successfully broken out from a significant resistance zone around ₹255. This breakout signals the potential beginning of a new uptrend cycle.
3. Monthly Timeframe Confirmation
The pattern is forming and confirming on the monthly timeframe, which carries significantly more weight than shorter timeframes. Monthly breakouts tend to lead to sustained moves.
4. Fibonacci Extension Framework
Multiple Fibonacci extension levels have been identified and activated, providing a clear roadmap for potential price targets based on the measured move from the rounding bottom pattern.
#Fibonacci Extension Target Levels
Based on the rounding bottom pattern measurement and Fibonacci extensions:
- Target 1: 314.20 (1.272 Fibonacci Extension)
- Target 2: 345.10 (1.414 Fibonacci Extension)
- Target 3: 389.90 (1.618 Fibonacci Extension)
- Extended Target: 472.00 (2.0 Fibonacci Extension)
Key Support Levels
- Immediate Support: 255.00 (Breakout level / Previous resistance turned support)
- Secondary Support: 171.86 (0.618 Fibonacci retracement)
- Critical Support: 146.17 (0.5 Fibonacci retracement)
- Base Support: 42.35 (Rounding bottom base)
- Pattern suggests long-term bullish structure - Risk-reward favorable for position building on dips
Risk Management:
- Maintain stoploss below 255 on monthly closing basis
- For aggressive traders: 240 (allowing some wiggle room)
- For conservative traders: 235 (below breakout zone)
Invalidation Level:
- Monthly close below 240 would weaken the bullish structure
- Break below 220 would invalidate the immediate bullish setup
DISCLOSURE & RISK WARNING:
This analysis is provided for educational and informational purposes only and should not be construed as financial advice, investment recommendation, or an offer to buy or sell securities. Past performance is not indicative of future results.

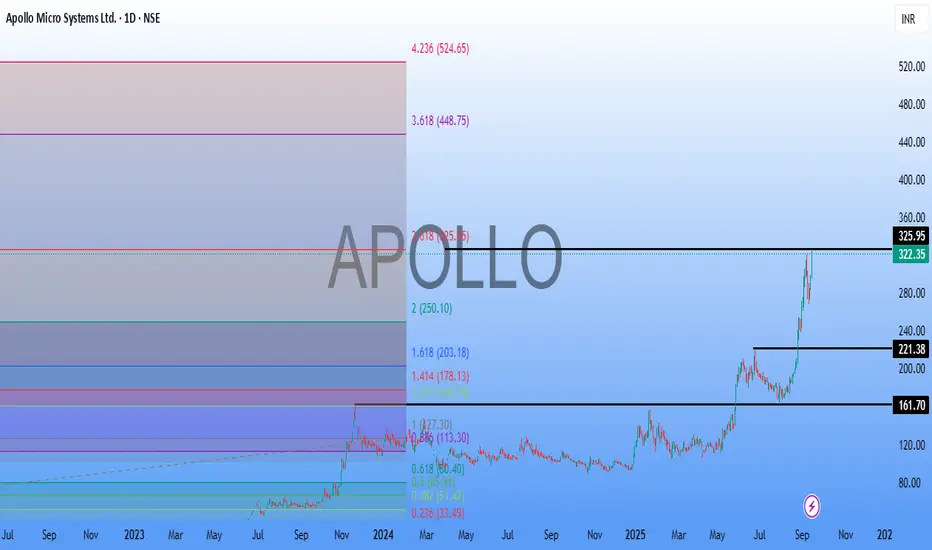
ApolloMicro SystemsApollo Micro Systems (AMS) is an Indian defense and aerospace electronics company poised for growth due to strong order books and expansion plans.
Apart from the Fundamentals, from Technical Point of view based on previous high breakout, stock has reached the Fibo Extension of 325.95. and its the Major Resistance.
Its a buy on dip candidate for a short to long term Investment stock,
with next target of 448.75 / 524.65.
IRCTC Stock Daily Time 200 EMA Support | Weekly Time 50 EMAConsolidation and take support.
Best financial performance.
IRCTC Stock Daily Time 200 EMA support
Weekly Time 50 EMA support

#TTKPRESTIG Strong Buy Short Term Investment#Stock is in #Consolidation stage for a long time, and it made a very tight zone and now making HigherHigh.
Stock is making a #Triangle #Pattern and waiting for a Breakout.
Maintain Proper SL and Enter a trade for a short to long term investment.

Naukri Strong BuyStock is in strong Uptrend,
Inverse Head & Shoulder Pattern,
Higher High Formation. Multiple Confirmation for
upper targets.
tgts 5482/5761/6320/7008

Buy Prakash Pipes Short Term Trading Advice by Goodluck Capital
Buy Prakash Pipes (NSE:PPL)
Buy Range- 420 - 440
Target- 500 - 520
StopLoss- below 375
Potential Return- 18-21%
Approx trade duration 14 - 15 days

[SHORT-TERM STOCK] BUY AARVEE DENIMSAarveeden looking good for short term around 27 and expected to get 10-15% profit.
To motivate us, Please like the idea If you agree with the analysis.
Happy Trading!
InvestPro India Team
ALong

IEX - Trading at almost 50% points away from 52 week high NSE:IEX
Indian Energy Exchange (IEX) is the premier electricity exchange in India, which facilitates trading of electricity regulated by the Central Electricity Regulatory Commission
IEX commands a market share of ~90% in the power exchange market
The company has a debt free balance sheet with cash & investments to the tune of ~ |340 crore
Found attractive swing trade/ short term investment opportunity with lower risk ratio
Buy for the target - 166, 180, 220
Stoploss - 130

[INVESTMENT] RAMA PHOSPHATESThe stock looks good for short-term investment as expect to give 10-20% return within a month view.
To motivate me, Please like the idea If you agree with the analysis.
Happy Trading!
InvestPro India Team

Kennametal Cup - Burning hot oneKennametal seems to be broken out of the cup which it was forming since its inception...
After almost 18 months of consolidation (after Oct 2019), Price has broken out.
Very Good Opportunity for short term investors.
KLong

MARICO: Buy around 312.8 SL: 310 and Tgt: 322.50MARICO traded in HIGH volumes on NSE today which broke above Ichimoku cloud.
Buy MARICO at 312.80 with SL of 310. and Target of 322.5

FLFL: Buy around 412 SL 392 Tgt:445Future Lifestyle Fashions Limited FLFL has increasing buying interest and has gained around 5% on NSE on Thursday with Volumes more than 10 times its average trading volumes.
One can Buy FLFL AT 412 with SL 392 and Target of 445 (Expected time frame of 3 Months)
