NIFTY50 - VULNERABLE TO 20% CORRECTIONSymbol - NIFTY50
NIFTY50 has been trading within a defined range for the past several months, unable to generate any meaningful trending move due to the absence of strong fundamental or macroeconomic catalysts on either side. Both bullish and bearish drivers have remained largely muted, resulting in a period of indecision and lackluster volatility.
While the index itself has shown little directional progress, distribution patterns are increasingly visible across the broader market, which continues to exhibit a consolidation to bearish bias. This suggests that institutional participation may be shifting, and underlying sentiment is weakening despite the Nifty50’s apparent stability.
There are several macroeconomic and geopolitical factors that could contribute to a potential correction in global equity markets. Although listing them all would make this analysis excessively long, some of the key concerns include:
1. Rising inflationary pressures driven by US tariffs implemented under Trump’s economic policy.
2. Weak US fiscal policy and growing concerns that the US government could default on its debt obligations.
3. Elevated recession expectations in the United States.
4. Gold and Silver simultaneously hitting historic highs, signaling a clear risk-off sentiment, even as US equity markets trade at record levels.
5. Overvaluation and speculative euphoria in AI and machine learning related stocks, indicating a potential bubble in select sectors.
At current levels, valuations appear moderately high, and the 'smart money' or true value buying zones remain significantly lower. Based on these factors, my personal bias leans toward a major correction in the coming months. I anticipate a potential downside of around 20% or more in NIFTY50.
This is a positional view, so I am not sharing immediate support or resistance levels. However, the 20-21K zone and below may represent attractive long term accumulation levels for investors once the correction plays out.
It’s worth recalling that in my previous outlook last year, when Nifty50 traded near 26000, I projected a 10–15% correction, which materialized shortly after. This time, however, the downside potential could be even deeper - though only time will tell how the broader macro picture unfolds.
Disclaimer: This analysis is shared purely for educational purposes and should not be considered trading or investment advice.
Shorttradesetup
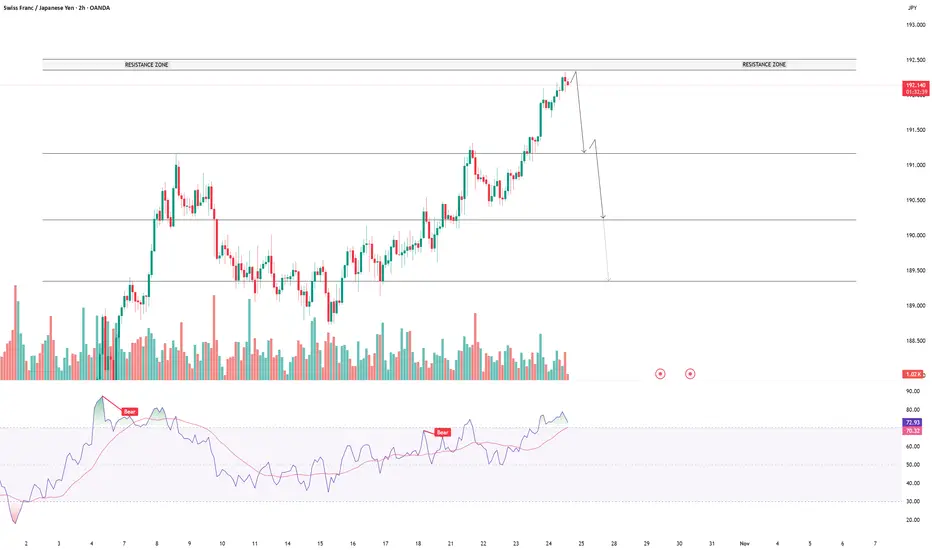
CHFJPY - TRADING NEAR REVERSAL ZONESymbol - CHFJPY
The CHFJPY pair continues to maintain its upward trajectory, supported by fundamental factors. The pair remains within a broad bullish trend, demonstrating strong resilience despite occasional corrective pullbacks.
The overall structure remains bullish but the pair is currently trading near local highs, which coincides with a potential reversal zone. After such an extended rally, there are high chances of a pullback or corrective phase before the next directional move. A short-term correction toward support could allow buyers to re-enter at more favorable levels. If the pair fails to gain momentum above the resistance zone 192.50 – 192.75, a retracement toward 191.20 – 190.50 could unfold.
Resistance levels: 192.50, 192.75
Support levels: 191.20, 190.50
A breakout and daily close above 192.80 may extend the bullish leg toward 193.50 - 194.00, while a confirmed rejection from the current resistance area could trigger a deeper pullback. Despite possible short-term weakness, the broader trend remains intact, supported by strong fundamentals and ongoing demand for safe-haven assets.
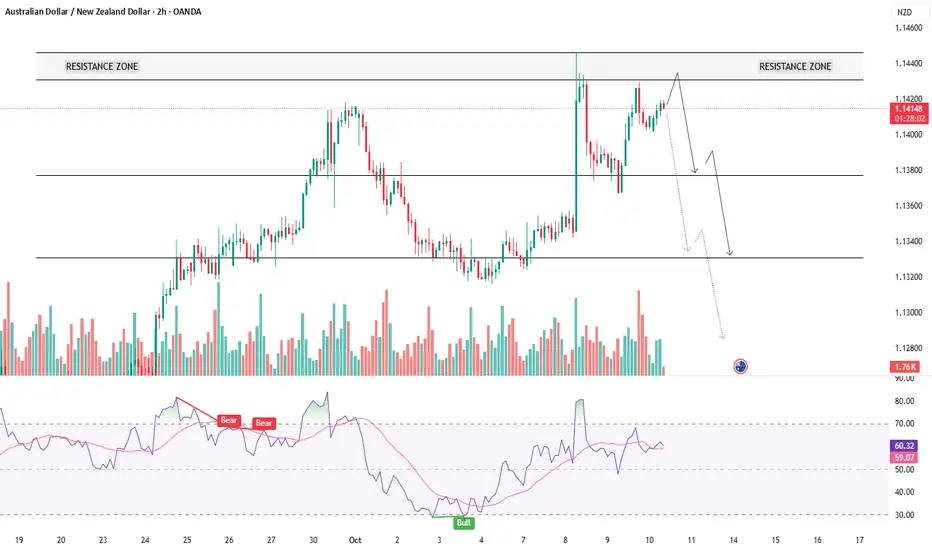
AUDNZD - READY FOR A REVERSAL?Symbol - AUDNZD
CMP - 1.14180
AUDNZD continues to maintain its upward trajectory, supported by fundamental divergence between the two economies. The Australian dollar remains resilient and continues to outperform the New Zealand dollar after the RBNZ implemented an aggressive 50 basis point rate cut, lowering the official cash rate to 2.5% - the lowest level in over three years. The central bank also signaled a willingness to ease further as the domestic economy continues to struggle.
Despite this fundamental backdrop favoring the Australian dollar, the currency pair is showing signs of exhaustion in its bullish momentum and now appears poised for a corrective phase. Selling pressure is becoming evident at higher levels, and if this activity intensifies, AUDNZD could transition into a deeper correction in the near term.
Resistance levels: 1.1430, 1.1455, 1.1472
Support levels: 1.1387, 1.1350
While the overall trend remains upward, the near-term bias has turned bearish as momentum wanes. However, if buyers manage to defend key support levels and regain control, a renewed cycle of bullish momentum may emerge - potentially extending toward higher resistance levels before a broader reversal unfolds.
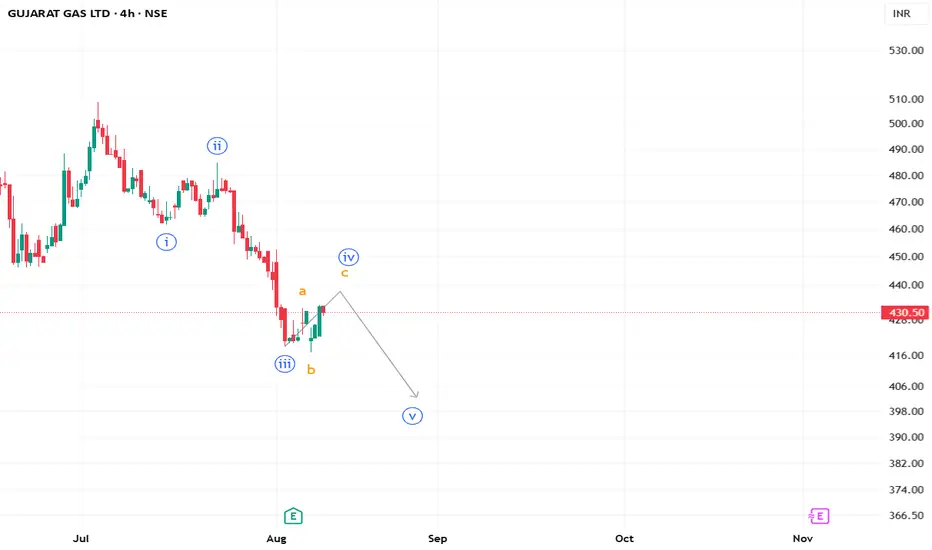
#Gujgasltd Elliott Wave Count Signals Potential Final Leg LowerBased on the 4-hour Elliott Wave analysis, Gujarat Gas appears to be in the final stages of a corrective Wave iv within a larger downtrend. The current price action suggests completion of an A-B-C structure for Wave iv, with the “c” wave nearing its top. If the count holds, the stock may soon resume its decline into Wave v, targeting lower lows before a potential trend reversal. Traders should watch for signs of weakness near current resistance to confirm the bearish continuation.
USDCHF - MORE DOWNSIDE ON THE HORIZON?Symbol - USDCHF
CMP - 0.8228
NZDCHF continues to weaken in response to the broader decline in the US dollar. The pair is currently testing the lower boundary of its trading range. A confirmed break below this level could pave the way toward the 0.8110 level.
USDCHF is exhibiting consolidation behavior, while simultaneously developing within a local descending channel. The pair is in the process of retesting support as part of its ongoing bearish movement. A consolidation phase is forming near the 0.8190 level, suggesting a potential pre-breakdown setup. The sustained depreciation of the US dollar is exerting downward pressure on the pair.
Prior to extending the decline, the price may temporarily retest the 0.5 Fib retracement level or fill the nearby Fair Value Gap (FVG)
Resistance levels: 0.8250, 0.8275
Support levels: 0.8190, 0.8117
The prevailing downward structure is likely to remain intact unless price action breaks decisively above the descending channel. As long as the pair consolidates near the lower end of the trading range, a short-term break below support is anticipated, potentially triggering a further decline toward the 0.8110-0.8050 zone.

NZDCAD - CAUGHT IN THE MIDDLE, INTRA-RANGE TRADINGSymbol - NZDCAD
NZDCAD continues to exhibit strength within a broadly neutral trading range, supported in part by a corrective pullback in the US dollar. However, the sustainability of this momentum remains uncertain as market participants await key upcoming events, including the FOMC meeting and a speech by Federal Reserve Chair Jerome Powell.
The primary focus remains on the current consolidation zone, where the pair is exhibiting a localized upward bias. Notably, liquidity accumulation near the 0.8315 level appears to be exerting a magnetic effect on price action. The recent correction in the US dollar has provided short-term support to the New Zealand dollar, contributing to the pair's recent gains.
Nevertheless, upcoming fundamental developments pose significant event risk. Market expectations suggest a potentially hawkish tone from the Federal Reserve, which could prompt a reversal in the prevailing trend. Given the current neutral range, there is an elevated risk of a false breakout, followed by a corrective move.
Key Resistance Levels: 0.8315
Key Support Levels: 0.8264, 0.8235, 0.8225
The 0.8315 liquidity zone may act as a temporary barrier or potential reversal point. Future price direction will likely hinge on the tone and content of forthcoming US economic data and Fed communications. Should the Federal Reserve adopt a more aggressive policy stance or signal intent to do so, the US dollar could regain strength, potentially weakening the NZD in the process.

VIRTUALUSDT SHOWDOWN - SUPPORT TESTED, BREAKDOWN AHEAD?Symbol - VIRTUALUSDT
CMP - 1.6620
VIRTUALUSDT is currently consolidating within the context of a broader uptrend, forming a defined trading range. However, emerging technical signals within this range suggest the potential for a trend reversal and subsequent decline.
Bitcoin, meanwhile, appears to be entering a corrective phase following its recent rally. This development is generally unfavorable for altcoins, which often struggle to gain momentum in the absence of strength from Bitcoin. VIRTUAL is exhibiting signs of consolidation, yet there is mounting pressure within the current structure, as evidenced by the clustering of resistance levels across the range. A key risk factor is the potential breakdown of market structure through a downward exit from the ascending channel, marked by a breach of trendline support.
A renewed test of the key support level at 1.5810 could serve as a catalyst for a breakdown, potentially leading to a sharper decline. Below this threshold, there is a relatively unimpeded path toward the next significant target around 1.1780
Key Resistance Levels: 1.7200, 1.8290
Key Support Levels: 1.5810, 1.4160, 1.1780
Market participants should closely monitor the current trading range between 1.5810 and 1.8290, Persistent pressure on the support level at 1.5810, particularly in the context of a broken uptrend, constitutes a bearish signal. A decisive breach and subsequent consolidation below this level may prompt liquidation events, accelerating a move toward the fair value gap (FVG) or liquidity zone near 1.1780

HEAD & SHOULDERS IN GOLD - WATCH THAT NECKLINESymbol - XAUUSD
CMP - 3288
Gold, after a sharp decline, is now trading and consolidating at important levels. The recent movement follows a strong sell-off as geopolitical and tariff-related issues between the US and China began to ease. This decline pushed gold back from its all-time high of 3500, with the metal currently hovering near key support.
The market remains cautious, with attention shifting toward potential shifts in FED policy and broader macroeconomic cues.
A Head & Shoulders pattern is in formation, with gold currently testing its neckline around the critical support zone of 3300–3287. A breakdown and retest of this level may trigger further downside momentum, potentially opening the path toward 3220 and 3075 on a positional basis.
Key Resistance Levels: 3300, 3317
Key Support Levels: 3288, 3215, 3122, 3075
From a technical perspective, gold remains within a corrective structure, maintaining a bearish outlook. Attention is now on the Head & Shoulders neckline - if it breaks to the downside and retests, short positions can be initiated.

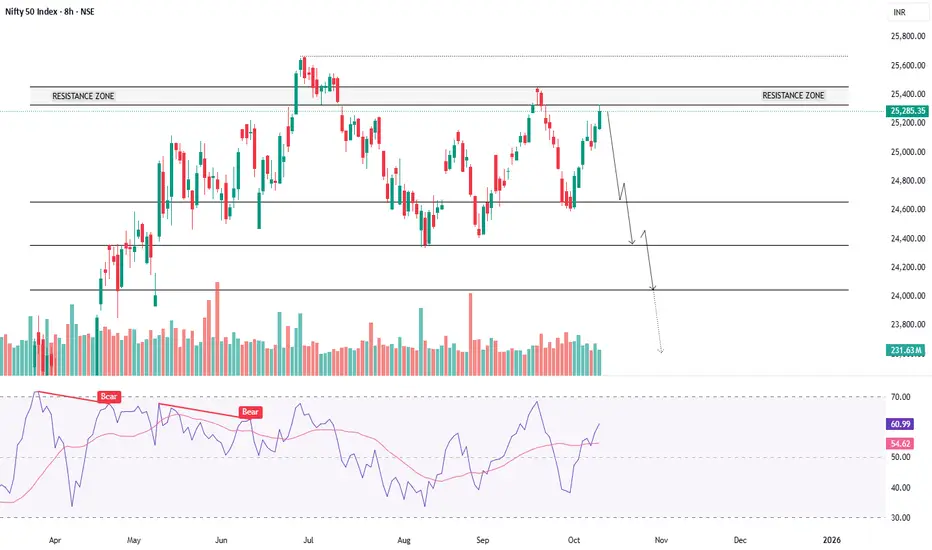
NIFTY ON THE EDGE - BEARISH PRESSURE MOUNTING NEAR 24250Symbol - NIFTY50
CMP - 24245
The Nifty50 index has encountered significant sell-off near the 26300 level, its all-time high from September 2024. Following this peak, the index experienced a notable correction, currently trading approximately 10% below its previous high. This decline has been attributed to factors such as disappointing corporate earnings, elevated valuations, and geopolitical uncertainties. Despite these challenges, the index has shown resilience, supported by strong performances in domestic sectors like financials, consumer staples, and healthcare.
If bearish pressures persist and buyers fails to maintain above 24300-24400 levels, a further decline towards the 23000-22900 levels could occur. Conversely, sustained move above 24550 could pave the way for a potential rally, contingent on improved earnings and favorable macroeconomic conditions.
Key Resistance Levels: 24320, 24400
Key Support Levels: 24000, 23780, 23350
In summary, the Nifty50's near-term trajectory hinges on its ability to navigate key support and resistance levels, with broader market sentiment and sectoral performances playing pivotal roles in shaping its path forward. In my personal view, I am expecting a down move, and the index is likely to remain under bearish pressure in the coming sessions, especially if it fails to hold above 24300-24400 levels.

POLUSDT - GEARING UP OR GIVING UP?Symbol - POLUSDT
POLUSDT is currently trading within a defined range, exhibiting a counter-trend rally amidst a broader downward trend. A significant liquidity zone lies ahead, which may influence price action in the near term.
A distribution pattern has emerged following a period of consolidation within the 0.1929 - 0.1750 range. The potential realization phase of this distribution may encounter resistance and possibly halt between 0.2280 and 0.2438, This scenario would be supported by signs of price exhaustion or a false breakout within this zone.
Despite the recent local strength observed in Bitcoin, POLUSDT remains fundamentally weak. On the daily timeframe, the asset continues to trade within a broader selling zone, suggesting the market is currently accumulating liquidity in preparation for a potential continuation of the downward movement.
From a technical standpoint, the ongoing upward correction may conclude with a false breakout at the resistance levels of either 0.2284 or 0.2438, potentially triggering a retracement or reversal.
Key Resistance Levels: 0.2284, 0.2438, 0.2465
Key Support Levels: 0.2061, 0.1929
Should the price approach these resistance levels at the current pace, market momentum may diminish, potentially leading to a corrective phase or even a reversal, in alignment with the prevailing macro trend.

GBPUSD - EYEING 1.3430 BARRIER - CORRECTION LIKELYSymbol - GBPUSD
CMP - 1.3406
The GBPUSD pair is gaining strength amid a broader rally driven by the ongoing decline in the US Dollar Index. This depreciation in the dollar is largely attributed to prevailing political dynamics in the United States, a shift in sentiment toward lower interest rates, and ongoing trade-related tensions. As a result, major currency pairs - particularly those within the dollar basket are experiencing upward momentum.
In this context, the British pound is appreciating and approaching a key resistance level at 1.3430, this area has not been tested since its last confirmation approximately six months ago and is characterized by significant liquidity, which may initially hinder further upward movement.
Key Resistance Level: 1.3430
Key Support Levels: 1.3292, 1.3207
Should the price approach this resistance sharply and fail to break through decisively - potentially forming a false breakout, there may be a subsequent corrective move. In such a scenario, a pullback toward the liquidity rich zone around 1.3292 could occur, especially if the pair fails to consolidate above 1.3430.

QUICKUSDT - FALSE BREAKOUT OF RESISTANCESymbol - QUICKUSDT
CMP - 0.0290
QUICKUSDT is currently exhibiting a counter-trend move toward the resistance level within the range of 0.0295, A false breakdown of this key level has occurred amidst the prevailing downtrend.
The cryptocurrency market is undergoing a period of significant challenges. While Bitcoin is testing new lows around 77K, altcoins are continuing their downward trajectory in search of additional support levels. Notably, QUICKUSDT stands out by testing a strong resistance/liquidity zone between 0.0284 and 0.0295, where a false breakout is forming.
However, in the morning session, Bitcoin shows signs of strengthening after a substantial decline, potentially exerting upward pressure on the broader market. As such, prior to any further decline, there may be another attempt to retest the 0.0295 level or update the false breakout tail around 0.0300 (0.7 Fibonacci retracement)
Key resistance levels: 0.0285, 0.0295, 0.0300
Key support levels: 0.0243, 0.0211
Should the next resistance retest result in a false breakdown with price consolidation below 0.0295, QUICK coin could continue its decline in the short to medium term.

NIFTY50 - DON'T MISTAKE THIS RALLY FOR A TREND REVERSALSymbol - NIFTY50
CMP - 23350.40
The Nifty50 is still trading within a bearish technical structure. As of now, the index is currently trading at 23350 after a strong up move. Given the ongoing downtrend and resistance levels, there is a strong possibility that Nifty may experience a pullback from these levels.
I had shared a trading idea on Nifty50 when it was trading around the 21900-22100 levels, stating that a retracement on the long side was due and that it could easily touch the 22800-23000 levels. Nifty gave a strong up move from those levels, and both targets have been reached.
Upon closer inspection of the Nifty chart, it is evident that the index is still in a downtrend, making lower lows since the beginning of its fall. We witnessed a sharp rally from the 21800-22000 zone, which is common in a bear market. Such sharp rallies are often misinterpreted as trend reversals, but in reality, the faster these rallies come, the quicker they tend to get sold.
The bearish structure remains intact and has not been broken. For now, Nifty still appears to be a sell on rise. For those following the trend, the 23300-23600 zone is the ideal range to go short, as this area aligns with a strong resistance zone and the formation of another swing high.
At this point, it seems likely that the market may consolidate between the 23300-23600 zone before showing a sharp down move. If the market does reverse its trend, we can only consider that possibility after a breakout above the 24000 zone, which would be a key signal for a trend shift.

GBPNZD - WATCH THE MEGAPHONE FOR A POTENTIAL DROPSymbol - GBPNZD
CMP - 2.2790
GBPNZD is currently forming a megaphone pattern and is trading near its upper boundary which is a resistance area. This pattern, characterized by increasing volatility and wider price swings, suggests potential reversal points in the market. A false break of resistance may occur before a potential price drop from the trendline resistance area.
On the daily chart, the overall structure appears ready for a bearish reversal, with market dynamics influenced by broader global factors, including the recent rebound in the US dollar. After a false breakout of the resistance, a correction is likely to take place. The price may test the imbalance zone or revisit the previously broken resistance before continuing its decline, following the capture of liquidity. The broader trend remains neutral for now, so it's crucial to focus on key local support levels as potential targets.
Resistance levels: 2.2815, 2.2850
Support levels: 2.2600, 2.2435
A retest of the upper range of the megaphone pattern or the area between 2.2815 and 2.2850 is possible. However, any movement of the price below the trendline resistance, accompanied by consolidation in the selling zone, could trigger further downside movement.

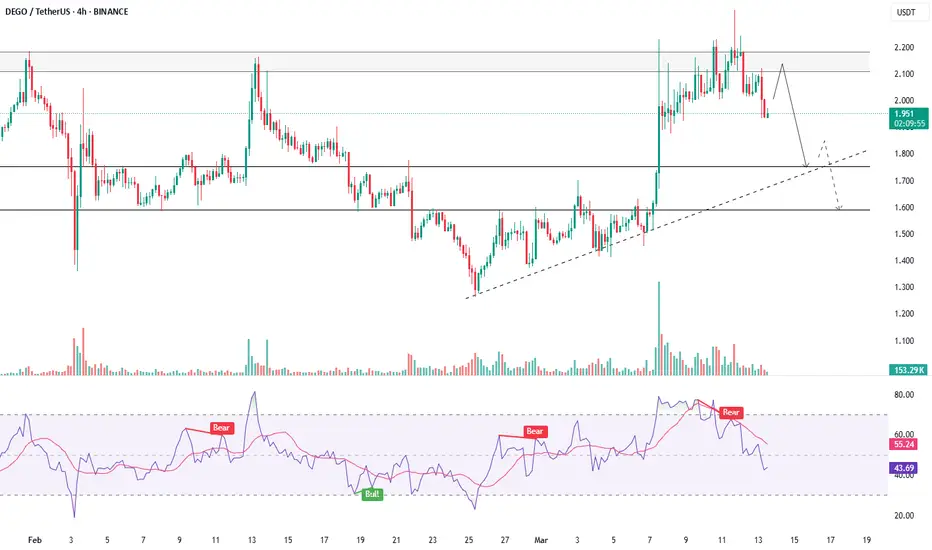
DEGOUSDT - SHORT BIAS AMID WEAK CRYPTO MARKET CONDITIONSSymbol - DEGOUSDT
CMP - 1.970
DEGOUSDT attempted to break its prevailing trend but encountered significant resistance and was further impacted by a weak cryptocurrency market. The downward movement may persist.
Following the breakout from the descending channel's resistance, a bullish momentum of 45% was established. However, the price faced strong resistance between 2.110 and 2.180, resulting in the formation of a trading range. Sellers are determined to maintain control over this zone and exert pressure. After a prolonged battle for this level, a false breakout of resistance occurred, leading to liquidation when the 2.000 support level was breached. Buyers are now in a state of panic. Should the price remain below the 2.110 - 2.180 range, a further decline in the short to medium term is likely.
Resistance Levels: 2.000, 2.180, 2.274
Support Levels: 1.750, 1.584, 1.359
The overall market remains weak, with altcoins reacting strongly to Bitcoin's short-term fluctuations. This behavior suggests that the market is accumulating liquidity in anticipation of a further decline. Bitcoin has yet to reach its key target, and the absence of a bullish catalyst continue to place downward pressure on altcoins.
LAYERUSDT - TIME FOR REVERSAL?Symbol - LAYERUSDT
CMP - 1.4200
LAYERUSDT is currently exhibiting a consolidation phase within an ongoing uptrend. The asset is outperforming the broader market; however, the initial reaction to the significant resistance at 1.4200 may result in a false breakout, followed by a retracement towards 1.275 or the 0.5 Fibonacci level.
Since the start of the session, LAYERUSDT has surpassed its daily Average True Range (ATR). However, upon encountering resistance, the coin may lack the momentum required for sustained upward movement. Liquidity in the vicinity of the 1.4200 level could serve to restrict price action, hindering the asset’s ability to break through this barrier on the first attempt.
At present, Bitcoin is testing its trend resistance, which could potentially lead to a reversal or continuation of its current downtrend, influencing altcoin prices accordingly.
Resistance levels: 1.4200, 1.4900
Support levels: 1.2932, 1.2747
The outcome hinges on the price's response at the 1.400 level. A sharp and distributive approach, with a high probability, is expected to result in a false breakout and a correction towards the aforementioned support levels. However, should LAYERUSDT show signs of slowing down and consolidating near 1.4000, there could be an attempt at a breakout, with further price movement dependent on the outcome of that attempt.

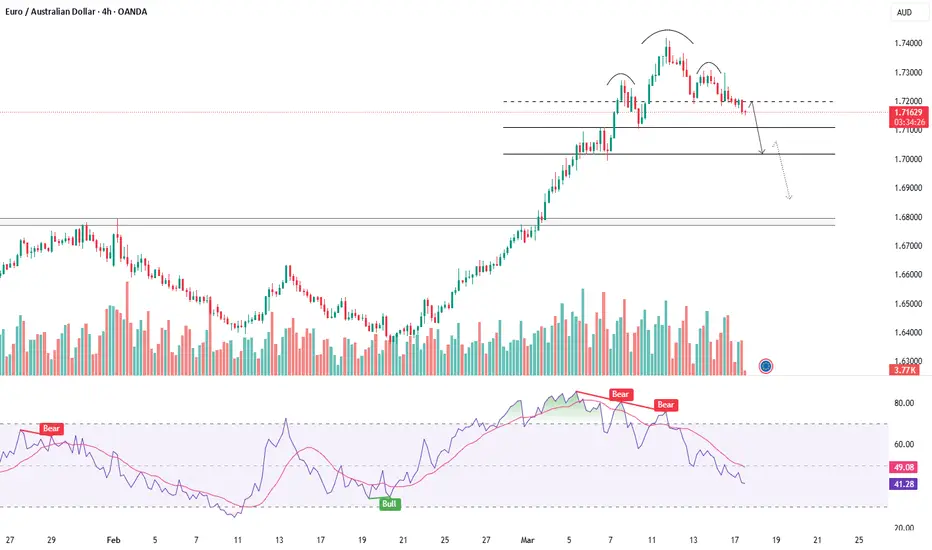
EURAUD - IS THE DOWNTREND ABOUT TO KICK OFF?Symbol - EURAUD
The EURAUD pair is currently testing a key resistance level on the weekly chart. A false breakout has occurred following a liquidity sweep, with no apparent continuation of the bullish trend. Additionally, the chart is displaying a familiar pin-bar reversal pattern.
After the price exited the consolidation range, which was capped by the 1.6787 resistance level, a distribution pattern began to form, targeting liquidity located just above the weekly resistance at 1.7196. This target has now been reached, and the price is consolidating beneath the base of the reversal structure, signaling the potential for further downward movement. There is a likelihood of either liquidation or a downward impulse toward the 1.7100 - 1.7000 zone. The forex market has exhibited a relatively calm demeanor since the week's opening, allowing technical factors to dominate market behavior until fundamental influences come into play.
Key resistance levels: 1.7196, 1.7304
Key support levels: 1.7107, 1.7016
Interest lies in the areas just below the local lows; however, from a technical standpoint, the market is primarily focused on liquidity beyond the 1.6787 level. Given that there are no significant barriers beneath 1.7016, a break of this support would likely open up a clear path towards the next liquidity zone.
SOLVUSDT - RETEST OF RESISTANCE IN A BEARISH TRENDSymbol - SOLVUSDT
CMP - 0.0430
SOLVUSDT is currently consolidating within a neutral range, which has emerged amid an ongoing downtrend. The cryptocurrency market has swiftly retreated following the news from Sunday. Bitcoin has re-entered the selling zone, falling below the 90K level. A continued decline in Bitcoin could exert downward pressure on the broader market.
SOLV is forming a range between 0.044 and 0.0292, with the price showing signs of strengthening toward the key liquidity and interest zones. Given the prevailing market conditions - including the downtrend, a weak market sentiment, the lack of a strong catalyst, and Bitcoin's decline - it is reasonable to assume that the coin has limited potential for further upward movement. The current price action may result in a false breakout of resistance, followed by a decline.
Resistance levels: 0.0436, 0.0439, 0.0494
Support levels: 0.0369, 0.0345
Considering the daily ATR from the session's open, it is expected that the volatility will be exhausted by the time resistance is reached, leaving little room for a breakout. There is a high probability of a price retracement from the 0.0436-0.0439 range, with the price likely to fall towards the key support zones below.

DOW JONES - TRIANGLE AT RESISTANCE - EXPECTING SELL OFFSymbol - DJI
CMP - 44593
The Dow Jones Industrial Average is currently trading within a symmetrical triangle pattern, indicating a period of consolidation. This technical structure suggests that the price is experiencing a balance between buyers and sellers, with no clear directional bias in the immediate short term. The breakout of this triangle, whether upwards or downwards, will likely determine the next significant move in the market. At present, my personal bias is towards the downside, anticipating a potential bearish breakout.
Currently, the key resistance zone for the Dow Jones lies between 44900 - 45100. This range is proving to be a formidable barrier for upward price movement. Until this zone is decisively broken to the upside, the continuation of the bullish trend appears unlikely. The market is facing significant resistance, and it seems that for any sustained bullish momentum, a strong move above this level is required.
If the triangle pattern breaks downwards, it could signal a correction that may lead the price to form a double top pattern on the larger time frame. A double top is a classic bearish reversal pattern, and its formation would likely confirm a shift from the prevailing bullish trend to a more bearish outlook. In this scenario, traders should be cautious of further downside risks, especially if the price breaks key support levels.
However, if the price manages to break above the resistance zone of 45100 and sustains that move, the bullish trend would likely continue, and any short positions would be invalidated. A breakout above this key resistance would indicate a strong continuation of the uptrend, signaling that the market is poised for further gains.

GBPCHF - LIKELY TO REMAIN RANGE BOUNDSymbol - GBPCHF
CMP - 1.1388
The GBPCHF pair has been consolidating within a range for the past 6 months, and it is expected to remain within this range for some time. Currently, the pair is testing the upper resistance zone of this range, which has acted as a cap on price movements. As a result, I expect the price to fall back within the range from here.
Trader's focus should be on the price action near the resistance zone. Given that the pair is currently at a critical point, it offers a good opportunity for a short trade as the risk-reward ratio is very favorable. A rejection from this resistance could see the price moving lower, providing an opportunity for traders looking for a pullback within the range.
If the price breaks above 1.1400 - 1.1410 and sustains above this level, the market outlook will shift. In that case, we may witness a breakout of the current range, with bullish momentum potentially taking over.
Resistance levels: 1.1400, 1.1375
Support level: 1.1270, 1.1215
Given the current resistance and the likelihood of a reversal within the range, the short trade setup offers a solid potential for a good profit. However, any decisive break above 1.1400 will change the market structure, signaling a potential shift to bullish momentum.

CAKEUSDT - BULLISH REVERSAL OR TRAP? - EXPECTING SELL OFFSymbol - CAKEUSDT
CMP - 2.570
CAKEUSDT is currently experiencing a false breakdown of critical resistance levels, indicative of a bullish rally. The potential further decline in altcoins may be influenced by Bitcoin's ongoing weakness. Technically, the movement in CAKE appears to be a counter-trend strategy, aiming to accumulate liquidity before a possible decline. The altcoin market remains fragile, with most coins still searching for a bottom, while Bitcoin is consolidating but shows signs of a potential decline toward the 91K-90K range.
CAKEUSDT is currently focused on the 2.614 - 2.728 range. If the bears maintain control and keep the price below these levels, the coin may experience a downward trend in the short to medium term.
Resistance levels: 2.614, 2.728
Support levels: 2.420, 2.063
Statistical analysis suggests that a false breakdown often leads to significant market movements, potentially even trend reversals. In this instance, the current movement is a counter-trend maneuver, and if the price experiences a local reversal, the coin will likely be subjected to downward pressure from the prevailing trend. A sustained price drop below 2.614 could intensify the decline, targeting 2.420, 2.060, and 1.040 levels.

MANAPPURAM FINANCE LTD - APPROACHING RESISTANCE AREASymbol - MANAPPURAM
Manappuram Finance Ltd. has been experiencing a recovery from lower levels in recent weeks. The stock has bounced back from support zones and is now testing key resistance areas. However, it faces considerable challenges at higher levels, showing signs of consolidation as it approaches its resistance zones.
The overall trend appears to be in recovery, following a significant dip. However, the stock is facing resistance at higher levels, indicating a potential pause or consolidation before any significant movement.
Short-term trend looks slightly bearish, as the stock has encountered selling pressure at resistance levels and is currently consolidating. Long-term trend remains positive, driven by the company’s strong fundamentals in the gold loan market.
The stock is currently trading within an ascending triangle pattern and is consolidating near key resistance levels. My personal bias is towards the downside, and we could potentially see a sell-off from the resistance zone towards the triangle support trendline, with the possibility of a move below it.
The trade strategy could involve looking for short opportunities near the resistance zone, especially if the stock fails to break out and begins to reverse. However, if the stock manages to break above the resistance trendline of the ascending triangle, the bias would shift to the upside.
Disclaimer - Do not consider this as a buy/sell recommendation. I'm sharing my analysis & my trading position. You can track it for educational purposes. Thanks!

IPCA LABORATORIES - RETEST OF SUPPORT BREAKDOWNSymbol - IPCALAB
Ipca Laboratories has recently experienced notable price movements, trading near resistance levels after a good pullback from lower levels. Currently, the stock is trading near major resistance zone, which follows a period of strong recovery from its earlier lows. However, the trend appears bearish, and the sentiment is negative. This increases the likelihood of a sell-off from the ₹1500-₹1540 resistance zone, where the stock may face significant selling pressure.
Despite the recent price recovery, the stock is encountering selling pressure near these resistance levels, reflecting a similar trend seen in many healthcare stocks due to changing investor sentiments. As with other pharmaceutical companies, the stock could face volatility due to external factors such as regulatory updates, changes in pricing strategies, or new competition in the market.
Despite short-term fluctuations, the stock remains resilient due to strong fundamentals and an ongoing focus on key therapeutic segments. However, the short-term outlook might face a correction. This could trigger a move towards lower levels, but long-term growth remains intact based on strong earnings prospects and solid market positioning.
Key Resistance levels: ₹1500, ₹1540, ₹1548
Key Support levels: ₹1460, ₹1434, ₹1400
There are no signs of a significant trend reversal, and growth could resume from lower levels should the stock maintain its strong performance fundamentals.
Disclaimer - Do not consider this as a buy/sell recommendation. I'm sharing my analysis & my trading position. You can track it for educational purposes. Thanks!
