SHRIRAM FINANCE CHART ANYLYSISShriram Finance has major support from last 1Month but getting Trendline Rejection Again & Again .
Now Its Major Support level and we can see big move either of the Side if any get Broken Or BreakDown
Shriramtransportfinance

SHRIRAM FINANCE CHART ANYLYSISShriram Transport Finance on Daily Time Frame Candle Make Bullish
Harami
And also on 5Min Time Frame Make Postiver Candle at Major Support
Looks Good For Next Session

shriram finance best time to buy shriram finance best time to buy capital gain as well as the Dividend of 15/- per share
record date January 4, 2023

SR trans - Cup & Handle BreakoutCup & Handle brokeout with high volume & strong closing. Now its pullback & retesting the Upward Trend Line.

BULLISH on SRTRANSFINNSE:SRTRANSFIN
The price has given the breakout from the wedge pattern after giving the breakout from the Triangle pattern. Other Information is given in the chart.

Shriram transport inverted head and shoulderShriram Transport testing its neckline
A close above 1300 can have further upside
inverted head and shoulder pattern
stay tuned

Shriram Transport Chart Analysis !!📈 Shriram Transport 📉
This Stock Broke out from a Resistance zone of 1140-1155 after testing two times this range on upside with a strong green candle. If you look closely this resistance also use to be a support in Dec Jan Fab. So It makes this a Strong breakout.
You Can Ride This Stock for Long run.
Bias - Long
Target - 1283, 1402, 1505, 1667
SL - 1085
RR- 1 : 5
All Important Supports and Resistances are drawn in chart. All levels are on closing basis.
Please have a look and revert back if you need some more study on it.
Disclaimer : Consult Your Financial Advisor Before Taking Any Decision On This Analysis.

At 12 year old support!Chart is self explanatory.
Disclaimer - I am not a SEBI registered adviser. All the information provided by me are for educational/informational purposes only.

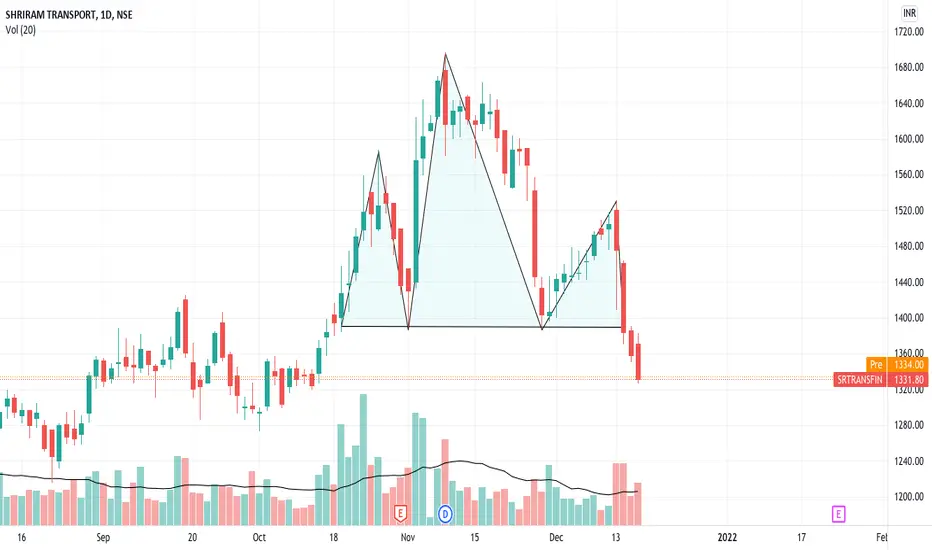
Shriram Transport Finance (D) - Head & Shoulders Chart PatternShriram Transport Finance (Daily)
Head & Shoulders Chart Pattern
Lower bollinger band is challenged
MACD of the daily wave and weekly tide is downtick
RSI is below 40 in the oversold zone
Stochastic 14,3,3 is in negative crossover and oversold zone
-DI is above +DI and ADX is above 15 in the Directional Movement Index (DMI)
Seems to be in the C wave currently
Look for the next major support below on the chart as Target 1
SHRIRAM TRANSPORT- All time high 1625, wait for break to buy.SHRIRAM TRANSPORT- All time high is 1625, wait for break above it and then either stall above it or weak pullback to buy. 1625 is a major resistance, supply is expected from this level. Sell near resistance and buy near support.
This 1550 zone should be used to book profit, not to go long or short.
By buying here one may win this time but buying below resistance is a definite loosing strategy, one will lose over many trades.

Shriram Transport Finance: Start of a new Bull RunBuy near ₹ 1400 with a stop loss of ₹ 1395
Target ₹ 1600
Happy Investing

Breakout in Shriram Transport Finance...Chart is self explanatory. Entry, Targets and Stop Loss are mentioned on the chart.
Disclaimer: This is for demonstration and educational purpose only. This is not buying or selling recommendations. I am not SEBI registered. Please consult your financial advisor before taking any trade.

SRTRANSFIN Trade Setup For TomorrowShriram Transport Finance has already given the breakout, as you can see in the chart.
.
There is a strong resistance of 1426, two times stock tested the level and then given the breakout.
.
Now for tomorrow you can buy this trade once it goes 1442, for the target of 1470.
.
Note: Avoid the trade if stock gives gap up opening.
.
Don't forget to like the post.

SHRI RAM TRANSPORT FINANCEshare name shri ram transport finance
why i buy this share ?
-rounding bottom
-forming a range above resistance
(resistance becomes support)
-consolidation is a good sign
-targets 2800(if rounding bottom get done)
- maintain a stop loss of 1200
- best price to buy is around 1300
thanks

Shriram Transport Finance - 1600+ coming soon...Wave 4 is getting completed and soon Wave 5 to start to take it to higher targets of 1600++ with SL of 1140/-

Shriram Transport- A Long Candidate With a Potential 25% UpsideFolks,
Shriram Transport may have just completed a Triangle in the form of Wave 4th (Wave count in Blue) and now about to start it's journey for the 5th up, as depicted on the chart.
An easy target could be placed at the 38.2% extension which is at 1750 (and maybe beyond) which is a 25% upside .
A word of advice as always, tread cautiously and work with a tight stop loss, since the up-move will mark the completion of an Impulse of a large degree.
Please don't forget to 'Like', or a word of encouragement would be fulfilling too, for the hours of research that I put in before I publish any of my work :)
Cheers !!
Note: This view shall be invalidated if the price goes below 1330 with force.

Late night Technical analysis talk 👑 Terms used if you don't know :
✣ Contraction pattern: A pattern starting with a broadening high candlestick and low candlestick and converging to a fixed point, these highs and lows created in between them are bulls vs bears fight going on inside the pattern and if it comes to the lower part of it, surely bulls will take it to the topmost point and vice-versa until one of them wins
✣ Structure and trend: Two types of trends that exist in the market today are uptrends and downtrends. Each type of trend tells a different story and has its own impact on a trader's success in the market. While uptrends show a series of higher highs and higher lows, downtrends show lower highs and lower lows
✣Breakout: Breakouts are commonly associated with ranges or other chart patterns, including triangles( HERE WE WILL SEE THIS ONE ), flags, wedges , and head-and-shoulders. These patterns are formed when the price moves in a specific way which results in well-defined support and/or resistance levels. Traders then watch these levels for breakouts
✣ RSI DIVERGENCE: A bullish divergence occurs when the RSI creates an oversold reading followed by a higher low that matches correspondingly lower lows in the price. This indicates rising bullish momentum, and a break above oversold territory could be used to trigger a new long position.
✣ Supply/ Demand: In the supply zone , the prices are higher than the bid price, and in the demand zone , they are lower. The bid price is what a trader is willing to pay for a stock
👑 Important levels - explained well
👑 Comment your thoughts and queries regarding anything on this analysis of mine, feel free buddy :)
⌛ Motivational and psychological area ⌛
✣Trade only if you are in the right mindset, if you have been emotionally weak for some time, take your time and don't trade, trade with a happy and + mindset only.
✣If you want to make money, firstly be prepared to lose it, only that much which you can afford and that much by which you can make a mistake again, learn from them and grow
✣Don't lose hope and keep grinding
✣I have seen my friends on youtube streaming games with watching 10, constantly they streamed for a year or two and now they are buzzing with 1k to 2k watching daily.
✣Focus on the process, you are here to make money not stupid decisions and lose it all
✣No one will help you climb the mountain, few will tell the path, so follow good people, make good mentors and make good decisions and choices in the stock market.
✣Believe in yourself :)
🎓🎓 Some info about me :)
➼My name is Apoorv and I am a 2nd year Engineering student, I want to pursue trading as my career, and thus whatsoever setups or trades I potentially see on my charting platform, I post it here and share them with you all.
➼I hope you will love my simple analysis style.
➼Feel free to suggest your view on this as learning is earning here :)
➼I take my trades on my Zerodha account :)
➼I don't take all the trades I post
➼These charts are my and only my work, my thought process, just from an educational point of view and no calls.

SHRIRAM TRANSPORT FIN--> Getting ready for future breakoutThe above references an opinion and is for information purposes only. It is not intended to be investment advice. Seek a duly licensed professional for investment advice.


Shri Ram Transport Fin. Bearish Trend !TREND ANALYSIS & TRADE SETUP !
WAVE ANALYSIS !!
Follow Chart Instruction.
Do not be Hurry for entry.
Wait for Proper Entry Setup.
Buy/Sell with Best Risk Reward.
Educational Chart Only.
Wait for ENTRY CONFIRMATION !
Risk:Reward: 8-10 times.


SRTRANSFIN- Weekly chart
- Poised for ATH Breakout
- Looks good for swing/positional trade if sustains above resistance line
- Manage risk using stoploss and position sizing
