Siemens Down to Support zone??!!Siemens has been travelling inside a Ascending Expanding Channel Pattern(bold yellow line) from March 2025( making higher highs and higher lows )
Now it is in the down move to making a higher low (to support level)
This down move is being done by market in the form of Descending channel pattern making lower highs and lower lows(shown as purple line)
There is also a Head & Shoulders pattern ...which has given BREAKDOWN with Good Volume support (yesterday-13-10-2025)
Siemens is looking to take support at 2900 levels(2920)
SL can be bit choppy (either the high of Breakdown candle/high of right shoulder)
Bearish view can be negated once the red dotted line breaks!!!
Let's wait and watch!!!
Thank you!!!!
Just my view...not a tip nor advice!!!!
SIEMENS

Nifty: Balance Still Intact — Rotation Is Quietly Taking ShapeToday’s NSE:NIFTY action again needs to be read calmly.
This was not a breakdown session.
It was another day of controlled rotation inside a well-defined range.
You can see on the chart that even candle looking bearish, buyers are present. 💡( That Green Label on the Candle)
Across intraday timeframes, price drifted lower but without momentum expansion.
No panic candles.
No aggressive follow-through selling.
Just slow, overlapping price action.
That tells us sellers are present, but not in control.
On the daily chart, NIFTY continues to hold above the broader demand zone.
The bullish structure is still intact.
This is time based correction and not price based.
That distinction matters more than the red candle.
💡 For tomorrow, the market’s task remains simple — confirm support or test it once more.
Two scenarios have higher probability:
Scenario 1:
The index holds the 26100–26150 zone and starts compressing again.
Stability here keeps the range intact and preserves the possibility of another upside attempt.
Scenario 2:
The market dips toward the 26000–26050 zone and buyers respond.
A controlled dip followed by acceptance would be constructive and offer better risk-reward for selective longs.
⚠️ The risk scenario to watch:
If NIFTY starts sustaining below 25950,
then this balance phase can shift into a deeper consolidation and momentum will pause.
Intraday bias for tomorrow:
Bias remains neutral to mildly positive as long as price holds above 26000 with acceptance.
This is still not a chasing market.
Trades should be taken only near support, after price slows down.
Now, the important part — where momentum is quietly building.
While the index is digesting, money is rotating selectively into Capital Goods / Infrastructure names.
This is typical behaviour during index consolidation phases.
Leadership starts emerging before the index itself resolves.
Within this sector, two stocks stand out for the next session:
1. NSE:LT
L&T is behaving like a true leader.
Pullbacks are getting absorbed quickly.
Price is holding above short-term supports without distribution near highs.
This is the kind of stock that usually moves first when the index stabilizes.
2. NSE:SIEMENS
Siemens is showing constructive price action.
Relative strength versus NIFTY is improving, not fading.
Approach for these stocks remains the same:
No chasing.
Either buy dips into support with stabilization
or act only on clean breakouts with acceptance.
Overall market mood is balanced, not weak.
This phase rewards selection and patience, not activity.
Let support show itself.
Let leadership confirm.
Then act.
That’s all for today.
Stay process-driven, not opinion-driven.
Have a focused and disciplined trading day ahead.
📊 Levels at a glance:
Support zone: 26100–26150
Major support: 26000–26050
Immediate resistance: 26280–26320
Risk level: Below 25950
Bias: Neutral to mildly positive, trade near support only
High-momentum sector focus: Capital Goods / Infrastructure
Top stocks to track: Larsen & Toubro, Siemens India

Trend Channels and Bullish Breakouts: SIEMENS LIMITED📈 Understanding Flat Trend Channels and Bullish Breakouts: The Case of Siemens Limited
1. What is a Flat Trend Channel?
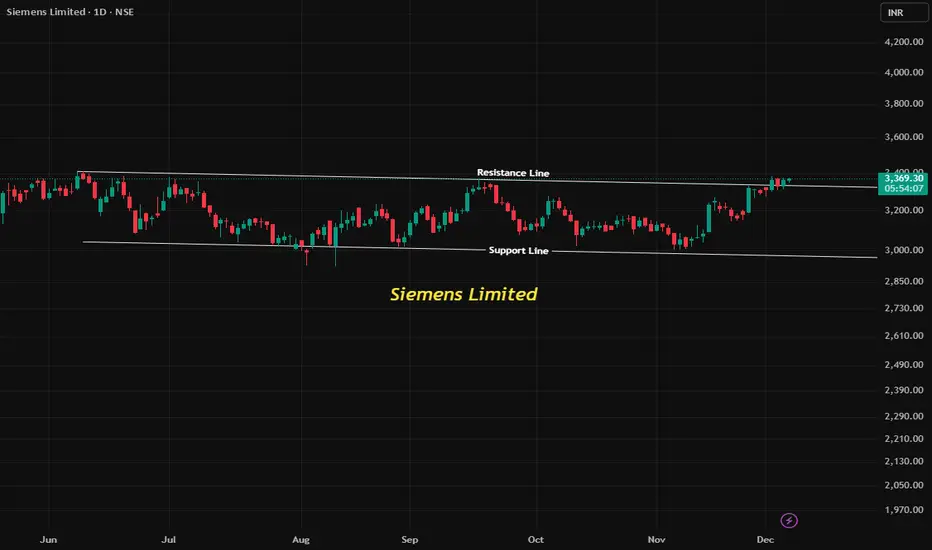
A Flat Trend Channel is a price pattern where a stock moves sideways between two parallel lines — the resistance line (upper boundary) and the support line (lower boundary).
Traders often call this a range-bound market. Prices oscillate within the channel, reflecting indecision between buyers and sellers.
Key features:
a. Resistance line: The ceiling where price repeatedly fails to move higher.
b. Support line: The floor where price repeatedly finds buying interest.
c. Flat nature: Both lines are horizontal, showing no clear uptrend or downtrend.
👉 In Siemens Limited, since June 2025, the stock was consolidating in such a flat channel, capped by resistance around ₹3350.
2. Bullish Breakout from a Flat Channel
A Bullish Breakout occurs when price decisively moves above the resistance line with strong volume and momentum.
This signals that buyers have overwhelmed sellers, often leading to a new upward trend.
Textbook confirmation includes:
Close above resistance on daily chart.
Volume expansion supporting the breakout.
Follow-through candles sustaining above the breakout zone.
👉 Siemens Limited has now closed above ₹3355, confirming a breakout from its flat channel. This shifts the bias from neutral to bullish.
3. Stop Loss and Target: How to Place ? Trading channels requires disciplined risk management. Here’s how traders typically set levels:
a) Enter on breakout candle close above resistance
b) Stop Loss Just below the support or breakout level (below channel support)
c) Target 1 Height of the channel added to breakout point
d) Target 2 Next major resistance zone/ historical supply area
Stop Loss ensures protection if breakout fails (false breakout).
Target is calculated using channel height projection — a classic method in technical analysis.
Siemens Limited’s breakout is a real-world example of how flat channels evolve into trending moves.
4. Traders can use this setup to:
a) Enter long positions above breakout.
b) Place stop loss below support to manage risk.
c) Aim for targets based on channel height and next resistance zones.
This is a textbook bullish breakout opportunity, demonstrating how theory translates into practice.
5. Key Takeaways
a) Flat channels represent consolidation and indecision.
b) Breakouts signal fresh momentum and trend initiation.
c) Stop loss and target placement are essential for disciplined trading.
d) Siemens Limited’s breakout above ₹3355 offers a practical case study of these principles.
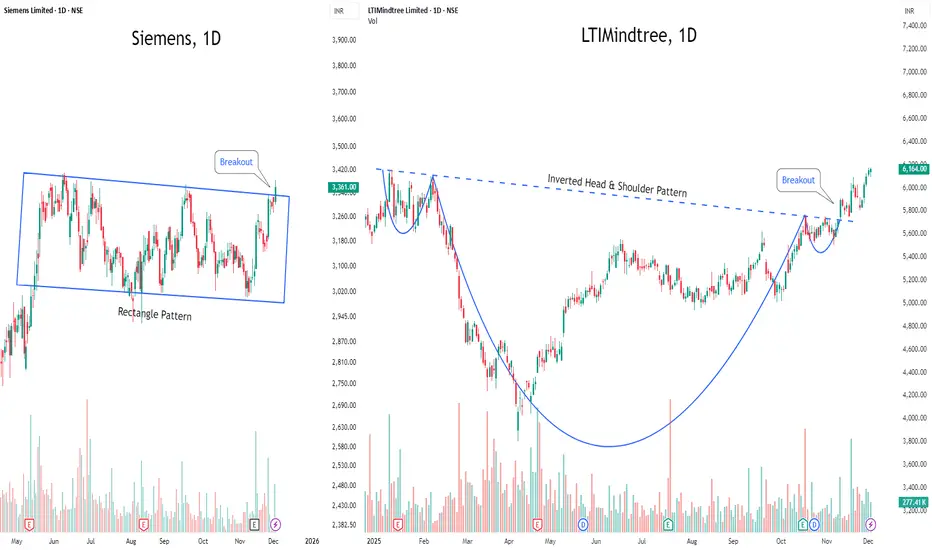
Breakout Radar: Two Stocks Turning Up the Heat This Week1️⃣ SIEMENS NSE:SIEMENS — Quiet No More
After chilling inside a rectangle range, SIEMENS just stepped out with a clean breakout.
The consolidation phase is done — now the chart is hinting at fresh upside energy. Momentum is officially back on the table. ⚡📈
2️⃣ LTIMINDTREE NSE:LTIM — Reversal Royalty
This one spent weeks building a textbook Inverted Head & Shoulder — and now it’s broken the neckline with style.
The breakout looks solid, and the stock is gearing up for a potential upside rally. 🚀💫
🔥 Two strong chart setups.
🔥 Two momentum-packed breakouts.
Perfect picks for traders eyeing action this week.
SIEMENS: High-Volume Bullish Reversal Breakout________________________________________
💹 Siemens Ltd (NSE: SIEMENS)
Sector: Capital Goods | CMP: 3232.60 | View: High-Volume Bullish Reversal Breakout
Chart Pattern: Falling Wedge
Candlestick Pattern: Bullish Marubozu
Swing High: 3368
Swing Low: 2925
________________________________________
HNI Trade Analysis:
Bullish Breakout Zone: 3232.6 - 3242
Stop Loss: 3094.44
Low-Risk Entry Zone: 3205
Stop Loss: 3051.17
A decisive wide-range bullish candle with extremely high volume signals aggressive institutional accumulation. Price has broken above the recent micro-range, validating the bullish retracement reversal.
________________________________________
STWP Trade Analysis:
Breakout Level: 3242
Stop Loss: 3094.44
Structure: Strong Bullish Candle + High Volume + Reversal Confirmation
Note: Multi-day compression has triggered a high-probability expansion phase.
________________________________________
Resistances: 3285.27 | 3337.93 | 3433.87
Supports: 3136.67 | 3040.73 | 2988.07
________________________________________
STWP Stock Analysis (Brief Synopsis):
Siemens has delivered a powerful bullish reversal breakout after weeks of consolidation and downward drift, confirmed by a strong Marubozu candle supported by 1.56M volume, significantly above the average. Price has cleanly broken above its short-term declining trendline, reclaiming key levels with strong momentum. RSI has moved into a balanced-to-bullish zone near 62, MACD has triggered a fresh bullish crossover, and Stochastic signals sustained buyer strength.
The breakout also aligns with a Bollinger Band expansion, indicating volatility release from a low-compression phase. Multiple bullish triggers are present simultaneously — RSI breakout, EMA compression to expansion shift, ADX improvement, and volume surge — all hinting that institutional activity is backing the move.
Fibonacci retracement zones remain supportive, with price reclaiming the 23.6% (3029) and 38.2% (3094) levels and heading toward 61.8% (3198) and 78.6% (3273), which aligns with the current price zone.
Trend-wise, intraday timeframes (5m–1H) are fully bullish, while the daily timeframe has turned upward after a prolonged downtrend. The weekly remains corrective but improving. As long as Siemens sustains above 3136–3040, the bullish continuation bias stays intact.
Overall, Siemens now reflects a strong reversal breakout, backed by unusually high volume, renewed momentum, and multi-indicator convergence, favouring continuation toward upper resistance bands.
________________________________________
Final Outlook:
Momentum: Strong
Trend: Bullish (Short-Term) | Improving (Medium-Term)
Risk: Low
Volume: Very High (Institutional Footprints)
________________________________________
⚠️ Disclosure & Disclaimer – Please Read Carefully
The information shared here is exclusively for learning and educational purposes. This is not investment advice and should not be considered a buy or sell recommendation.
I am not a SEBI-registered investment adviser. All views are based purely on chart analysis and publicly available market data.
Financial markets involve risk, and traders must assess their own risk tolerance before taking any trade. Please consult a SEBI-registered financial adviser for investment decisions.
________________________________________
Position Status: No active position in (SIEMENS) at the time of analysis.
Data Source: TradingView & NSE India (Past Chart Reference).
________________________________________
💬 Found this useful?
🔼 Boost this post to help more traders learn structured price-action analysis.
✍️ Share your views or setups in the comments — let’s grow as disciplined traders.
🔁 Forward this to fellow learners who want clean technical frameworks.
👉 Follow for more high-quality, structured STWP breakdowns.
________________________________________
🚀 Stay Calm. Stay Clean. Trade With Patience.
Trade Smart | Learn Zones | Be Self-Reliant 📊
________________________________________

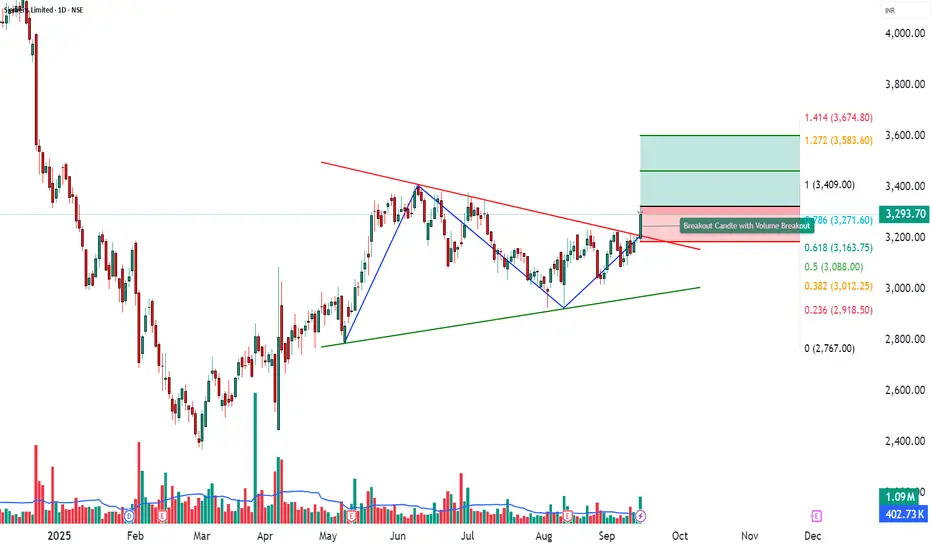
SIEMENS Analysis | Symmetrical Triangle Breakout Explained📊 SIEMENS Trade Analysis
🔎 Price Action
SIEMENS closed at ₹3293.7 with a solid +2.86% gain, backed by a volume of 10.95 lakh, well above its 20-day average of 4.02 lakh (VolX = 3.03x).
This sharp rise in activity highlights strong institutional participation, confirming bullish momentum and improving probability of continuation.
________________________________________
📉 Chart Signals – Symmetrical Triangle
Strong bullish candle backed by heavy volumes.
RSI breakout supporting positive momentum.
Bollinger Band squeeze + breakout → signals volatility expansion.
________________________________________
📍 Key Levels
Resistance: 3349 – 3404 – 3484
Support: 3214 – 3134 – 3079
________________________________________
📈 Investment Outlook
📈 Bullish Case – Why the stock could go up
Strong volume-led breakout (VolX = 3.03x).
Momentum indicators (RSI 62, CCI 193, Stochastic 89) suggest upside strength.
Sustained buying pressure may push stock toward ₹3464 – ₹3602.
📉 Bearish Case – Potential downside risks
Failure to sustain above ₹3325 could trigger profit booking.
Global or market-wide weakness may drag stock back toward supports.
Break below ₹3214 could shift bias to downside.
⚡ Momentum Case – Short-term Trading Edge
Volume surge + RSI breakout confirm short-term momentum.
Bollinger squeeze → strong volatility expansion.
Holding above 3349–3404 may open upside toward ₹3464–₹3602.
📅 Short-term vs Long-term Perspective
Short-term (1–2 weeks): Momentum-driven moves likely; watch resistances at 3349–3484 and supports at 3214–3134.
Long-term (1–3 months): Stock remains in an uptrend; sustained buying with strong volumes could establish higher base levels.
________________________________________
📝 STWP Trade Analysis
Outlook: Momentum: Strong, Trend: Bullish
Entry: 3325 – 3293.75 | Stop-loss: 3186.05
Target-1: 3463.95 | Target-2: 3602.9
Risk/Reward: 1:3.27 | Risk: Low | Volume: High
Demand zone: 3212 - 3181.50 | SL: 3177.50 - Could be a good Pullback zone
Learning Note: SIEMENS shows strong momentum with volume breakout; supports and resistances clearly define near-term trade zones.
________________________________________
⚠️ Disclaimer – Please Read Carefully
The information shared here is meant purely for learning and awareness. It is not a buy or sell recommendation and should not be taken as investment advice. I am not a SEBI-registered investment advisor, and all views expressed are based on personal study, chart patterns, and publicly available market data.
Trading — whether in stocks or options — carries risk. Markets can move unexpectedly, and losses can sometimes exceed the money you have invested. Past performance or past setups do not guarantee future results.
If you are a beginner, treat this as a guide to understand how the market works — practice on paper trades before risking real money. If you are experienced, always assess your own risk, position sizing, and strategy suitability before entering trades.
Consult a SEBI-registered financial advisor before making any real trading decision. By engaging with this content, you acknowledge full responsibility for your trades and investments.
💬 Found this useful?
🔼 Give this post a Boost to help more traders discover clean, structured learning.
✍️ Drop your thoughts, questions, or setups in the comments — let’s grow together!
🔁 Share with fellow traders and beginners to spread awareness.
👉 “If you liked this breakdown, follow for more clean, structured setups with discipline at the core.”
🚀 Stay Calm. Stay Clean. Trade With Patience.
Trade Smart | Learn Zones | Be Self-Reliant 📊
Siemens EnergySpotted a clean symmetrical triangle breakout on the 1 hour chart of Siemens Energy, hitting fresh all-time high. Took an entry at 3100 post-confirmation with strong volume support. Watching for targets around 3400 in the short term with SL near 3050. Looks like smart money stepping in!

SIEMENS LTD. – INTRADAY ZONE ANALYSIS________________________________________
📈 SIEMENS LTD. – INTRADAY ZONE ANALYSIS
📆 Date: July 1, 2025 | ⏱ Timeframe: 15-Minute Chart
🔍 Educational Analysis for Learning Purposes Only
________________________________________
📊 Zone Breakdown:
• 🔴 Top Range Resistance – 3,271.90
Marked in Red: This is a clearly defined supply zone where the price faced sharp rejection after testing highs. Bearish opportunity zone if a reversal pattern appears — watch for signs like bearish engulfing, double top, or rising volume + long upper wicks.
• 🟠 No Trade Zone – Around 3,225–3,260
Marked in Orange: This range has seen volatile, choppy action without clear bias. Traders may avoid fresh positions here unless directional strength emerges with volume confirmation.
• 🟢 Demand Zone – 3,182.60 to 3,165 | SL: 3,160.35
Marked in Green: Price reversed sharply from this area in the past with strong bullish candles. Acts as a low-risk buying area on retest with bullish confirmation. Risk-managed entries possible here.
• 🟩 Bottom Support – 3,101.10
Marked in Dark Green: Crucial structural support zone. Breakdown below this level could change the short-term trend to bearish. Currently a “last line of defense” for bulls.
________________________________________
🔍 Candlestick & Chart Pattern Observation:
✅ Bearish Rejection Near Top Zone:
A strong upper rejection candle (long wick) appeared right at the top resistance (3,271.90), followed by consistent lower highs and lower closes. This confirms seller presence. No double top yet, but early signs of a potential short-term top formation are visible.
✅ Bullish Reversal from Demand Zone:
The candle near 3,170 zone shows a sharp bullish engulfing move on higher volume — signaling potential institutional interest. This zone has repeatedly offered bounce opportunities.
📉 Volume Clue:
Volume expanded during the bounce from demand zone and tapered near resistance — confirming participation during dips and caution near highs.
________________________________________
⚙️ Educational Trade Ideas (Study Purpose Only)
▶️ Reversal Setup – Bearish Bias
• Entry: Below 3,245 on bearish continuation candle
• Stop Loss: Above 3,272 (Top Range)
• Risk-Reward: 1:1 | 1:2+
________________________________________
🧠 Ideal for studying exhaustion after a resistance test and confirmation through lower highs.
▶️ Pullback Setup – Bullish Bias
• Entry: Between 3,170–3,182 (Demand Zone)
• Stop Loss: 3,160.35
• Risk-Reward: 1:1 | 1:2+
🧠 Classic demand zone bounce setup. Strong volume + engulfing candle supports bullish case.
________________________________________
⚠️ Disclaimer (SEBI-Compliant):
This content is strictly for educational and informational purposes. It is not investment advice or a recommendation to buy/sell any securities. Always consult a SEBI-registered financial advisor before making any financial decisions.
STWP | Learn. Trade. Grow.
________________________________________
💬 Do you think the top is strong enough for a short? Or will bulls take control at demand again?
Drop your thoughts and analysis below ⬇️
________________________________________

Cup & Handle Breakout + Golden Cross Confirms Bullish Megatrend Timeframe: Daily
Ticker: NSE:SIEMENS
🔥 Key Technical Setup:
Cup & Handle Pattern:
Cup Depth: ~1026 points
Breakout Level: 3414 (multi-touch resistance).
Golden Cross Confirmation: 50 EMA crossed above 200 EMA (bullish long-term momentum shift).
Volume & Price Confirmation:
- Entry Trigger: Close above 3414 with a strong green candle + above-average volume (min. 1.5x 20-day avg volume).
- False Breakout Filter: Volume must surge to validate breakout.
🎯 Trade Strategy:
Entry Zone: 3415–3430 (after confirmed breakout).
Stop Loss: 3169 (swing low of the handle, below key support).
Target 1: 3750
Target 2: 4170
Final Target: 4455 (cup depth projected from breakout: *3414 + 1026 = 4440–4455*).
The trade targets 4455, but reaching this level will take time—patience is key as price works through resistance at 3750 and 4170.
📉 Price Action Mantra:
“Price absorbs all noise! Trade the CHART, not the news.”
📊 Why This Works:
1. Golden Cross Amplifies Momentum: Post-crossover, rallies average +25% in trending stocks.
2. Cup & Handle Statistics: 85% success rate when volume confirms breakout.
3. Volume Divergence: Declining volume in handle + surge on breakout = institutional accumulation.
⚠️ Risk Management:
Position Size: Risk ≤1% capital per trade.
Trailing SL: Move SL to 3300 after Target 1 (3750) hit.
Partial Exit: Book 50% at 3750, 25% at 4170, hold 25% for 4455.
🧠 Psychology & Market Structure:
Resistance Levels to Watch:
3750: Profit-taking zone.
4170: Key options barrier (break = accelerated FOMO).
Support Floor: 3200–3169 (must hold to preserve structure).
Set alerts, follow volume, and let price lead the way!
📌 Disclaimer:
This is not financial advice. Past performance ≠ future results. Conduct your own due diligence. Technical analysis has limitations and may not account for black swan events. Manage risk aggressively.

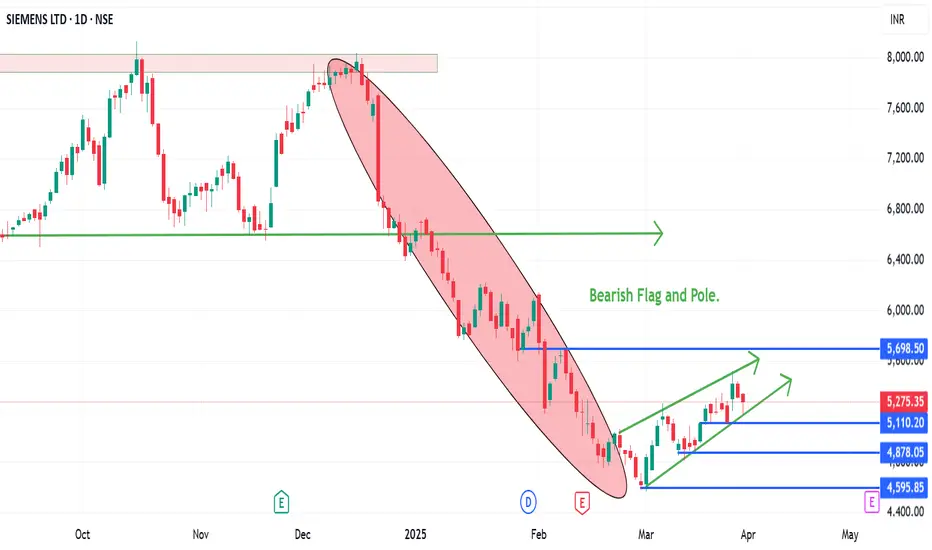
Siemen forming a Flag and Pole pattern on the bearish side.A bearish Flag and pole pattern in Siemens.
The stock has fell from 8000 to 4600 and recovered back to 5300. If there is a break down of the parallel channel, it can retest the recent low of 4600.
It is trading below 100 and 200 EMA on the daily charts. There will be resistance from the levels.
Wait for the break down and let stock price test the recent low.
Enter only once the stock has given a break down, else avoid entering the short trade.
SIEMENS - - Breakout SetupNSE:SIEMENS
Charts are self-explanatory. Levels of breakout, possible up-moves (where stock may find resistances) and support (close below which, setup will be invalidated) are clearly defined.
Disclaimer: This is for demonstration and educational purpose only. This is not buying or selling recommendations. I am not SEBI registered. Please consult your financial advisor before taking any trade.

SIEMENS LTDIf hourly candle close below white trend line then it could test below 📉 4857 within 11th March
Disclaimer:
It's a personal view not a financial advice and I assume no responsibility and liability whatever outcome arises.

Siemens : Data Centre Theme - Looks heading downSiemens is a thematic play on data-center, and recent fall is due to Deep-seek announcement.
- Technically, siemens share price is a free fall now, with 4700 as first major support, followed by 4000 to 4500 zone as a long term Quarterly/Monthly/Weekly supports (expected to hold).
- Incase siemens moves up, 6300 - 6500 will act as a very strong resistance zone, and can easily halt further upside in the stock.
- Unless something fundamentally changes again - it may remain sideway for next few months.
#learn_at_stoxsense #Learntradingwithsudhir #StockMarketIndia #Optiontrading #learntrading

Siemens Downtrend Expected upto 5767Symbol SIEMENS
TIEFRAME 15 Minutes
ANalysis Downtrend Movement
Target 5767

Siemens - Low Risk SetupCMP 6546 on 28.12.24
For the last 6 months, the price has been oscillating between 8000 and 6500. This moment again comes near the level of 6500.
If it bounces back from here, may go into a bullish phase again. One may look for a long setup at this point because of the good risk-reward ratio.
The setup remains active above 6550. If it sustains below 6450, the setup goes weak.
Before entering, one should wait for the reversal signs according to their setups.
All this illustration is only for learning and sharing purposes, it is not a piece of trading advice in any form.
All the best.

Siemens StrongChart -> Siemens Daily
Double bottom breakout in Siemens at support level. Eyeing resistance as target again.
CMP: 7350
Good Range to Buy: 7150 to 7350
Targets: 7600, 8000
SL: 7000 Daily Close
Disclaimer: This is for educational purposes only, not any recommendations to buy or sell. As I am not SEBI registered, please consult your financial advisor before taking any action.

Institutional trading strategy | Order Block | SIEMENS💡Insider Insights:
👉Siemens eyes $9.1B Altair Engineering acquisition for digital growth.
👉Expands AI partnership with Microsoft.
👉Launches Solid Edge 2025 for better design tools.
1️⃣An Order Block Area is a price zone with heavy buying or selling by institutions, Traders use these areas to identify potential price reversals or trend continuations.
✅Identifying an Order Block:
⭕️Consolidation Areas: Look for tight price ranges.
⭕️Sharp Breaks: Identify strong price moves following consolidation.
⭕️Tested Zones: Recognize areas acting as support or resistance.
2️⃣The accumulation phase with a small range is when a stock trades within a narrow price band while large investors buy shares. This indicates strong demand and often leads to a potential upward breakout.
💡Technical Analysis:
✅Inverted Head & Shoulder Chart Pattern
✅ Cup & Handle with order block confirmation
✅Prior accumulation phase
✅Rise in Volume
✅Trap Trading with Bo and fake out confirmation
💡Fundamental Analysis:
👉Revenue Growth: Steady growth, especially in Digital Industries and healthcare.
👉Earnings & Margins: High operating margins due to efficient digital solutions.
👉Dividend: Yield around 3-4%, attractive to investors.
👉Debt & Liquidity: Manageable debt levels with strong cash reserves.
✅Check out my TradingView profile to see how we analyze charts and execute trades.
🙋♀️🙋♂️If you have any questions about this stock, feel free to reach out to me.
📍📌Thank you for exploring our idea! We hope you found it valuable.
🙏FLLOW for more !
👍LIKE if useful !
✍️COMMENT Below your view !

Siemens cmp 7348.50 by Daily Chart view*Siemens cmp 7348.50 by Daily Chart view*
- Volumes surged today by demand based buying
- Price Band 7150 to 7250 is now a Support Zone earlier Resistance Zone
- Old Gap Up Opening of 15-May-2024 Filled In multiple times by Resistance Zone Breakout
- Weekly basis Support at 7005 > 6675 > 6335 with the Resistance at 7600 > 7915 > ATH 8129.90
- Multiple Bullish Rounding Bottoms done with the neckline at Support Zone earlier Resistance Zone
- Stock Price respecting the Rising Support Trendline and sustaining over the Falling Resistance Trendline

SIEMENS DOUBLE BOTTOM BREAKOUTSIEMENS breaking double bottom reversal pattern
macd crossover seen,bullish rsi
volume spike
#target 8000+
sl 6600
NO BUY/SELL RECOMENDATION

SIEMENS | Signs of Accumulation Siemens is a global technology company with a diverse range of products and services. Here are some key stats and information about Siemens:
Founded: 1847 by Werner von Siemens and Johann Georg Halske.
Headquarters: Munich, Germany.
Employees: Approximately 300,000 worldwide.
Business Segments:
Digital Industries: Automation and digitalization in manufacturing.
Smart Infrastructure: Electrical equipment and smart building technologies.
Mobility: Solutions for rail transportation.
Siemens Healthineers: Medical technology and healthcare services.
Siemens Financial Services: Financial solutions.
Global Presence: Operations in over 200 countries.
Sustainability Initiatives: Siemens is committed to sustainability and aims to be carbon neutral by 2030.
💡✍️Technical Reasons to trade or Strategy applied :-
✅Inverted Head & Shoulder Chart Pattern Bull Breakout
✅ Prior uptrend & Rounding Bottom
✅Breakout confirmed
✅Rise in Volume
✅Clear uptrend with HH & HLs sequence
✅Check out my TradingView profile to see how we analyze charts and execute trades.
🙋♀️🙋♂️If you have any questions about this stock, feel free to reach out to me.
📍📌Thank you for exploring our idea! We hope you found it valuable.
🙏FLLOW for more !
👍LIKE if useful !
✍️COMMENT Below your view !

Maybe emerging as a potential short opportunity in the SIEMENSIs Siemens potentially forming a double top or head & shoulders pattern on the weekly chart? Can anyone provide insights on this?

Siemens Indicates Pendent Pattern Breakout Above 8000Details:
Asset: Siemens Limited (SIEMENS)
Breakout Level: Sustaining above 8000
Potential Target: Significant upside momentum expected
Stop Loss: Below breakout level or as per risk tolerance
Timeframe: Short to medium-term
Rationale: Siemens Limited (SIEMENS) is indicating a potential breakout above the 8000 level, potentially breaking out from a pendent pattern. Sustaining above this level could signify a bullish sentiment shift and pave the way for a significant upmove.
Market Analysis:
Technical Breakout: Breaking out from the pendent pattern and sustaining above 8000 suggests a technical breakout, potentially attracting buying interest and driving the price higher.
Market Sentiment: Positive market sentiment or company-specific factors may be contributing to the anticipated breakout in SIEMENS.
Potential Target:
The potential upside target for SIEMENS is not specified but is expected to be significant given the pendent pattern breakout.
Risk Management:
Implementing a stop loss strategy below the breakout level is essential to manage risk in case of unexpected price reversals.
Timeframe:
The projected move for SIEMENS is based on a short to medium-term outlook, but actual timing may vary based on market conditions.
Risk-Reward Ratio: Consider individual risk tolerance and adjust position size accordingly to maintain a favorable risk-reward ratio.
As with any investment opportunity, conduct thorough analysis and consider factors such as market trends, company fundamentals, and risk management strategies before making trading decisions.

Daily Bullish Flag Breakout in Siemens India with 20% upsideHi,
NSE:SIEMENS has given a Bullish Flag Breakout on Daily charts with very good volume.
MACD is also on the bullish side on daily and weekly time frames. RSI is also on the bullish side on daily and weekly time frames.
In the current market scenario, I am expecting that the bullish momentum will continue.
Complete price projection like entry, stop loss and targets mentioned on the charts for educational purpose.
Please share your feedback or any queries on the study.
Disclaimer: Please consult your financial advisor before making any investment decision.
