Trend Channels and Bullish Breakouts: SIEMENS LIMITED📈 Understanding Flat Trend Channels and Bullish Breakouts: The Case of Siemens Limited
1. What is a Flat Trend Channel?
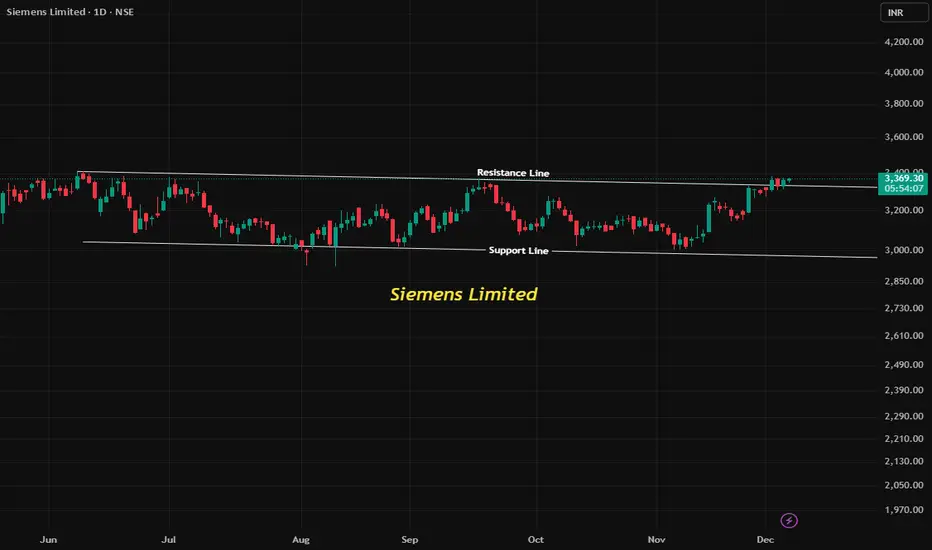
A Flat Trend Channel is a price pattern where a stock moves sideways between two parallel lines — the resistance line (upper boundary) and the support line (lower boundary).
Traders often call this a range-bound market. Prices oscillate within the channel, reflecting indecision between buyers and sellers.
Key features:
a. Resistance line: The ceiling where price repeatedly fails to move higher.
b. Support line: The floor where price repeatedly finds buying interest.
c. Flat nature: Both lines are horizontal, showing no clear uptrend or downtrend.
👉 In Siemens Limited, since June 2025, the stock was consolidating in such a flat channel, capped by resistance around ₹3350.
2. Bullish Breakout from a Flat Channel
A Bullish Breakout occurs when price decisively moves above the resistance line with strong volume and momentum.
This signals that buyers have overwhelmed sellers, often leading to a new upward trend.
Textbook confirmation includes:
Close above resistance on daily chart.
Volume expansion supporting the breakout.
Follow-through candles sustaining above the breakout zone.
👉 Siemens Limited has now closed above ₹3355, confirming a breakout from its flat channel. This shifts the bias from neutral to bullish.
3. Stop Loss and Target: How to Place ? Trading channels requires disciplined risk management. Here’s how traders typically set levels:
a) Enter on breakout candle close above resistance
b) Stop Loss Just below the support or breakout level (below channel support)
c) Target 1 Height of the channel added to breakout point
d) Target 2 Next major resistance zone/ historical supply area
Stop Loss ensures protection if breakout fails (false breakout).
Target is calculated using channel height projection — a classic method in technical analysis.
Siemens Limited’s breakout is a real-world example of how flat channels evolve into trending moves.
4. Traders can use this setup to:
a) Enter long positions above breakout.
b) Place stop loss below support to manage risk.
c) Aim for targets based on channel height and next resistance zones.
This is a textbook bullish breakout opportunity, demonstrating how theory translates into practice.
5. Key Takeaways
a) Flat channels represent consolidation and indecision.
b) Breakouts signal fresh momentum and trend initiation.
c) Stop loss and target placement are essential for disciplined trading.
d) Siemens Limited’s breakout above ₹3355 offers a practical case study of these principles.
Siemensenergy
Enrin - Breakout.Incorporated in 2024, Siemens Energy India Ltd is a leading energy technology Provider, delivering integrated solutions across power generation and transmission systems.
Company's fundamentals are good and current valuation is also good.
It has a breakout with good volume and poll and flag pattern.

Institutional trading strategy | Order Block | SIEMENS💡Insider Insights:
👉Siemens eyes $9.1B Altair Engineering acquisition for digital growth.
👉Expands AI partnership with Microsoft.
👉Launches Solid Edge 2025 for better design tools.
1️⃣An Order Block Area is a price zone with heavy buying or selling by institutions, Traders use these areas to identify potential price reversals or trend continuations.
✅Identifying an Order Block:
⭕️Consolidation Areas: Look for tight price ranges.
⭕️Sharp Breaks: Identify strong price moves following consolidation.
⭕️Tested Zones: Recognize areas acting as support or resistance.
2️⃣The accumulation phase with a small range is when a stock trades within a narrow price band while large investors buy shares. This indicates strong demand and often leads to a potential upward breakout.
💡Technical Analysis:
✅Inverted Head & Shoulder Chart Pattern
✅ Cup & Handle with order block confirmation
✅Prior accumulation phase
✅Rise in Volume
✅Trap Trading with Bo and fake out confirmation
💡Fundamental Analysis:
👉Revenue Growth: Steady growth, especially in Digital Industries and healthcare.
👉Earnings & Margins: High operating margins due to efficient digital solutions.
👉Dividend: Yield around 3-4%, attractive to investors.
👉Debt & Liquidity: Manageable debt levels with strong cash reserves.
✅Check out my TradingView profile to see how we analyze charts and execute trades.
🙋♀️🙋♂️If you have any questions about this stock, feel free to reach out to me.
📍📌Thank you for exploring our idea! We hope you found it valuable.
🙏FLLOW for more !
👍LIKE if useful !
✍️COMMENT Below your view !

Simple Trade Setup | SIEMENS | 18-11-2021 [ INTRADAY]NSE:SIEMENS
Observations:
1) On 1day time frame, it closed below 10DMA.
10DMA is placed at 2362.46.
Immdiate resistance level will be 2360-2365 level range.
Also Immediate support range is 2300-2320 level range.
Immediate breakout level is 2400 level.
Please refer below chart : 1 day Time Frame.
2) On 1hr time frame, If had made rounding bottom pattern. But couldn't give breakout of 2400 level.
But it is sustaining above 2300 level range.
Please refer below chart : 1 hr Time Frame.
-------------------------------------
Trade Setup for Date: 18-11-2021
1) Don't Jump in to trade at the beginning of the market. Let it get settle for 15-20min first and judge the price action.
2) Everything is mentioned on the chart. I hope it is easy to understand.
3) All the levels will work as support, resistance, entry and exit w.r.t price action near that level.
4) Avoid gap up or gap down chase. Wait and trade between levels.
Please refer below chart for levels.
Hope I made it easy to understand it.
Do comment your doubt or suggestion.
Note: Trade with Strict SL. It may or may not hit all the levels. So one can book profit / loss at respective level considering how price action works near that level.

Siemens - Swing Trade Simens took good support over Lower TL of Channel. Good RR setup of 1:2.5+ above 2145.
