UPDATE ON "XAUUSD" BULLISH IDEA Symbol + Timeframes: XAUUSD— HTF (Daily) & ITF (H4)**
Bias: Bullish (as long as price holds above key DAILY FAIR VALUE GAP)
Structure: – Higher lows intact on HTF and SHORTS LIQUIDATED
– Intermediate pullbacks respecting demand zones
Key Levels: – Support: 4820.360
Context: – Price reacting to confluence (fair value gap + structural support)
Plan: – Look for corrective pullback to support for continuation setups , current buy setup would be inbetween 4820-4815.
– Targets based on structural levels - (I) 5090.890 (ii) 5567 (iii) 5599
This is analysis, not trade advice.
Signals

XAUUSDGreetings!
Welcome traders.
By choosing to "Follow", you can stay updated with the latest information promptly. Kindly consider clicking "Boost" as well.
Wishing you a pleasant day.

USDCAD Trade Description – Liquidity Sweep + Discount Rejection USDCAD created a clean sell-side liquidity sweep below the previous low near 1.3700, taking out resting liquidity and tapping into a higher-timeframe discount zone.
After the sweep, price showed a sharp rejection wick, signaling absorption of sell orders and a potential reversal. The market then broke structure to the upside on lower timeframes, confirming a shift in momentum.
Price retraced back into the refinement zone / mitigation block, aligning perfectly with:
✔ Discount pricing
✔ Liquidity grab below the equal lows
✔ Rejection from a demand zone
✔ Bullish displacement following the sweep
This offered a high-probability long setup with entry near the mitigation block, stop below the sweep low, and targets toward the premium zone around 1.3780–1.3800.
The trade idea is based on price reverting back to its equilibrium after removing inefficient lows and collecting sell-side liquidity.

Gold Strengthening as Bullish Structure FormsOANDA:XAUUSD is beginning to present a noticeably stronger bullish tone as the underlying price structure shifts upward.
The most recent market interaction is particularly noteworthy as an early recovery phase has emerged, bearish momentum has weakened, and a series of low-volume candles highlights clear seller exhaustion. These characteristics often signal the early stages of a new bullish movement.
From the current structure, my upside target remains the 4,330 region, a logical and well-aligned level within this developing trend. If price continues to build on this momentum, the next leg could become a clean and convincing extension of the broader bullish narrative we have been following on Gold.
This setup stands out as highly compelling. The story is unfolding, yet it still requires patience and a confirmed signal to validate the upward potential.
Although a deeper pullback cannot be completely ruled out due to the defined support zone below, I continue to favor bullish continuation as the forming structure clearly supports the upside scenario.
Wishing you a strong and profitable trading session.

Gold’s Next Move: 4,350 Within Reach – Are You Ready?Hello everyone, it's Luiss_Miguel here!
Gold is looking pretty interesting right now. As mentioned in the previous analysis, the price has shot up. But guess what? Right now, it's slightly pulling back, moving in the opposite direction to the previous uptrend, which looks like a familiar bullish flag pattern. In this case, there’s only one scenario that could play out, and when the price breaks out from the top of the bullish flag, it’s usually a buy signal, and the price could continue to rise.
My target is 4,350.
Do you agree? Leave a comment below. Joining the TradingView community is always helpful to improve and develop your trading skills.

Bullish Structure Locked In — Gold Eyes 4,405Hello everyone, this is Luiss_Miguel!
At the moment, XAUUSD is a textbook example of a market moving within a well-defined ascending channel, with price consistently respecting both the upper and lower boundaries of the structure.
Recently, we observed a clear breakout above a key resistance zone, followed by a high-quality retest. This area aligns perfectly with the Golden Pocket of the previous bullish leg, making it a highly significant level to watch.
If this zone continues to hold as support, it would provide a strong structural confirmation of the bullish trend, increasing the likelihood of price extending toward 4,405, which represents the upper boundary of the channel.
As long as price remains above this supportive region, the bullish scenario remains intact. However, if price dips below it, short-term bullish momentum could weaken, potentially opening the door to a deeper corrective move.
Always remember to apply strict risk management to protect your capital.
Wishing you all the best — and trade wisely.

XAUUSD: The Bullish Pennant That Could Trigger the Next RallyHello everyone, what is your take on XAUUSD right now?
The 2 hour chart is becoming quite interesting. Price action is shaping a clean bullish pennant, a pattern that often suggests the market is building pressure for its next major move. After completing its corrective pullback, XAUUSD is beginning to show signs that buyers may be preparing to re-enter and push the trend higher again.
If momentum returns, my outlook targets a break above 4265, followed by an extension toward 4430. This zone aligns perfectly with the Fibonacci 1.618 projection, which adds strong confluence to the bullish scenario.
Share your thoughts and your targets in the comments. I would love to hear how you are interpreting this setup.

NZDUSDAs you can see, price made a strong impulse to the upside, leaving an inefficient leg behind and creating a clean demand zone below, which also includes the 0.56000 candle.
I’m expecting a pullback lower into that area before looking for potential buys.
Let’s see how price develops.

GBPNZDI will be looking for buys on GN this week.
Technical reasons:
Price has flipped the 4H bearish structure and created a strong impulsive move to the upside. Since then, momentum into the demand zone has been weak, which is exactly what I want to see in a healthy pullback. There’s also liquidity resting above 4H high, which makes a great first target for the next leg up.
This is a high-probability setup, as it aligns with trend continuation.
Also price made accumulation and the demand zone just aligns with 70% pullback.
Let’s see how the market plays out.

GBPJPYAs you can see price is clearly in an downtrend. Nice push to the downside, and nice recovery back up. And with 4 points being made ( H,L,HL,LL) downtrend is confirmed. I marked 4H supply that aligns with 202.000 handle.
While on the 4H is a downtrend, on daily timeframe, price is in a bullish leg and now coming up from filling the imbalance. Now if I was paying attention I could get into buys at the bottom and trap the market. However that was not the case.
That can cause price to go higher and break through our supply. But that is why we wait for confirmation on smaller timeframes before entering the trade.
Remember, no confiration - no entry.

USDJPY SELLS📉 USD/JPY – Bearish Trend With Clean Supply Rejection
As we can see, UJ is clearly in a bearish trend, confirmed by the red dots on the left chart, where price continues to create new lows.
Price recently retraced into a well-defined Supply zone around the 156.000 level. On the right chart, structure flipped after tapping the zone, giving a clean confirmation and creating a high-quality entry opportunity.
My first partials are placed at the 15-minute low, with the remaining targets marked by the red lines below.

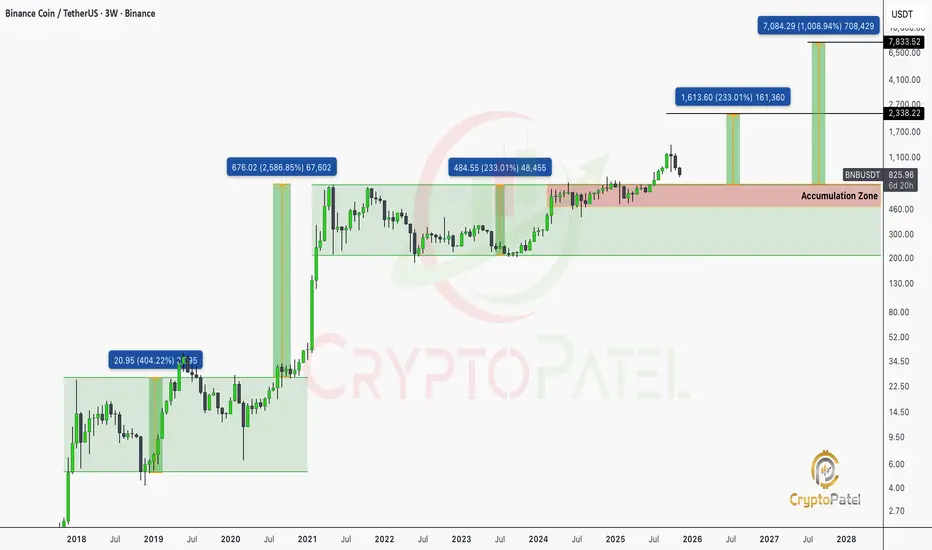
BNB/USDT 3-Week Chart Analysis: Is a Massive Breakout Coming?BNB/USDT 3-Week Chart Analysis: Is a Massive Breakout Coming?
Current Price: $827.05 (down 10.74%)
BNB is currently consolidating in a key Accumulation Zone between $700-$800, signaling institutional accumulation and balance.
Key Levels to Watch
Support Zones:
🔹 $484.55 – Critical demand from 2023 lows
🔹 $676.02 – Former ATH turned support
🔹 $700-$750 – Bottom of current accumulation
Resistance Targets:
🔹 $1,613 – First major upside
🔹 $2,338 – Next intermediate target
🔹 $7,084 – Long-term “moonshot” scenario
Volume & Structure Insights
🔹 2019 Breakout: Started the long-term uptrend
🔹 2021 Bull Run: Peak at $676, classic blow-off top
🔹 2024-2025 Accumulation: Renewed institutional interest
Bearish Risk
🔹 Failure to hold $700 → Retest $484 (-41%)
🔹 Breakdown below $484 → Bullish thesis invalid
NFA & DYOR
XAUUSD is skyrocketing after the Adam & Eve pattern!OANDA:XAUUSD is really interesting right now. The price seems likely to rise further after the formation of the Adam & Eve pattern. With such an easy-to-remember name, the Adam & Eve pattern is one of the most memorable. Below, I’ll explain the reasons and how to easily recognize it.
The Adam pattern is characterized by a sharp drop, followed by a quick recovery, forming a "V" on the chart. High, sharp, and aggressive! You could say it's more "masculine."
On the other hand, the Eve pattern develops more slowly. The price becomes more rounded, forming a wider and smoother base before rising again, creating a shape similar to the letter "U." Softer, more curved, and more "feminine."
Combining these two elements gives us the Adam & Eve pattern, which often signals a potential trend reversal. Especially when accompanied by fundamental analysis or other strong technical indicators.
This pattern will stick in your mind when you connect its shapes to the male and female aspects. A pattern that's truly hard to forget.

Short-Term vs Long-Term Trading1. What Is Short-Term Trading?
Short-term trading focuses on taking advantage of price movements over a few minutes, hours, or days. The trader’s goal is to profit from short bursts of volatility instead of waiting for long-term trends. Short-term trading includes styles like intraday trading, swing trading, scalp trading, and momentum trading.
Key Characteristics of Short-Term Trading
a) Time Horizon
Short-term trades typically last:
Intraday: minutes to hours
Swing trading: 2–15 days
Momentum trades: until trend exhaustion
The focus is on quick entries and exits.
b) Trading Frequency
Short-term traders execute multiple trades within a week or even within a day. This increases opportunity but also exposure to transaction costs.
c) Dependency on Technical Analysis
Short-term trading relies heavily on:
Candlestick patterns
Indicators like RSI, MACD, Moving Averages
Volume analysis
Chart patterns (flags, triangles, breakouts)
Fundamentals matter less because the time horizon is too short for fundamentals to play out meaningfully.
d) High Volatility, High Risk
Short-term moves are unpredictable. News, events, and market sentiment can cause sharp fluctuations. A trader must always have:
Strict stop-loss
Risk-per-trade limits
High emotional discipline
e) Capital Requirement
Short-term traders often use margin or leverage, which magnifies both returns and losses.
f) Psychological Stress
Watching charts for hours, handling rapid moves, and managing multiple positions can be mentally taxing.
Advantages of Short-Term Trading
Quick returns
Regular trading opportunities
Can profit in any market condition (up, down, sideways)
Requires less capital for margin-based strategies
Disadvantages of Short-Term Trading
High risk from volatility
Stressful and time-intensive
High brokerage and taxation costs
Probability of emotional mistakes is higher
2. What Is Long-Term Trading (Investing)?
Long-term trading—often called investing—focuses on holding positions for months, years, or decades. Instead of reacting to daily volatility, long-term traders focus on the broader economic and business growth cycles.
Key Characteristics of Long-Term Trading
a) Time Horizon
Investments typically last:
Short long-term: 6 months–2 years
Medium-term: 2–5 years
Long-term: 5–20+ years
This approach allows the investor to benefit from company growth, compounding, and market cycles.
b) Dependence on Fundamental Analysis
Long-term strategies depend on:
Financial statements (balance sheet, P&L, cash flow)
Company management quality
Sector growth
Economic cycles
Competitive advantages (moats)
Charts may be used for entry timing but fundamentals drive the decision.
c) Lower Trading Frequency
Investors may make only a handful of trades in a year, reducing cost and stress.
d) Lower Risk Through Compounding
Over time, markets tend to move upward due to economic growth. Long-term investing benefits from:
Compounding returns
Dividend reinvestment
Reduced volatility impact
e) Stable and Manageable Psychology
Investors don’t need to watch markets daily. Long-term patience and discipline are more important than speed.
Advantages of Long-Term Trading
Lower stress
Lower brokerage and tax costs
Lower chance of emotional errors
Wealth compounding over time
Better suited for salaried individuals or busy professionals
Disadvantages of Long-Term Trading
Slow returns
Requires patience
Market crashes can test conviction
Needs good research on fundamentals
3. Key Differences Between Short-Term and Long-Term Trading
Aspect Short-Term Trading Long-Term Trading
Time Horizon Minutes to weeks Years to decades
Analysis Mostly technical Mostly fundamental
Risk Level High due to volatility Lower due to long time frame
Capital Requirement Often less initially, but risky with leverage Usually requires more capital but safer
Frequency of Trades High Low
Tax Impact Higher (short-term capital gains tax) Lower (long-term capital gains tax)
Skills Needed Chart reading, speed, intraday discipline Business analysis, patience, strategic thinking
Psychological Pressure High Moderate to low
Return Pattern Frequent small profits (or losses) Slow, compounding returns
4. Which One Is Better?
There is no universal answer—it depends on the individual’s personality, risk appetite, and goals.
Short-Term Trading Is Better If You:
Enjoy analyzing charts
Can handle high stress
Want frequent trading opportunities
Can dedicate time daily
Have strict risk discipline
Accept that losses are part of the game
Short-term trading can generate quick profits but also quick losses.
Long-Term Trading Is Better If You:
Prefer stable growth
Don’t want to sit in front of charts
Believe in company fundamentals
Want to benefit from compounding
Are patient and disciplined
Want to build long-term wealth
For most people, long-term investing is safer and more rewarding.
5. Which Approach Do Professionals Use?
Many experienced market participants use a hybrid model:
Long-term portfolio for wealth creation
Short-term portfolio for opportunities during volatility
This allows them to enjoy stability while also taking advantage of short-term market movements.
6. Final Thoughts
Short-term and long-term trading represent two different philosophies. Short-term traders rely on speed, chart-reading skills, and rapid decision-making, accepting volatility as a regular challenge. Long-term investors rely on patience, fundamentals, and the power of compounding, focusing on the broader picture instead of daily price movements.
Both strategies can be profitable if executed correctly. The key is to choose the one that matches your personality, lifestyle, and financial objectives. A disciplined long-term investor can steadily build wealth, while a skilled short-term trader can generate quicker gains—but with higher risk.
Ultimately, the best traders and investors are those who understand themselves just as well as they understand the market.

CADJPY could keep rising furtherOANDA:CADJPY The market has been on a clear upward trajectory for some time, with each swing reaching higher peaks and forming higher lows. The rising trendline has been the driving force behind this momentum.
Following the recent surge, the price has pulled back slightly, forming a textbook bullish flag pattern.
This is the kind of price action you want to see in a strong uptrend—a controlled retracement with a minor dip, without any aggressive selling pressure.
The bears have failed to break the low, and the bullish momentum remains intact. As a result, the overall trend continues to hold steady.
Right now, the price is breaking out of the flag pattern, and it looks like this trend is poised to continue.
As long as the price stays above the trendline and doesn’t breach the flag's low, my outlook remains bullish.
My target is set at 113.150.

XAUUSD Outlook: Recent Gains Have Been Quite Steady!The market outlook for XAUUSD remains clearly optimistic. The latest price movement has shown a steady recovery, pushing towards the upper boundary of the newly forecasted price channel. This presents another excellent opportunity to get involved.
The market may be in the early stages of a strong new bullish leg. We could also see some consolidation or a short-term pullback before continuing towards the upper boundary, but I believe the second scenario is more likely.
My target would be 4,350.

Is BTCUSD (Bitcoin) heading towards $91,000?Hello!
BTC has finally broken through its main downward trendline, signaling a shift in market sentiment after a prolonged period of selling pressure. Following this breakout, the price formed a clear inverse head and shoulders pattern, indicating that buyers have stepped in strongly after the final liquidation at the head level. Since then, BTC has been moving within a clearly defined ascending channel, consistently creating higher highs and higher lows, which confirms the bullish trend.
As long as the price respects the lower boundary of this channel, the bullish structure remains intact. The next significant resistance lies between the 92,500 and 93,000 levels, which also aligns with the previous breakout area you marked. This area is likely to attract sellers, making it a realistic target for the current move.
Overall, the chart continues to support an upward movement towards the 93K level, unless the price breaks below the channel support, which would weaken the bullish reversal setup.

A Short Gold Sell Opportunity You Can't MissLooking at the chart, gold continues to move steadily within a clear downtrend channel, with each peak and trough forming progressively lower levels over time. Currently, the price is approaching the upper boundary of the channel and interacting with the same resistance area where sellers have stepped in multiple times before, forcing the market to reverse. This behavior strongly indicates that the potential for a continued corrective move downward, in line with the main trend, remains intact.
With this in mind, I believe a price decline toward the 4,080 level is a reasonable and logical target for the current correction. As long as the price hasn’t clearly broken through the upper boundary of the channel, I will continue to favor the scenario where the bearish trend remains dominant, viewing any upward movement as a mere pullback within the overall structure.
This is not financial advice, but simply my personal perspective based on the current price action.

BTCUSD: Overbought Rally Approaches Strong Support ZoneBINANCE:BTCUSD is nearing a crucial support zone, one where buyers have consistently stepped in before and sparked significant reversals. This price history alone makes this level incredibly important to watch closely. Price is approaching this zone once more, and the current market structure suggests potential for a bullish move if we see signs of rejection, such as a strong bullish engulfing candle, long lower wicks indicating absorption of selling pressure, or an uptick in buying volume.
If this support holds, I anticipate price will push towards the 98,700 area, fitting well with a short-term rebound scenario. However, if price breaks through this support and remains below it, the bullish thesis will be invalidated, opening up the possibility for a deeper pullback.
The best approach here is to wait for confirmation from the chart. Pay attention to how candles close, how volume behaves, and only consider long positions if the market defends this support level clearly. Solid risk management is key: position sizing, stop loss placement, and invalidation levels should always be aligned with the volatility that could arise around such a critical area.
This is just my personal view on the current support and resistance structure, not financial advice. Always do your own research and trade with a well-structured risk management plan. Best of luck out there!

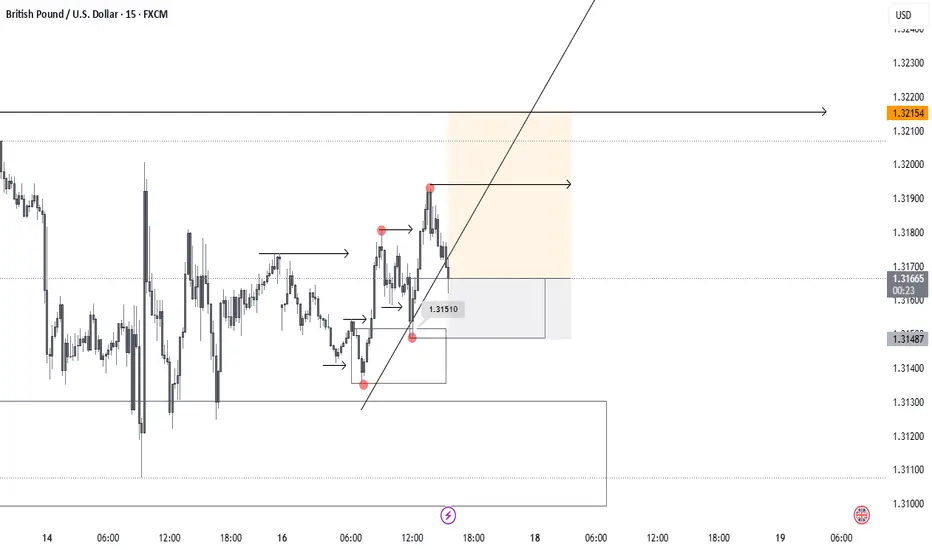
GU Intraday setup on GU
Going with the structure and bullish orderflow.
First target 4H high and will look to take some partials on 15min most recent high.
Gold Trading Strategy for 500 Pips!Hey traders,
As we roll into a brand-new week, gold is showing some impressive stability. XAUUSD is hanging right around the 4,050-dollar mark, and despite the quiet price action, there’s a lot happening beneath the surface that’s worth paying attention to.
The market right now is in “wait-and-see” mode as everyone watches the Federal Reserve’s next moves. Over the past few days, expectations have started to shift—more traders believe the Fed may slowly pivot toward a softer stance and potentially move closer to cutting rates by the end of the year. Because of that, bond yields have been drifting lower, the dollar is losing some of its strength, and demand for safe-haven assets like gold is starting to rise again. All of these elements together create a strong backdrop for potential upside in the short term.
On the technical side, XAUUSD is tightening inside a clean triangle structure, and for those who follow price action closely, you know what that usually means: the market is building pressure. When price consolidates this way, it often sets the stage for a strong breakout. If buyers can push through the upper boundary of this triangle, the next logical target sits up near the 4,500-dollar zone — right in line with the momentum we saw during the last bullish move.
How about you? What’s your take on this setup? Are you leaning toward another leg up, or do you think the market is prepping for a pullback first?
Wishing you a great week of trading—focused, confident, and full of solid opportunities.

Gold Fluctuates in Support Range; Accumulation Signals Rise⏰ Timeframe: 30m
📅 Update: 24/11/2025
🔍 Market Context
After a corrective decline from the 4,104 USD area, gold is moving within a range-bound structure with strong support at the 4,003–4,023 USD area.
The market is in a short-term re-accumulation phase, as consecutive CHoCH movements appear around the bottom area — reflecting the buying side's effort to absorb liquidity.
The selling side temporarily controls, but balancing signals are becoming clearer as the price continuously rejects breaking deeply below the Demand Zone.
📊 Technical Structure
Resistance Zone (4,090–4,104 USD): main supply area, confluence with Fibo 1.0, where profit-taking reactions are likely if the price rebounds.
Support Zone (4,023 USD): intermediate support, playing a key role in the current sideways structure.
Demand Zone (4,003 USD): potential demand area, confluence with previous liquidity bottom – main BUY Zone area.
Structure Bias: still inclined towards accumulation – recovery, as long as the price maintains above 4,003 USD.
🎯 Market Outlook
1️⃣ Priority Scenario (Buy setup):
• The price may continue to retest the Demand Zone (4,003–4,023 USD).
• When a clear reaction signal appears, expect a recovery to the Fibo 0.618 → 1.0 area, corresponding to 4,075–4,104 USD.
2️⃣ Secondary Scenario (Breakdown):
• If the price breaks below 4,003 USD, the recovery structure will be invalidated, bringing gold back to the lower liquidity area around 3,985 USD.
💎 Key Zones
BUY Zone: 4,003 – 4,023 USD
SELL Zone: 4,090 – 4,104 USD
🧠 Analyst’s View
Gold is currently in a liquidity re-accumulation phase, as both sides are testing the lower boundary of the main support area.
The buying side needs confirmation with a break above 4,075 USD, while the selling side still holds the advantage if the price cannot maintain above the balance area.
In the current context, price behavior leans towards the “Sweep – Retest – Expansion” model, with the potential for forming a short-term technical recovery wave.
🛡️ Risk Note
The market is in a low volatility area – avoid emotional actions without clear structural confirmation.

Gold at a Crossroads: Up or Down?If we zoom in and carefully observe how the GOLD price is moving, it becomes immediately clear:
The market has just shown a very strong upward impulse, but now something interesting is happening. The price is tightening and forming a small, narrow triangle, which indicates that the market is accumulating energy. In these situations, there are usually two possible directions, but given the clearly bullish context, I feel that a breakout to the upside is much more likely.
What do you think? Do you agree with me?
Leave your thoughts in the comments. And trust me, being part of the TradingView community will help you improve every day as a trader.
Of course, this is not financial advice, just my personal view on the chart.
