Farhan buildIt Works, thats all that matters, working ides/signals for option trading for NIFTY50, NSE
This analysis give you idea for trending patterns
Signals

XRP/USD Trade Setup: Bearish Position on Technical AnalysisTimeframe: 1 Hour
Entry Price: 3.0229
Take Profit (TP): 2.8769
Stop Loss (SL): 3.1199
1. Market Overview
XRP is currently in a bearish phase, and the price action indicates that a downward continuation is likely. The market has been rejecting higher levels, with strong resistance at the 3.1777 zone, and now the price appears to be moving lower.
2. Entry Criteria:
The entry point is set at 3.0229, just below the current price level, where we anticipate the market to continue its downward movement after facing resistance at higher levels.
The recent price action shows a clear rejection from the upside, and we are expecting further downside once the price breaks below the immediate support near the entry.
3. Technical Indicators:
Heikin Ashi Candles: The chart uses Heikin Ashi candles, which help smooth the price action. The red candles indicate a bearish sentiment, confirming the continuation of downward pressure.
Volume Analysis: The increase in volume during the recent selling phase is confirming that the bears are in control and the trend may continue to the downside.
4. Support & Resistance Levels:
Resistance: The price is facing resistance around 3.1777, which has proven to be a significant level of rejection.
Support: The main support zone is located near the 2.8769 level, which coincides with our take profit (TP). This is a logical target as it aligns with previous lower levels and current trend structure.
5. Risk-Reward Ratio:
The Stop Loss is placed at 3.1199, just above the recent swing highs and resistance level, ensuring we limit risk in case of a market reversal.
The Take Profit is set at 2.8769, offering a solid risk-reward ratio of 1:1.5. This level is where we expect the price to find support and potentially reverse after hitting the target.
6. Trade Management:
Monitor Resistance Level: If the price fails to break below the entry and starts moving upward, consider adjusting the stop loss or exiting the position to limit losses.
Trailing Stop: Once the price starts moving in your favor, consider implementing a trailing stop to lock in profits as the price moves lower.
7. Potential Risks:
False Breakdown: A false breakdown is always a risk, where the price could temporarily dip below the support and reverse, hitting the stop loss before continuing lower.
Market Volatility: Be mindful of the inherent volatility in the crypto market, which can lead to sudden reversals due to news or other external factors.
8. Conclusion:
This trade setup is based on a bearish market structure, where price is showing clear resistance and the potential for further downward movement. The setup is logical with a strong risk-reward ratio and a clear target for profits. As always, risk management is crucial, and it's important to monitor price action closely for any signs of reversal.
Good luck, and trade carefully!

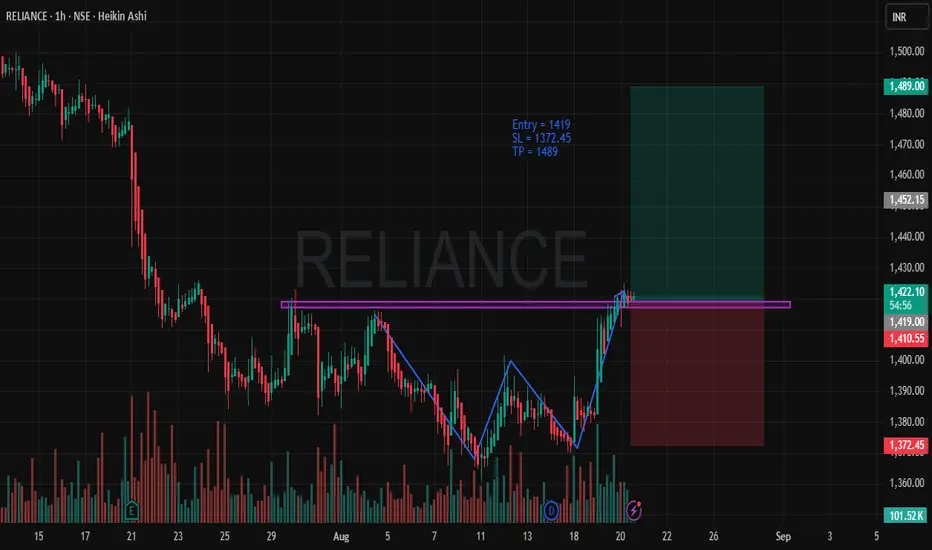
RELIANCE - Bullish SetupTimeframe: 1-Hour
Trade Type: Long Position
Entry Price: 1419
Stop Loss (SL): 1372.45
Take Profit (TP): 1489
Risk-to-Reward (RRR): 1:3.53
Trade Rationale
Bullish Trend Setup: The price action is showing a clear bullish momentum as RELIANCE has recently broken through a significant resistance level (indicated by the purple line). This breakout is a strong signal of potential upward movement.
Chart Pattern: The price forms a classic double bottom pattern (highlighted on the chart), which signifies a reversal from a downtrend to an uptrend. The pattern is confirmed with strong volume, showing the increased participation of buyers.
Entry Point: We are entering this position at 1419, right after the price breaks the resistance and starts moving upwards. This breakout marks the start of the potential rally.
Stop Loss: The SL is placed at 1372.45, just below the recent swing low, ensuring a safe exit if the market decides to reverse.
Take Profit: The TP is placed at 1489, a logical price target that accounts for a solid risk-to-reward ratio of 1:3.53. This is a reasonable expectation based on recent price action and volatility.
Volume Confirmation: Strong volume is observed, confirming the strength of the move. Typically, breakouts accompanied by high volume are more likely to continue in the breakout direction, supporting the bullish scenario.
Market Conditions: The broader market conditions appear favorable for long positions, with sentiment and technical indicators showing bullish signs across the broader market.
Risk Management
A tight Stop Loss ensures that we minimize risk in case of market retracement, while the Take Profit target allows us to ride the trend and maximize the potential return on this trade.
The Risk-to-Reward Ratio is set at 1:3.53, which aligns with sound risk management principles, allowing for substantial profits even with a lower win rate.
XAUUSD Gold Trading Strategy August 19, 2025XAUUSD Gold Trading Strategy August 19, 2025:
Gold's range remains narrow, closely monitoring the progress of ceasefire negotiations in Ukraine.
Basic news: Yesterday, August 18, according to Rueter, US President Donald Trump told Ukrainian President Zelenskiy that the United States will support Ukraine's security in any agreement to end Russia's war in Ukraine. Gold reacted quite mildly when no message of real weight was released, and market sentiment was still very hesitant, currently spot gold is trading around $3,335/oz, equivalent to an increase of about $2 on the day.
Technical analysis: Yesterday's bullish pattern of gold is still maintained when gold prices approach our Plan 1 area and increase again. However, the increase is not strong, it is very likely that today the gold price will still maintain a slight fluctuation in the area of 3325 - 3350. When the gold price breaks the pattern, it will fluctuate very strongly, we will continue to wait to buy mainly in the area around 3300.
Important price zones today: 3325 - 3330, 3300 - 3305 and 3345 - 3350.
Today's trading trend: BUY.
Recommended orders:
Plan 1: BUY XAUUSD zone 3328 - 3330
SL 3325
TP 3333 - 3340 - 3360 - 3390.
Plan 2: BUY XAUUSD zone 3300 - 3302
SL 3297
TP 3305 - 3315 - 3335 - 3370.
Plan 3: SELL STOP XAUUSD zone 3320 - 3322
SL 3325
TP 3317 - 3307 - 3300.
Wish you a safe, successful and profitable trading day.🌟🌟🌟🌟🌟

XAUUSD Gold Trading Strategy August 18, 2025XAUUSD Gold Trading Strategy August 18, 2025:
Gold prices fell 1.79% last week, although Trump and Putin failed to reach an agreement on the key issue, with the focus this week on the Jackson Hole conference.
Basic news: Gold traders are closely watching the developments of the meeting between US President Donald Trump and his Ukrainian counterpart Zelensky today to set the terms of a potential peace deal that Trump agreed with Putin in Alaska on Friday. CME's "Fed Watch" report released today, the probability of the Fed keeping interest rates unchanged in September is 15.4%, and the probability of a 25 basis point rate cut is 84.6%.
Technical analysis: Gold prices have rebounded after approaching the support zone of 3325 - 3330. Currently, the bullish pattern of gold prices has not been broken, the possibility of gold prices having a strong increase in the near future. RSI on H1 and H4 frames is showing signs of entering the buying zone, combined with MA tending to expand after the previous sideways movement. Liquidity zones such as 3375 - 3380 and 3395 - 3400 could be profit-taking zones for this growth.
Important price zones today: 3325 - 3330 and 3300 - 3305.
Today's trading trend: BUY.
Recommended orders:
Plan 1: BUY XAUUSD zone 3326 - 3328
SL 3323
TP 3331 - 3340 - 3360 - 3390.
Plan 2: BUY XAUUSD zone 3300 - 3302
SL 3297
TP 3305 - 3315 - 3335 - 3365 - Open.
Plan 3: SELL STOP XAUUSD zone 3320 - 3322
SL 3325
TP 3317 - 3310 - 3305 - 3300.
Wish you a new week of safe, successful and profitable trading.🥰🥰🥰🥰🥰

ETH on the road to $10,000? Let’s break it down🔥 ETH on the road to $10,000? Let’s break it down 👇
Here’s why ETH looks stronger than ever:
1️⃣ Big Money Flowing In
🔹 ETFs & public companies bought 4.4M ETH ($20B) this quarter.
🔹 Whales & Web3 firms added another 2M ETH.
🔹 That’s more than 5% of total supply absorbed in just months.
2️⃣ Record Network Growth
🔹 DEX trading volume at new highs.
🔹 Daily transactions & active wallets breaking records.
🔹 Stablecoin supply at ATH.
👉 Demand for Ethereum’s network is exploding.
3️⃣ Massive Supply Crunch
🔹 30% staked, 8% with institutions, 25% with long-term holders.
🔹 5% permanently lost.
🔹 Only 12% left on exchanges, shrinking fast.
🔹 Inflation rate just 0.5%, even lower than Bitcoin.
With retirement funds opening ETH access, rate cuts coming, and pro-crypto regulations, the demand will only increase while supply dries up.
Short-term dips may shake out weak hands… but the bigger picture is clear: ETH is heading above $10K this cycle.
Note: NFA & DYOR

ETHUSD Lowers High Formation After Recent Peak Eyes 4010📊 Key Observations:
Trend Shift: After peaking near 4,700, ETH rejected strongly with a caution signal at the top, marking a possible exhaustion zone.
Sell Signals: Multiple sell triggers emerged after the top, showing sellers defending resistance levels.
Liquidity Zone: Price is consolidating under the 4,434 – 4,480 area, which is acting as fresh resistance.
Moving Averages: Short-term averages have crossed downward, aligning with bearish momentum.
📉 Current Setup:
Entry region: Around 4,408 – 4,434 (resistance rejection area).
Target zone: 4,009 – 4,040 (highlighted objective area).
Stop level: Above 4,480 (recent supply zone).
🔎 Reasoning:
Lower highs are forming after the recent peak.
Strong sell presence above 4,400s.
Breakdown structure suggests continuation toward the 4,200 handle, with an extended target closer to 4,009.
Market caution markers confirm a potential trend reversal zone already formed earlier.
✅ETHUSD is in a bearish continuation phase unless bulls reclaim 4,480+. Watching the 4,200 and 4,009 levels as key downside objectives.
⚠️ Disclaimer:
This analysis is for educational purposes only and does not constitute financial advice. Always do your own research and manage risk before making trading decisions.

Gold Trading Strategy XAUUSD August 14, 2025Gold Trading Strategy XAUUSD August 14, 2025:
Gold prices continued to rise in the European session on August 13, 2025 as mild US inflation data raised expectations of a Federal Reserve rate cut in September, while a weaker US dollar also boosted demand for gold.
Fundamental news: The US labor market report earlier this month initially weighed on the greenback, but the latest US CPI data added pressure as it did not show a clear acceleration in inflation due to tariffs in July. The inflation data reinforced the possibility that the Fed will take a more dovish stance in September, which is what the market is expecting.
Technical analysis: After a deep correction to the 3330 area, gold prices showed signs of increasing again. On the H1 frame, an upward price channel has been formed, but the current MA lines are still moving sideways, not showing a clear trend. The 3350 - 3355 area will be the important area to decide whether this uptrend channel can hold or not. RSI on H1 and H4 timeframes has entered the buy zone, this is a very good condition for us to trade. We will trade at the support zones and large liquidity zones of gold prices.
Important price zones today: 3350 - 3355, 3335 - 3340.
Today's trading trend: BUY.
Recommended orders:
Plan 1: BUY XAUUSD zone 3350 - 3352
SL 3347
TP 3355 - 3365 - 3375 - 3390.
Plan 2: BUY XAUUSD zone 3335 - 3337
SL 3332
TP 3340 - 3350 - 3370 - 3390.
Plan 3: SELL XAUUSD zone 3388 - 3390
SL 3393
TP 3385 - 3375 - 3365 - 3355 (small volume).
Wish you a safe, successful and profitable trading day.🥰🥰🥰🥰🥰

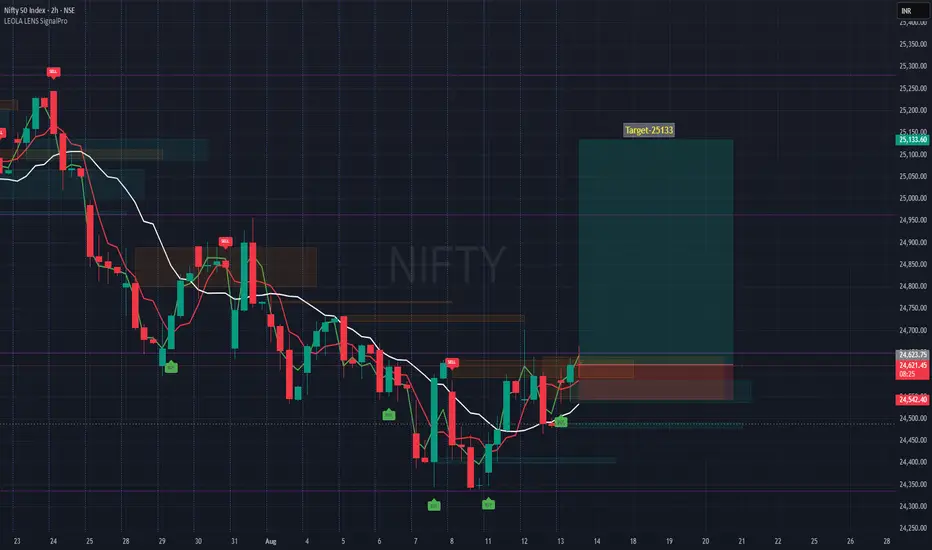
NIFTY Eyes Long on 25133- Bullish Breakout WatchTimeframe: 2-hour (H2)
Entry Zone: Around current breakout level of 24,619
Target: 25,133 – aligns with a prior reaction high and measured move projection from recent swing range.
Stop-Loss: 24,542 – just below the most recent higher low, protecting the setup if momentum fails.
Reasoning:
Price has been forming higher lows since August 7, indicating gradual strength building.
Moving averages have turned upward, confirming short-term trend change.
Previous sell-side liquidity zones have been cleared, reducing overhead resistance until the 25,133 area.
Volume profile shows a gap zone between 24,650 and 25,100, often filled quickly in trending conditions.
Risk Management:
This is a swing-style setup within an ongoing uptrend on the lower timeframe but still needs confirmation from follow-through buying.
Disclaimer:
This chart is for educational discussion only and does not constitute financial advice or a recommendation to trade. Markets carry risk, and decisions should be based on your own analysis and risk tolerance.
Gold Trading Strategy XAUUSD August 13, 2025Gold Trading Strategy XAUUSD August 13, 2025:
Gold prices recovered slightly, currently trading around $3,351/oz, positive US inflation data for July has reinforced market expectations that the US Federal Reserve (FED) will cut interest rates in September, while a weaker US dollar has boosted gold's appeal.
Fundamental news: Data from the US Bureau of Labor Statistics showed that the Consumer Price Index (CPI) increased 2.7% year-on-year in July, lower than the expected 2.8% and unchanged from June. Core CPI increased 3.1% year-on-year and 0.3% month-on-month, the largest increase in six months.
Technical analysis: The sideways range of 3,340 - 3,360 has not been broken yet. The MAs are showing signs of moving sideways, showing the tug-of-war between buyers and sellers. RSI H1 has started to move towards the buy zone, RSI H4 is heading towards the average line. There is a high possibility that gold price will have a correction according to RSI of H4 and increase strongly again.
Important price zones today: 3340 - 3345, 3365 - 3370 and 3385 - 3390.
Today's trading trend: SELL.
Recommended orders:
Plan 1: SELL XAUUSD zone 3367 - 3369
SL 3372
TP 3364 - 3355 - 3345.
Plan 2: SELL XAUUSD zone 3387 - 3389
SL 3392
TP 3384 - 3374 - 3364 - 3345.
Plan 3: BUY XAUUSD zone 3340 - 3342
SL 3337
TP 3345 - 3355 - 3365 - 3385 - OPEN.
Wish you a safe, successful and profitable trading day.💗💗💗💗💗

GBPJPY GJ is continuing its decline and is approaching a key demand zone around 194.800, which previously initiated bullish order flow.
I’ll definitely be monitoring this area closely for potential buy setups, as I’m anticipating a possible retracement. As always, confirmation will come from observing the 15-minute structure—once that aligns, I’ll adapt accordingly.

XAUUSD Gold Trading Strategy August 8, 2025XAUUSD Gold Trading Strategy August 8, 2025:
Gold prices have approached the 340x area and have fallen sharply to the 338x support area at the beginning of today's trading session.
Basic news: President Trump announced to double tariffs on Indian goods to 50% in response to continued oil imports from Russia. Reports show that Trump may meet with Russian President Vladimir Putin as early as next week.
Technical analysis: Gold prices are currently in an uptrend channel, but the trading range is showing signs of narrowing. The possibility that the price will correct at this 340x area is very high; if the gold price creates a double peak pattern in the H1 frame, the price range of 3375 - 3380 will confirm the pattern and create a strong downward force for the gold price. If gold forms a double top pattern here, this correction could take gold to the 3350 or even 3330 area.
Important price zones today: 3375 - 3380, 3405 - 3410 and 3420 - 3425.
Today's trading trend: SELL.
Recommended orders:
Plan 1: SELL XAUUSD zone 3407 - 3409
SL 3412
TP 3404 - 3394 - 3374 - 3354.
Plan 2: SELL XAUUSD zone 3423 - 3425
SL 3428
TP 3420 - 3410 - 3390 - 3370.
Plan 3: BUY XAUUSD zone 3375 - 3377
SL 3372
TP 3380 - 3390 - 3400.
Wish you a safe, successful and profitable trading weekend.🌟🌟🌟🌟🌟

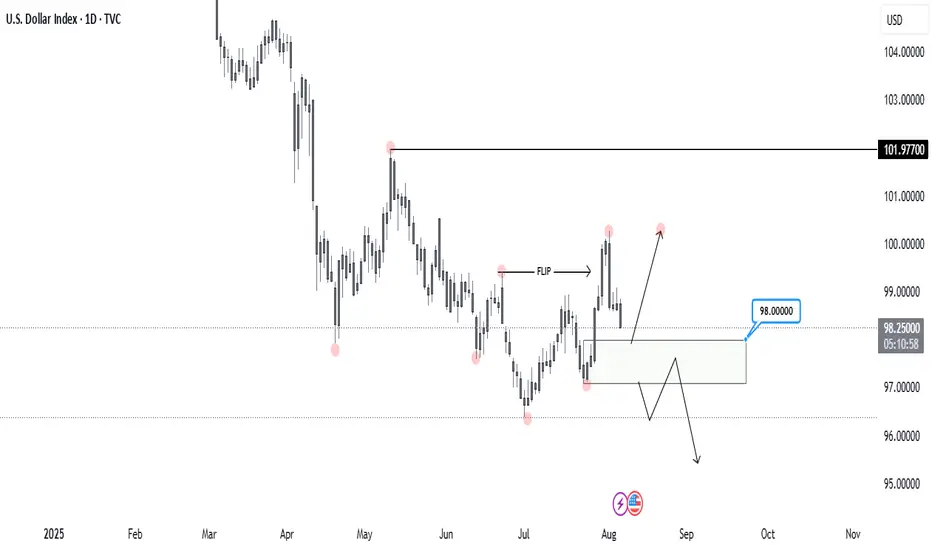
DXY, DAILYLet’s take a look at DXY on the Daily timeframe.
Price recently broke the previous Higher Low, flipping the structure to the downside. This marks a significant shift in momentum.
Now, I'm watching the 98.000 level, which I’ve identified as a Daily Demand Zone. It’s the origin of the move that broke the previous bearish structure, making it a key area of interest.
I’ll be waiting for a reaction from this zone to see if buyers step in again ( most likely ) or if the bearish momentum continues.
That would be my confirmation for xxx/usd shorts.
XAUUSD GOLD TRADING STRATEGY August 5, 2025: XAUUSD Gold Trading Strategy August 5, 2025:
Yesterday's trading session, gold prices continued to increase sharply due to previous influences. However, the possibility of a short-term correction in gold prices at the end of the week will be very high.
Basic news: According to CME FEDWatch, the probability of the Fed cutting interest rates at its September meeting has now increased to about 84%, reflecting increasing concerns about economic weakness. The market is currently pricing in at least two 25 basis point cuts between now and the end of the year, showing a clear shift in investor sentiment after disappointing employment data.
Technical analysis: Gold's bullish momentum is currently showing signs of weakening. The peak area of 3383 - 3385 may create a double peak pattern on H1, but the possibility of gold prices correcting today is very low. Currently, gold prices are filling liquidity at support areas. The correction of gold prices may take place at the end of the week when buyers take profits.
Important price zones today: 3350 - 3355 and 3330 - 3335.
Today's trading trend: BUY.
Recommended orders:
Plan 1: BUY XAUUSD zone 3350 - 3352
SL 3347
TP 3355 - 3365 - 3375 - 3400.
Plan 2: BUY XAUUSD zone 3330 - 3332
SL 3327
TP 3335 - 3345 - 3365 - 3400.
Plan 3: SELL XAUUSD zone 3420 - 3422
SL 3425
TP 3417 - 3407 - 3387 - 3357 - OPEN (small volume).
Wish you a safe, successful and profitable trading day.🌟🌟🌟🌟🌟

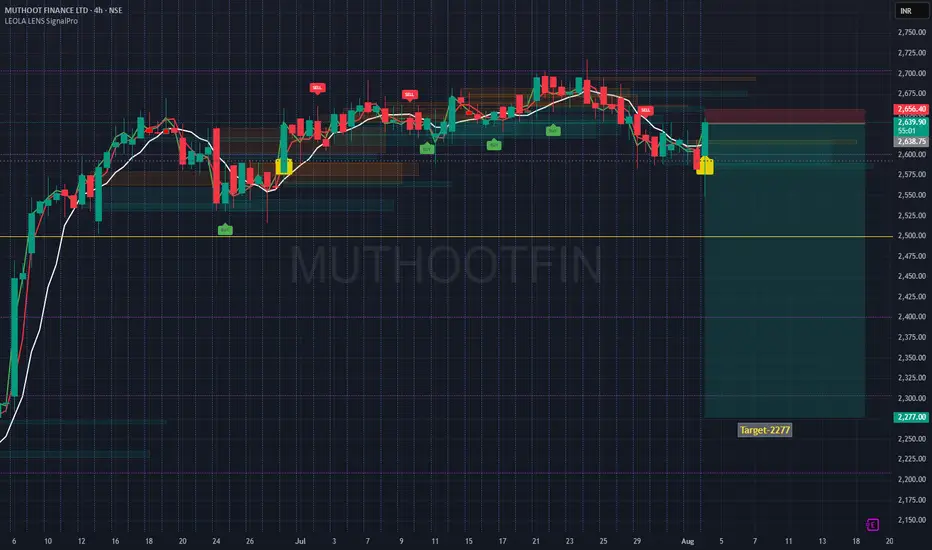
MUTHOOTFIN Structure Breakdown- 2277- Step Towards a Fall 🔍 Technical Structure Breakdown:
🟡 Caution label printed after extended distribution — often a signal for upcoming directional shift.
🔴 Price rejected strongly from the upper red supply zone near ₹2,656, confirming resistance from prior SELL cluster.
⚪ Structure broke below a multi-session accumulation zone, flipping the bias to bearish.
🟢 Current rebound is testing the underside of broken structure — often a key area for rejection or continuation.
📉 Target: ₹2,277, aligning with a major historical reaction zone and potential liquidity pocket.
This setup reflects a classic breakdown-retest structure where price may revisit lower order blocks if it fails to reclaim the broken support zone.
⚠️ Disclaimer:
This post is intended solely for educational purposes and does not constitute financial advice. Please do your own research and consult a licensed financial advisor before making any investment or trading decisions.
Gold regains shine after Fed shiftHey traders! Let’s break down what’s been happening with XAUUSD recently.
Last week, gold made a stunning comeback — tumbling first, then surging nearly 800 pips within just a few sessions. This rapid shift was fueled by dovish signals from the Fed and soft US jobs data, which sparked growing expectations of early monetary easing.
At the same time, a global financial survey shows analyst sentiment toward gold at its highest in months. With ongoing global uncertainty, gold is once again in the spotlight as a go-to safe haven.
Despite the rally, volatility remains elevated. The next move will likely depend on upcoming economic data and fresh comments from Fed officials. Meanwhile, holiday trading could mean slower market activity in the short term.
From a technical perspective, gold has broken out of its previous downtrend channel and is moving rapidly. According to Dow Theory, a short pullback may occur — but if price holds above key support, the bullish wave could extend toward the $3,416 level, marked by the 1.618 Fibonacci extension.
This breakout might just be the beginning of a new bullish phase after weeks of sideways action.
What’s your take — is gold gearing up for something bigger?

GBPUSD GBPUSD is still holding bullish structure. Price has formed a Higher High, and I’ll now be watching for a retracement into the 4H demand zone to potentially form a buy setup.
As of now, there’s no reason to short — unless structure breaks and demand fails, I’ll stick to the bullish bias. If price pulls back cleanly and gives confirmation in the demand zone, I’ll look to take a long position at 1.32000 aligned with the trend.
Keeping it simple: trade with structure, wait for confirmation, and manage risk.

XAUUSD Gold Trading Strategy August 1, 2025:
Yesterday's trading session, gold prices recovered to the 3315 area and then continued to decrease to the 3281 area. Currently, gold prices are fluctuating quite unpredictably due to the impact of tariff news and investor confidence.
Basic news: The Federal Reserve FED continues to maintain the federal funds benchmark interest rate in the range of 4.25% - 4.50%, in line with policy since 2025. Chairman Powell did not give any signal about the next interest rate cut on September 16 - 17.
Technical analysis: After falling sharply to the 3269 area, gold prices are showing signs of recovery. In the current downtrend channel, there has been a higher bottom than the bottom at H1. We can see that if the bullish pattern at H1 is confirmed, combined with the reversal candlestick appearing at H4, the possibility of gold bouncing back to reach the resistance area of 3330, even 3350 is completely possible. In the weekend trading session, we will wait at the support zones to trade.
Important price zones today: 3280 - 3285 and 3269 - 3274.
Today's trading trend: BUY.
Recommended orders:
Plan 1: BUY XAUUSD zone 3283 - 3285
SL 3280
TP 3288 - 3300 - 3310 - 3330.
Plan 2: BUY XAUSD zone 3269 - 3271
SL 3266
TP 3274 - 3284 - 3300 - 3320.
Wish you a safe, favorable and profitable trading day.🥰🥰🥰🥰🥰

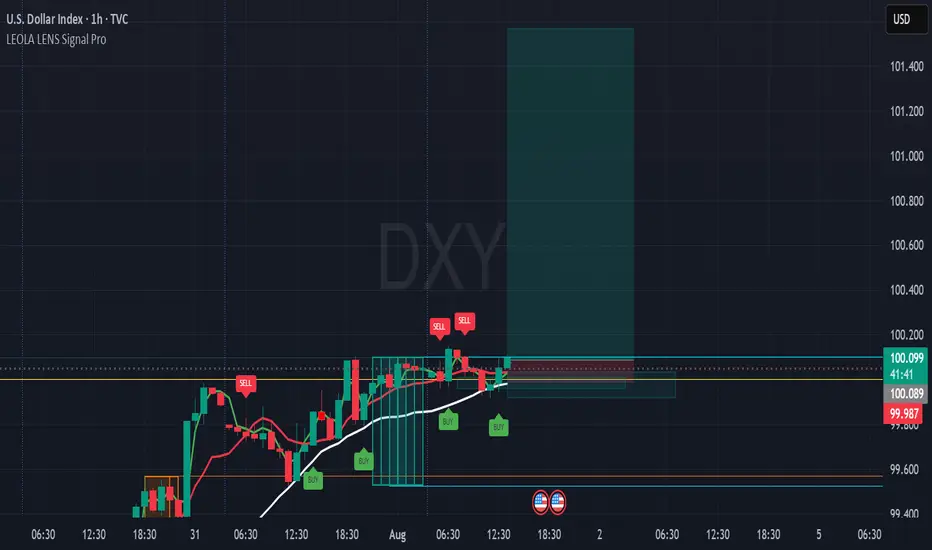
DXY Long Setup Forming After Structure Reclaim-101.567This intraday chart on DXY (U.S. Dollar Index) showcases a structure-aware long setup using Leola Lens SignalPro on the 1H timeframe.
⚙️ Key Technical Highlights:
🟢 Multiple BUY signals appeared near 99.98–100.00 zone after reclaiming short-term structure.
⚪ Price holds above the white adaptive base trendline — suggesting support strength.
🟥 Liquidity Control Box defines a clear invalidation zone under 99.98.
🔁 Prior SELL signals failed to follow through, indicating weakening bearish momentum.
📊 Target projection: 101.567 (based on structural extension and signal alignment).
📌 What to Monitor:
🔎 A decisive candle close above 100.10–100.15 can confirm bullish intent.
🎯 Reward-to-risk favored on clean setups post-breakout, aligning with momentum model.
📉 Invalid if structure re-breaks below base zone with volume.
⚠️ Educational use only. Not financial advice. Structure zones visualize behavior — not prediction.
🔐 Invite-only tool — access details in author bio.
Will Polkadot Hit $50 Again ?Polkadot Looks Ready to Explode — $3 Might Be the Bottom, and $30+ Could Be Next
DOT is consolidating in the $4–$3 Accumulation Zone, right at the retest of a multi-year trendline breakout.
🔹 IMO: Best accumulation range = $4.00–$3.00
🔹 Holding this zone could trigger a macro reversal
🔹 HTF structure favors bullish continuation if support holds
Targets = Key resistances: $9.24 / $16.67 / $40.85
Expecting $30+ this bull run- $50 is the bonus target.
❌ Invalidation: HTF close below $3 = Exit
NFa & DYOR

Gold XAUUSD Trading Strategy July 29, 2025Gold XAUUSD Trading Strategy July 29, 2025:
Yesterday's trading session, gold prices continued to fall as expected. After approaching the resistance area of 3300, gold prices are recovering.
Basic news: The market is almost unlikely to see the possibility of the FED cutting interest rates in July and about 40% chance that the FED will continue to keep interest rates unchanged in September, up from about 10% the previous month. US non-farm payrolls are likely to continue to increase rapidly, showing a rapid recovery in the labor market.
Technical analysis: Gold prices continue to stick with the MA lines, the downtrend channel has not been broken. Currently, the 3280 - 3285 area may be a support area for gold prices to recover after the previous sharp decline. We will mainly trade according to the short-term trend and wait for a long-term buying point.
Important price zones today: 3330 - 3335, 3350 - 3355 and 3280 - 3285.
Today's trading trend: SELL.
Recommended orders:
Plan 1: SELL XAUUSD zone 3333 - 3335
SL 3338
TP 3330 - 3320 - 3300 - 3280.
Plan 2: SELL XAUUSD zone 3353 - 3355
SL 3358
TP 3350 - 3340 - 3320 - 3300.
Plan 3: BUY XAUUSD zone 3283 - 3285
SL 3280
TP 3288 - 3300 - 3320 - 3340 - Open.
Wish you a safe, successful and profitable trading day.💗💗💗💗💗

is $VIRTUAL about to fly to $8?Don’t ignore this setup – is SPARKS:VIRTUAL about to fly to $8?
Price action is currently displaying a bullish flag structure on the daily chart — a continuation pattern following a strong impulse leg.
🔸 Impulse Move (Flagpole): +335% vertical rally
🔸 Consolidation Phase: Descending parallel channel forming the flag
🔸 Market Structure: Bullish continuation intact as long as the lower trendline holds
Technical Levels:
▪️ Support Zone: $1.30–$1.10 (confluence of demand & trendline support)
▪️ Breakout Confirmation: Clean daily close above $2.00 with elevated volume
▪️ Projected Target: $8.18 (measured move = flagpole height from breakout level)
Observations:
▪️ No structural breakdown observed — price respecting flag support
▪️ Volume remains muted during consolidation — typical in bullish flags
▪️ Breakout potential increases if price compresses toward apex with decreasing volatility
Invalidation: Break below $1.10 on high volume would shift bias neutral/bearish.
Strategy: Watch for breakout + retest confirmation above $2.00 to target $8.18. Risk can be defined below lower trendline support.
Note: NFa & DYOR
