Gold Trading Strategy XAUUSD July 24, 2025Gold Trading Strategy XAUUSD July 24, 2025:
Yesterday's trading session, after rising to the 343x area, created a double-top pattern and fell sharply at the beginning of today's trading session.
Basic news: The EU is close to a 15% tariff agreement with the United States. The yield on 10-year US Treasury bonds fell more than 5 basis points to 4.332% before recovering to 4.364% but is still very low. The US real yield also fell 4.5 basis points to 1.932%.
Technical analysis: Gold prices fell sharply after forming a double-top pattern at the 343x area. RSI H1 is approaching the oversold area; RSI H4 and D1 are currently showing signs of correction to the average line. We will wait for the recovery of gold prices and continue trading at resistance areas.
Important price zones today: 3400 - 3405, 3420- 3425 and 3360 - 3365.
Today's trading trend: SELL.
Recommended orders:
Plan 1: SELL XAUUSD zone 3400 - 3402
SL 3405
TP 3397 - 3387 - 3377 - 3367.
Plan 2: SELL XAUUSD zone 3420 - 3422
SL 3425
TP 3417 - 3407 - 3387 - 3367.
Plan 3: BUY XAUUSD zone 3363 - 3365
SL 3360
TP 3368 - 3378 - 3388 - 3400.
Wish you a safe, favorable and profitable trading day.🌟🌟🌟🌟🌟
Signals

Gold XAUUSD Trading Strategy on July 22, 2025Gold XAUUSD Trading Strategy on July 22, 2025:
Yesterday's trading session, gold prices rebounded strongly from the 3345 area to the 3402 area after the previous multi-timeframe compression.
Basic news: President Donald Trump's trade stance towards Europe became tougher; Europe plans to develop a retaliation plan.
Technical analysis: After the previous multi-timeframe compression, gold prices rebounded strongly again. The previous resistance zone of 3365 - 3370 has now become a support zone for gold prices. Currently, a strong uptrend is showing in multiple timeframes. However, the RSI on the H1 frame is currently quite overbought, we will wait for a correction to the support zone to trade.
Important price zones today: 3365 - 3370, 3347 - 3352 and 3422 - 3427.
Today's trading trend: BUY.
Recommended orders:
Plan 1: BUY XAUUSD zone 3365 - 3367
SL 3362
TP 3370 - 3380 - 3400 - 3420.
Plan 2: BUY XAUUSD zone 3347 - 3349
SL 3344
TP 3352 - 3362 - 3372 - 3400.
Plan 3: SELL XAUUSD zone 3425 - 3427
SL 3430
TP 3422 - 3412 - 3402 - 3382 (small volume).
Wish you a safe, favorable and profitable trading day.💯💯💯💯💯

$LTC alert: perfect rebound – $200-$400 next? Don't miss it! NYSE:LTC played out exactly as expected.
It bounced perfectly from our accumulation zone between $60–$70, and is now already up 45% from our entry.
The next big Resistance at $120–$140. If that breaks, we’re eyeing targets of $200 / $300 / $400 / $500.
Yes, $1,000 is still possible, but for now, our focus is on the $500 mark — and I believe this bull run could be the one that finally takes NYSE:LTC there.
I’m confident NYSE:LTC will outperform again, just like in the previous cycles.
And let’s not forget — our very first entry was back at $50.
Are you ready for Litecoin’s next leg up? 👇
Note: NFA & DYOR

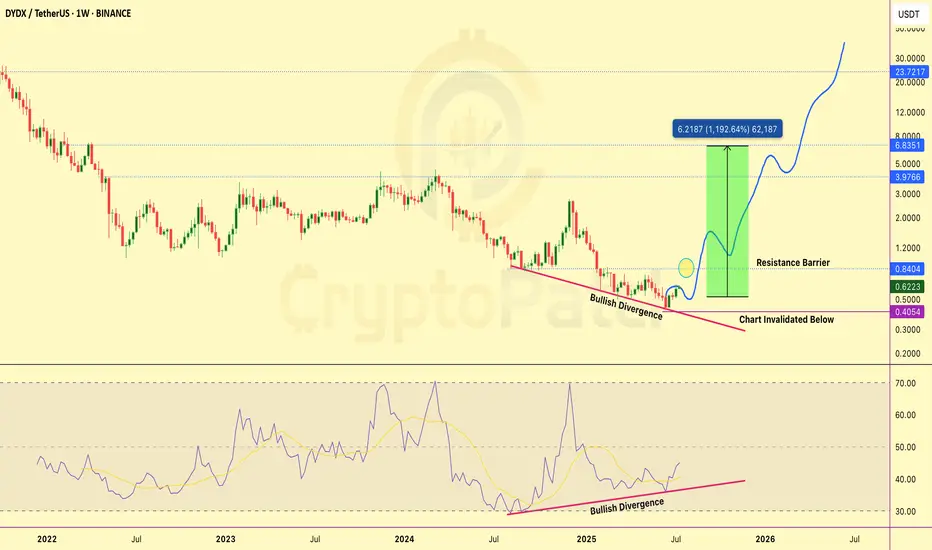
DYDX could be one of the biggest 10x plays this cycle DYDX is finally showing strong reversal signals after months of downtrend.
What’s happening?
We’ve spotted a clear Bullish Divergence on both the price chart and RSI. While the price made lower lows, RSI is printing higher lows — a classic signal that selling pressure is weakening and buyers are stepping in quietly.
Key Levels to Watch:
🔹 Support (Invalidation Zone): $0.405
🔹 If price breaks below this level, the bullish setup is invalid.
🔹 Resistance Barrier: $0.84
Once DYDX closes above this level, a major breakout could unfold.
Upside Potential (if breakout confirmed): $0.84 / $3.97 / $6.83 / Bonus
RSI is also trending upward, confirming hidden strength in the move. Volume is gradually picking up too — another positive sign.
If this divergence plays out fully, we’re looking at a potential 10x+ move from here. Keep a close eye on the $0.84 breakout zone — it could be the ignition point for a major rally.
Always trade with SL and proper risk management.
This is NOT financial advice. Just sharing what I see on the charts.
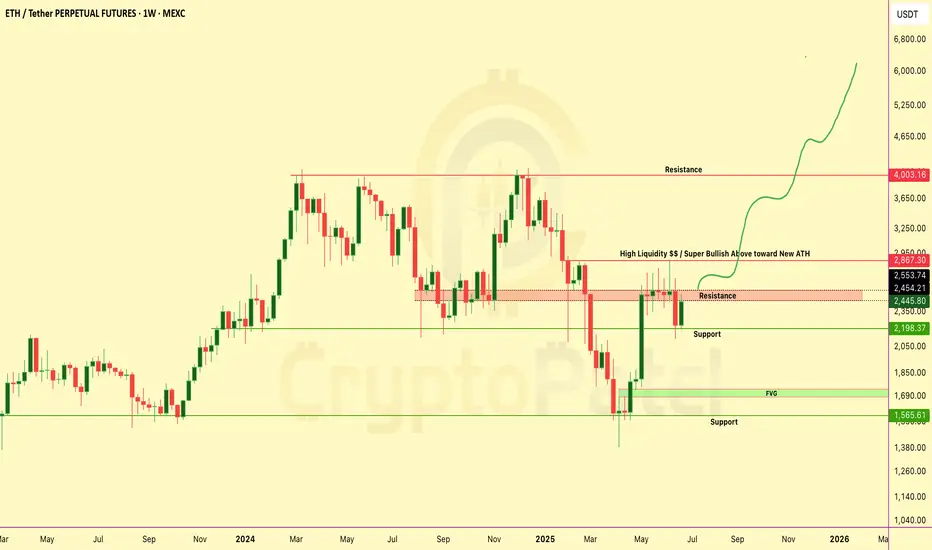
ETHEREUM Weekly Chart Breakdown – Massive Move Loading?ETHEREUM Weekly Chart Breakdown – Massive Move Loading?
ETH just pumped +9.9% this week... but it’s what comes next that really matters 👇
Key Resistance Wall → $2,867
🔹 This zone is packed with liquidity traps and past rejections.
🔹 Break this level = Unlocks ATH push toward $4K–$6K-$10k
Why This Chart Matters:
✅ Bullish structure reclaim
✅ Targeting “High Liquidity” zone above
✅ Possible parabolic rally if breakout confirms
Dips = Opportunities
If ETH dips from here... don’t panic.
→ Every dip = fresh accumulation zone
→ Below $2,000 = golden buy zone for long-term bulls
Liquidity Zone Break it = ATH rally incoming
Reject it = Buy the dip and ride the next wave
Comment & tag a friend who needs this alpha!
NFA & Dyor
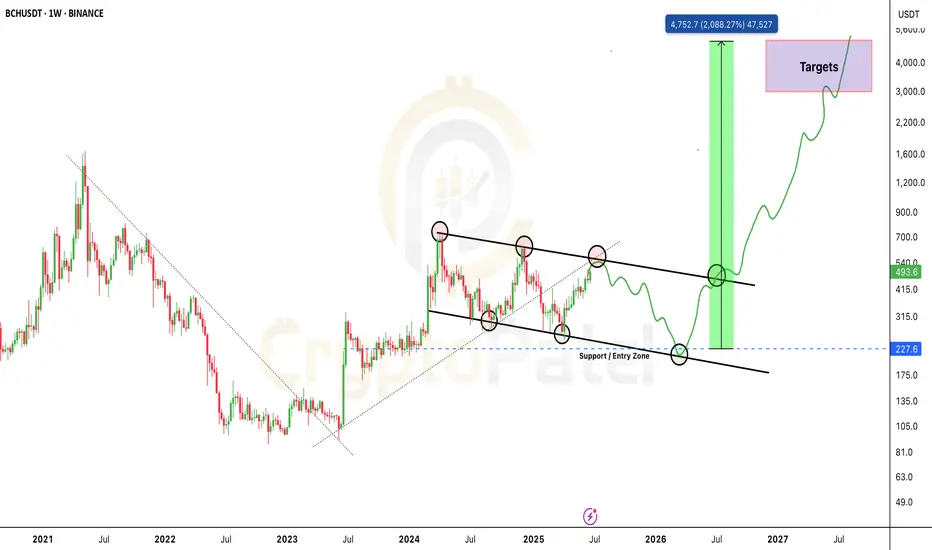
BCH/USDT — The Final Dip Before a 10x Move?Weekly Chart Analysis | Long-Term Setup
BCH is forming a powerful macro structure that could lead to a massive breakout.
🔹 Descending Channel Structure
The price has been respecting a clean descending channel since 2023.
Each rejection from the upper trendline has led to a higher low — showing clear accumulation.
🔹 Key Entry Zone: $220–$230
This zone has acted as major support multiple times.
If BCH revisits this level and holds again, it could trigger a major trend reversal.
🔹 Breakout Targets: $3,000–$5,000
If the breakout occurs as projected, BCH could rally into this zone in the coming bull cycle.
This would be a potential 10x+ opportunity from the bottom range.
Final Thoughts:
📌 This is not a short-term play.
📌 It’s a macro setup for serious investors and position traders.
📌 The structure mirrors historical accumulation zones seen before massive moves.
💬 What’s your take on BCH long-term?
Comment below and share your chart if you’re tracking it too 👇
$BTC Technical Breakdown – As Predicted!CRYPTOCAP:BTC Technical Breakdown – As Predicted!
I already warned you at $110K to exit or short — and guess what?
We’re now up with 8% profit from that exact call!
#Bitcoin broke structure with a Bearish Divergence, and the trendline is looking weak.
If this war doesn’t stop, I expect further downside below $100K.
Key levels to watch:
🔻 Support 1: $73,500
🔻 Support 2: $48,700
If $100K breaks, don’t be surprised to see $90K → $80K → even $70K.
Don’t say I didn’t alert you.
I clearly told you to short or exit at the top.
Booked profits? Let me know below 👇

Will Bitcoin Hit $80k Before $171,000 ?Bitcoin is Forming a Inverse Head & Shoulders on the 2D chart...
And if this plays out — we could be looking at a move to $171,000
Here’s what you need to know:
Structure Breakdown:
▪️ Left Shoulder: Completed
▪️ Head: Completed
▪️ Right Shoulder: (in progress)
Neckline: ~$112.5K-$115k
Breakout above neckline = $171K target
That’s a +49% upside move from here.
But here’s the catch...
When too many spot the same pattern — whales love to trap.
Fakeouts, stop hunts, liquidations — you’ve seen it before.
❌ If BTC drops below $100K (Right Shoulder base), this setup flips bearish fast.
Key Support Zones:
▪️ $93,940 (Fib 0.382)
▪️ $80,780 (Fib 0.786)
Trade with confirmation, not emotion.
Respect your invalidation levels and protect capital.
What’s your play if we tap $112K? 👇
NFA & DYOR

Bulish Breakout in HUBTOWNIn upcomming Few Days we ll see a bulish breakout in HUBTOWN
as price is going to retrace the level then it will break the level 136.6 and there is a possible upcomming move in HUBTOWN

WIF Just Flipped Bullish — Is This the Start of the Next Big AltWIF Just Flipped Bullish — Is This the Start of the Next Big Alt Rally?
WIF just bounced hard from the $0.80 demand zone and flipped structure bullish with a clear CHoCH!
Smart Money is back — and they’ve left their footprint.
Here’s What’s Cooking:
🔹 CHoCH Confirmed ✅
🔹 Bullish OB at $0.93–$0.96 respected ✅
🔹 Price aiming for $1.13–$1.42 — major liquidity zones
🔹 This isn’t random. It’s Smart Money accumulation, and the next leg up could be explosive.
⚠️ Don’t chase. Wait for confirmation around $1.13 zone and plan accordingly.
Breakout = 🚀
Rejection = Watch for retest.
High-Probability Play
This chart is loaded with confluences. If you're sleeping on it… you might miss one of the cleanest moves of the week.
📢 ACTION TIME:
✅ Save the chart
✅ Share with your crew
✅ Stay updated — we’re tracking this live
Comment “WIF🔥” if you're watching this move!

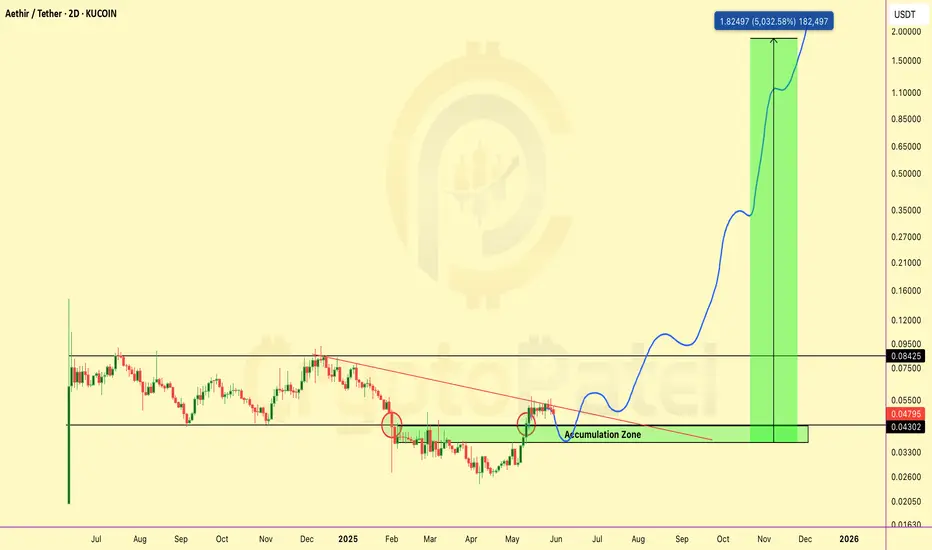
$ATH = AWS of Web3? Backed by Big VCs & Could 50xTSX:ATH = AWS of Web3? Backed by Big VCs & Could 50x
Here’s Why I’m Bullish on #AETHIR 👇
Aethir ( TSX:ATH ) is building a decentralized GPU cloud for AI, gaming, and big compute — imagine AWS on Web3.
And guess what? It’s still early.
Why Aethir is Super Bullish Right Now:
▶️ Massive Use Case – Powers AI, metaverse, & cloud gaming
▶️ Strong Team – Built by blockchain + AI veterans
▶️ Top VC Backing – Hashkey, Sanctor Capital, Merit Circle
▶️ Real Revenue Model – Users pay in TSX:ATH to access GPU power
This isn’t just a token — it’s a working product with real-world demand.
My Long-Term Accumulation Strategy (Not Financial Advice):
▶️ Buying Zone: $0.048–$0.035
▶️ Major Resistance Level: $0.085
▶️ If we break above, next leg could fly.
▶️ Targets I’m Watching: $0.1 → $0.5 → $1 → $2
I’ll add more if price dips hard — I see long-term potential.
This could be one of the biggest infrastructure plays of this bull run.
The kind of project you’ll wish you bought early.
Save this. Come back in 1-2 Years. Let’s see who was early.
🔥 If you found this early alpha valuable:
👍 Like to show love
🔁 Retweet to spread the gem
💬 Comment your TSX:ATH target below
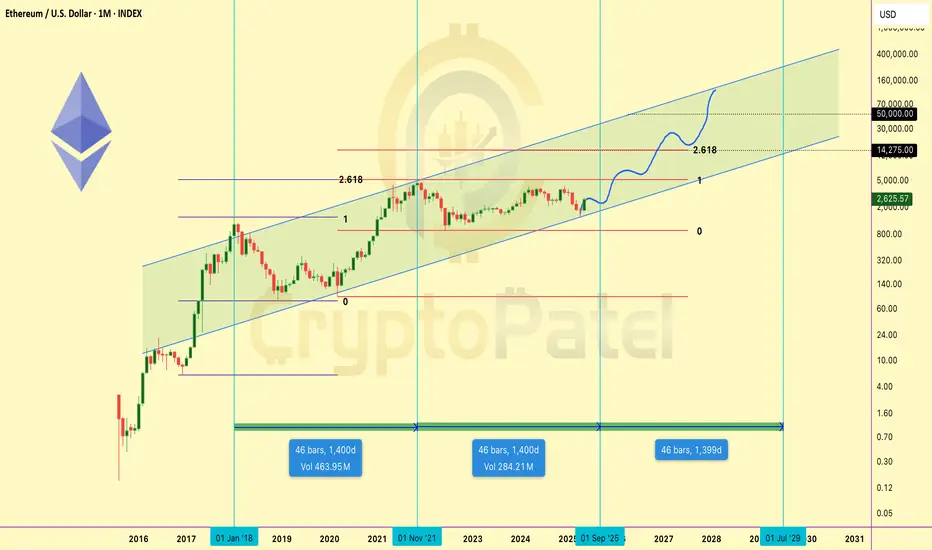
Ethereum Macro Chart Breakdown – Eyeing $10K+ Targets! Ethereum Macro Chart Breakdown – Eyeing $10K+ Targets!
Let’s zoom out and look at the bigger picture for CRYPTOCAP:ETH – this isn't just a pump; it’s a potential parabolic supercycle forming.
Technical Outlook:
Fractal Pattern Analysis
Ethereum is following a similar macro-structure to its 2017–2021 cycle, where after a long consolidation and accumulation phase, it exploded nearly 30x from bottom to top.
Current price action mirrors the post-2019 structure, and we’re at the same breakout stage right now.
Fibonacci Projections
Using the Fibonacci extension from the previous bear market low to the bull market top, and applying the same ratio from the 2022 bottom:
🔹 1.618 Fib = ~$10,000
🔹 2.618 Fib = ~$14,000
These targets align with Q4 2025–Q1 2026, based on previous cycle timings.
Structural Support
ETH is now trading above its 100-week EMA and holding bullish structure on higher timeframes. Previous resistance at $2,500 has flipped into strong support.
Momentum & Fundamentals
🔹 Layer 2 scaling is booming (Arbitrum, Base, zkSync)
🔹 Institutional ETH ETFs are launching
🔹 ETH powers Web3, DeFi, AI infra, RWAs, and more
🔹 Ultra-sound money supply dynamics + staking yield
🔹 Ecosystem growth is organic and robust
Projected Targets:
🎯 Short/Mid-Term (Q4 2025): $10,000 – $14,000
🚀 Ultra Long-Term (2029–2030): $40,000 – $50,000
If you still believe ETH is “just another altcoin,” you’re missing the bigger picture. Ethereum isn’t a meme — it’s the backbone of digital value, smart contracts, and future finance.
I’m long and accumulating ETH on dips. This isn’t just a trade — it’s a conviction play.
🗨️ Drop your ETH target in the comments 👇
🔁 Share this with someone sleeping on ETH!
Note: This is NFA So DYOR
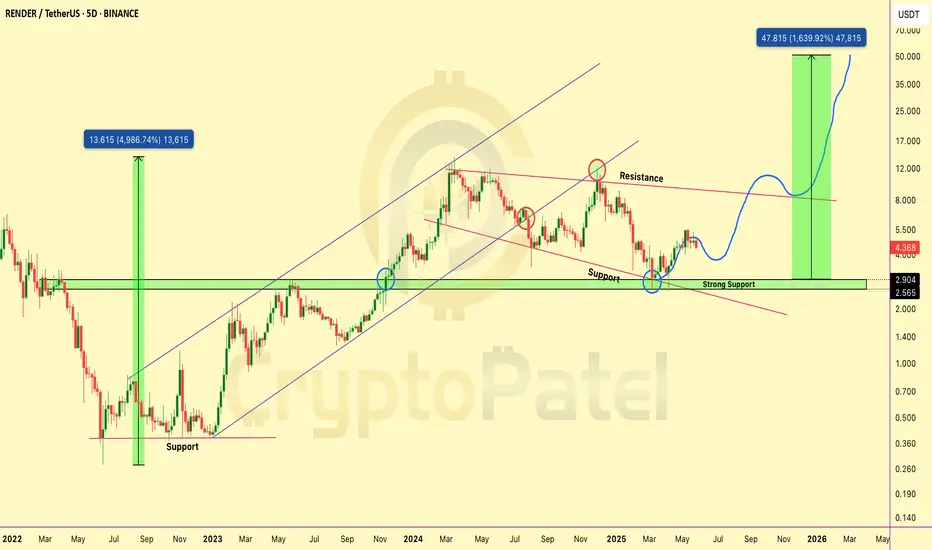
$RENDER Could Be the Next Nvidia of CryptoCRYPTOCAP:RENDER Could Be the Next Nvidia of Crypto
CRYPTOCAP:RENDER is one of the strongest AI projects in crypto right now — and it’s only getting started. The dip you see now?
That’s an accumulation opportunity for long-term believers!
▶️ Best Buy Zone: $4 – $3.40
▶️ Targets: $8.6 / $15 / $25 / $40 / $50
▶️ Strong Support: $2.90 – $2.50
As long as we’re above that — we’re super bullish! ✅
Why CRYPTOCAP:RENDER Can Hit $30–$50 This Cycle:
✅ Solves real problems – powers AI, 3D, VFX, gaming
✅ Trusted by giants – Netflix, Disney, Apple, Unreal Engine
✅ Limited supply + burn = strong tokenomics
✅ On Solana now – faster, cheaper, better
✅ Rides the AI wave – GPU demand is booming
✅ Last cycle = 49x. This time? Bigger stage, bigger vision.
It’s like the Nvidia of Web3 — but decentralized.
👇 If you believe in the future of AI + GPU power…
Keep your eyes on $RENDER. This one’s not just hype.
NFA & DYOR
Why TONCOIN is Potential to hit $50?🚨 TON Is Silently Prepping for a Massive Bull Run — Are You In Yet?
While the market chases memecoins, TON is building real stuff — with real money, real users, and now even AI integration.
Here’s why TON could be the next CRYPTOCAP:SOL -like sleeper 👇
▶️ $1.5 Billion Raised via Bonds
Telegram raised $1.5B at a 9% yield — no token dump, no equity sale.
Just old-school bonds — and institutional giants like BlackRock & Citadel bought in.
This gives TON huge runway to:
✅ Build Infra
✅ Expand Ecosystem
✅ Onboard Millions of Users
▶️ TON x xAI (Elon Musk's Grok) 🤝
The TON Foundation just announced a partnership with xAI (Grok) — bringing AI-powered search and interaction inside Telegram.
Imagine Grok integrated with TON wallet, payments, and apps — AI + Blockchain + 900M users = Game changer.
This is real utility, not just another hype partnership.
▶️ Ex-Visa Exec Joins TON as VP of Payments
Nikola Plecas, who helped shape Visa’s crypto strategy, is now leading TON’s payment mission.
The goal? Bring crypto payments to the heart of Telegram’s global userbase.
Solana Pay & Lightning — watch your back 👀
▶️ Telegram Premium Hits 15M Paid Users
This isn’t just “users” — this is a monetized audience, ready for TON-powered payments, tipping, and apps.
TON isn’t building a user base — Telegram already has it.
▶️ TON Technical Analysis (TA)
We called the TON move at $2.50 — and it’s already 50% up!
Now it’s forming:
✅ Bullish Market Structure
✅ Higher Highs + Higher Lows
✅ Strong Bounced From demand zone
Next target short term? $5–$6
Bull Market Potential? $50–$70 easy, especially when altseason fully ignites 🔥
Why TON Could Be the Next Crypto Titan:
▪️ Backed by Telegram
▪️ Integrated into daily chat & apps
▪️ 900M+ users in waiting
▪️ AI partnership with Grok
▪️ Institutional money flowing in
▪️ Strategic hires and solid infra
TON is the dark horse of this bull market.
It doesn't shout. It ships.
Once TON wallets go live for all Telegram users...
Game over for most L1s.
Follow CryptoPatel for more early alpha before the herd wakes up.
And tell me — what’s YOUR price target for CRYPTOCAP:TON in this cycle? 👇
Note: This is Not Financial Advice so DYOR before investing.

ALTCOIN SEASON LOADING🚨 ALTCOIN SEASON LOADING...
The ETH/BTC pair just gave a major bullish signal
✅ Up 45% in 1 month
✅ Reclaiming strength after long consolidation
✅ Leading the way for ALTCOINS to fly
This is not just bullish for Ethereum — it's even more bullish for other altcoins 👇
Short-term Retracement Expected:
I'm watching 0.022–0.020 BTC as a key accumulation zone on ETH/BTC
That’s the area where smart money will reload before the next leg up.
My Bull Run Target: 0.08 BTC per ETH
If we hit that, it’s time to start rotating profits from ETH into other alts.
Altseason isn’t coming...
It’s already warming up.

Bitcoin Dumped form $111800 to $107800 so What next?🚨 Hope you caught the top short at that Bearish OB!
CRYPTOCAP:BTC dropped from $111.5K → $107.8K
Next Key Level: $105K
Hold = Bull Mode On 🟢
Break = Say Hello to < $100K again 😬
Reminder: Don’t gamble your hard-earned money. Trade smart.

The uptrend is being tested at the resistance of 3,305 USDAfter a strong recovery from the bottom around 3,140 USD, the world gold price is touching the important resistance zone at 3,305 USD/ounce in the trading session on May 21. On the 4H chart, the short-term uptrend is reinforced when the price breaks above the EMA 34 and EMA 89, creating a golden cross pattern - a sign that often signals the continuation of the uptrend.
However, the 3,305–3,325 area is currently acting as a short-term resistance - where many reversals have been recorded in the past. The price is showing signs of slowing down when approaching this area, with small candles and narrow bodies, indicating that buying power is temporarily slowing down.
If gold breaks and closes clearly above 3,325, the price will likely continue to move towards 3,375 and further to 3,400 USD. On the contrary, if the price fails to break above the current resistance zone and reverses, the support zone to watch is the confluence between EMA34 and EMA89 around 3,250–3,260.
With market sentiment still dominated by geopolitical factors and US credit risks, gold continues to maintain its safe-haven role. However, investors should monitor the price reaction at the 3,305 area to confirm the next momentum – whether it is a breakout or a technical correction.

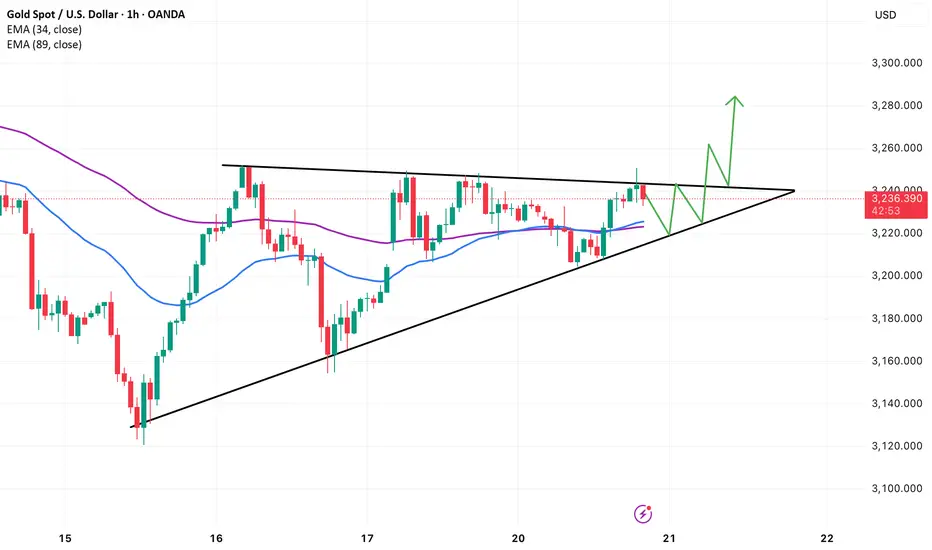
Gold breaks out of triangle patternThe world gold price has increased to 3,222 USD/ounce, continuing the strong recovery thanks to supportive factors from safe-haven sentiment. Moody's downgrade of the US long-term credit rating has fueled concerns about financial risks, while trade tensions due to the US Treasury Secretary's statement have further strengthened gold's position as a safe haven.
On the 1H chart, the price has just broken out of the ascending symmetrical triangle pattern - a technical structure that often signals the continuation of an uptrend. The breakout zone around 3,235 is currently acting as support. As long as the price holds above this zone, the possibility of gold continuing to move towards the target of 3,270–3,280 is quite high. In particular, the EMA34 and EMA89 lines are converging and preparing to create a short-term bullish crossover.
However, investors should note that if the price reverses and breaks through the bottom of the triangle (below 3,220), the bullish pattern will be negated, and the possibility of a bearish reversal will return. With the geopolitical and economic context still having many uncertainties, gold is holding the upper hand but still needs solid confirmation from price action after the breakout.
Beware of short-term bull trapsOn the H4 chart, gold is testing an important resistance zone around EMA89 (purple) after a rebound from the bottom of 3,120. However, both EMA34 and EMA89 are sloping down, indicating that the short-term trend is still bearish. The current rebound is not strong enough to confirm a reversal.
The most recent candle also has a long upper shadow, indicating that selling pressure is waiting above. If the price is rejected at the 3,250–3,260 zone and turns around to break down to 3,220, there is a high possibility that gold will retest the old bottom around 3,120.
The strategy at this time is to stay out or wait to sell lightly if a clear reversal signal appears near the resistance zone. Avoid FOMO because the rebound has not been confirmed by volume or trend structure.

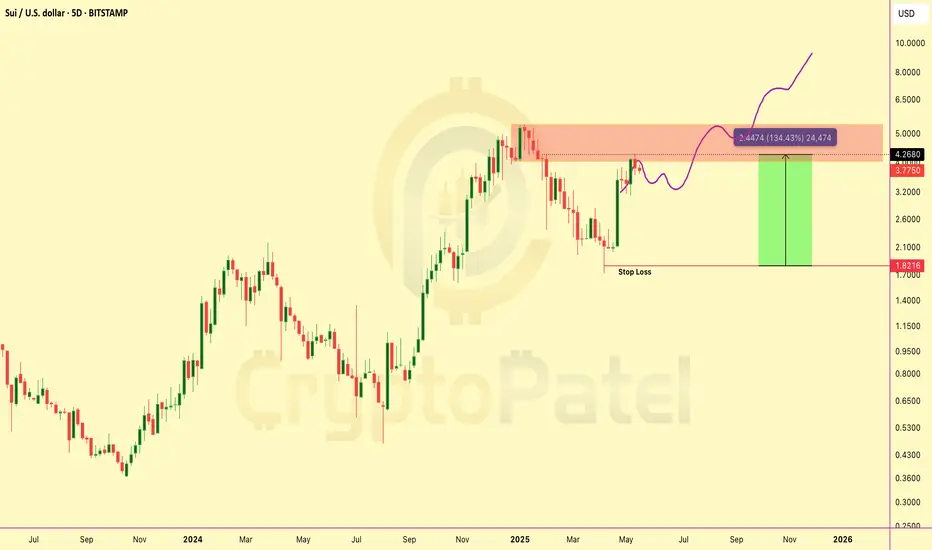
$SUI 130% up from our Entry and What Next?CRYPTOCAP:SUI pumped 130% from our entry around $2 — now hitting $4.29! Bottom perfectly caught.
Expecting a healthy pullback to ~$3 before next leg higher — that zone is ideal for fresh entries.
Long-term targets: $5/$10/$15/$20
#SUI #Altcoins
Gold breaks EMA34 – Trend is weakeningOn the D1 chart, gold has just closed below EMA34 for the first time since February. Although the price bounced back slightly from the 3,120 area today, I see that the recovery force is still weak and not enough to reverse the trend. EMA34 has started to curve down, warning that the medium-term uptrend is weakening.
If the next few sessions cannot surpass 3,240, I am inclined to the scenario that the price will continue to fall to EMA89 around 3,050–3,070. I will temporarily stay out of this area, waiting for a clearer signal before deciding to follow the buying or selling side.

Gold Loses 3,220 – Will It Fall Further?Gold has just broken through the 3,220 support and closed the H4 candle at $3,213/ounce. The strong red candle with volume shows that the sellers are still in control. I saw the EMA34 cut down to the EMA89 early and maintained a negative slope – confirming a clear downtrend.
I am watching the 3,180 – 3,200 zone as the next target. If the price rebounds but does not surpass 3,240, I will continue to sell. The current situation is not suitable for buying against the trend, especially when the USD is still strong and the safe-haven sentiment is decreasing.

GBPUSD SELLTechnically speaking, GBPUSD is in a downtrend on the 4H timeframe, with price slowly approaching a key sell area. I’ll be closely watching price action as it enters that zone to see if short positions make sense.
There are already a few potential downside targets in place, which makes the setup even more promising.
Let’s see how price reacts in that area.
