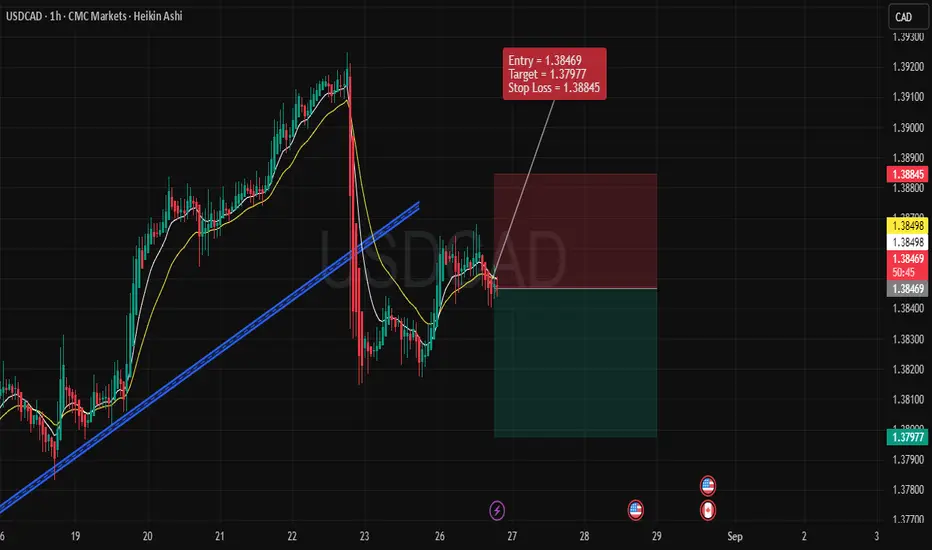
USDCAD – Bearish Trade Setup (1H Timeframe)Trade Details
Entry: 1.38469
Stop Loss: 1.38845
Target: 1.37977
🔹 Technical Reasons for Bearish Bias
Trendline Breakdown
Price recently broke below the rising trendline, indicating that the bullish momentum has weakened.
The failed retest of the broken trendline confirms bearish pressure.
Moving Averages Confirmation
The short-term moving averages (yellow lines) have crossed to the downside, aligning with bearish sentiment.
Price is trading below these moving averages, signaling sellers are in control.
Lower High Formation
After the sharp drop, the latest pullback failed to make a new higher high.
This indicates a shift from bullish structure to a bearish lower-high pattern.
Weak Recovery Attempt
The rebound after the drop is shallow and lacks strong bullish candles.
This suggests the market is unable to regain bullish momentum.
🔹 Risk Management
The Stop Loss is placed above the recent swing high (1.38845), protecting against sudden spikes.
The Target is set at 1.37977, aligning with recent support levels and offering a favorable risk-to-reward ratio.
🔹 Trade Outlook
This setup anticipates continuation of the bearish trend after the trendline break. Unless price reclaims and sustains above 1.3885, sellers remain favored in the short term. A successful breakdown could open the way for deeper downside in USDCAD.
✅ Summary:
Bearish structure confirmed by trendline break, bearish moving average alignment, and weak recovery → Entered short at 1.38469, targeting 1.37977 with stop at 1.38845.
Signalservice
Bearish Setup on BCH/USDOverview:
The market conditions and price action are currently indicating a bearish trend for BCH/USD. Below is the detailed breakdown of the trade setup and why this position is logical:
Market Structure:
The price is in a downward trend, confirmed by the lower highs and lower lows visible on the chart.
A break below key support levels, along with the current price action, suggests that the bearish move is likely to continue.
Entry Level:
Entry = 580.53: The entry has been strategically placed below a key resistance level, which is also near the recent high. This confirms that a breakdown is happening, setting the stage for further downward movement.
We are entering at a point where the price has shown weakness and failed to continue its upward movement, which typically signals a potential continuation to the downside.
Stop Loss (SL):
Stop Loss = 601.45: The stop loss has been placed above a previous swing high, ensuring that the trade will only be invalidated if the price reverses above this level, thus protecting us from a false breakout.
The chosen level ensures the risk is kept under control while still allowing for reasonable price fluctuations within the trend.
Take Profit (TP):
Target = 535.76: The target is set based on recent price action, aligning with previous support levels. This level is where the price is expected to find potential support before making any reversal.
The risk-to-reward ratio here is favorable, with a potential reward much higher than the initial risk, making the setup an attractive swing trade opportunity.
Trend Confirmation:
The price is below the 50-period and 200-period EMAs, indicating that the overall trend is bearish.
The trendline at the bottom, which slopes upward, serves as an additional support that the price is expected to break below before confirming the bearish move.
Volume:
Volume analysis indicates increasing selling pressure, supporting the bearish narrative.
A breakout with higher volume confirms the strength of the downtrend, reducing the chances of a fakeout.
Conclusion:
The overall market structure, confirmed by the price action, trend, and volume analysis, suggests that the market is likely to move lower.
With a favorable risk-to-reward ratio, this setup is logical and worth considering for those looking to enter a short position on BCH/USD.

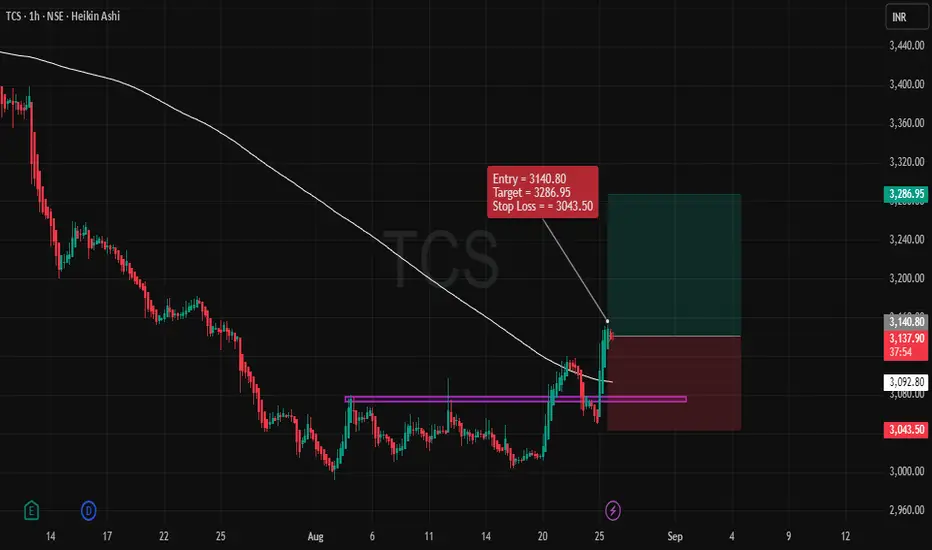
TCS – Bullish SetupSummary:
This trade setup is based on a bullish momentum seen in the recent price action of TCS. We are entering the position with the expectation that the price will continue to rise, following a significant upward breakout. The entry, stop loss (SL), and target price (TP) levels are set, and the risk-to-reward ratio (RRR) is favorable.
Key Points of the Trade:
Entry Point:
The entry for this position is at 3140.80, which is above the recent support level, indicating the continuation of the upward trend. The entry is triggered as the price has recently started to break through a key resistance zone, suggesting that the bullish momentum is likely to continue.
Stop Loss (SL):
The stop loss is set at 3043.50, just below the recent support zone. This ensures that we have a protective exit if the market reverses. Placing the stop loss here helps mitigate risk in case the trade goes against us.
Target Price (TP):
The target for this trade is 3286.95, a price level that corresponds to a recent resistance point. This target has been chosen based on the potential upside movement following the breakout, providing a good area for price to reach based on historical price action.
Risk-Reward Ratio (RRR):
With the entry at 3140.80, the stop loss at 3043.50, and the target at 3286.95, the RRR stands at 1:1.5. This is a healthy ratio, ensuring that the potential reward outweighs the risk, which is crucial for effective swing trading.
Market Context:
The price has recently bounced off a support level, and we are observing strong bullish momentum as the price moves above the resistance area. This suggests the market may continue its upward movement, making the trade setup valid.
Confirmation:
The recent price action and the movement above key levels provide confirmation of the trade. Additionally, the overall market sentiment for TCS is positive, which further validates the bullish trade idea.
Conclusion:
This trade setup is a bullish scenario for TCS, with a clear entry, stop loss, and target price. The risk-to-reward ratio is favorable, making this a logical and worthwhile trade to consider for swing trading on the 1-hour timeframe. Keep an eye on any changes in momentum or price action that may suggest a reversal, but as of now, the trend looks strong.
Bearish ADA/USD Trade Idea: Downtrend Continues1. Market Analysis:
The ADA/USD pair is currently in a strong downtrend. A downward-sloping resistance line is clearly visible, highlighting the continuing pressure on price. The pattern forming is a descending triangle, which is typically a bearish signal when the price breaks below the lower support level.
2. Entry Point:
Our entry point is at 0.8292. This is based on the price action within the triangle pattern, as the market is struggling to break the resistance and is testing the lower boundary multiple times. A breakdown below this level is anticipated, continuing the bearish momentum.
3. Stop Loss:
The stop loss is set at 0.88768. This level represents a recent swing high within the triangle pattern. If price moves back above this level, the trend reversal could be signaled, so it’s crucial to manage risk with this stop.
4. Target:
The target price is set at 0.74165. This is a key support area, previously tested, and the price action indicates that it could act as the next major level of demand. This aligns with our trade objective of riding the trend toward the next significant support.
5. Rationale:
The descending triangle is a bearish continuation pattern, and the breakout below the lower support confirms the downtrend.
Volume has been decreasing as the price approaches the triangle's apex, a common sign that the market is getting ready for a breakout.
The overall trend is bearish, and this setup aligns with the prevailing market sentiment.
6. Conclusion:
This trade idea is based on a well-formed technical pattern, with clear entry, stop loss, and target levels. By entering at 0.8292, setting a stop loss at 0.88768, and targeting 0.74165, we are positioning ourselves to profit from the continuation of the current downtrend in ADA/USD.
Make sure to monitor price action closely, as any deviation from the expected pattern might require adjustments to the trade.

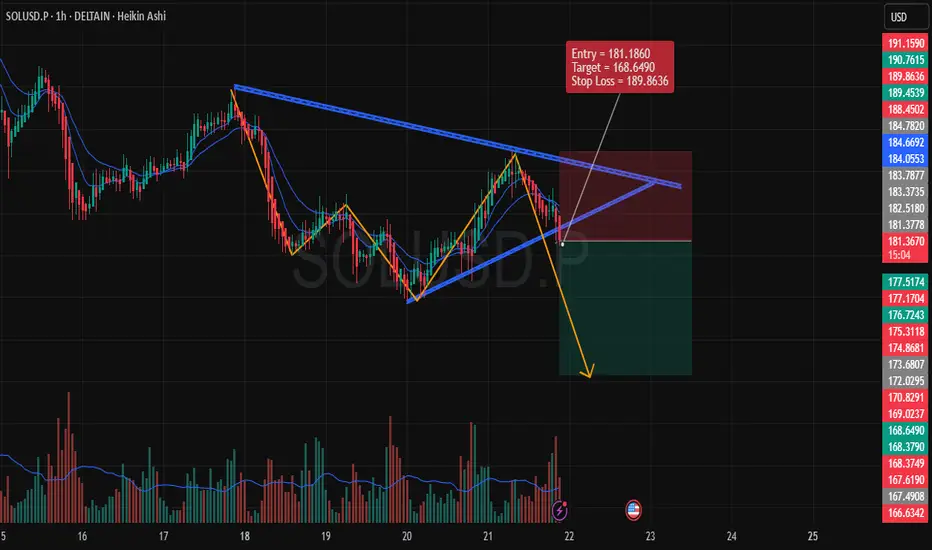
Bearish Setup on SOLUSD (1-Hour Time Frame)Entry Price: 181.1860
Target: 168.6490
Stop Loss (SL): 189.8636
1. Chart Analysis
We are observing a descending triangle pattern formation, which generally signals a bearish continuation once the price breaks downward.
The price action has already shown signs of rejection at the upper boundary of the pattern, reinforcing the possibility of a breakout to the downside.
2. Indicators & Confirmation
Volume Analysis: Noticeable spike in volume during the recent downward movement, which indicates strong selling pressure. This is crucial for confirming the potential bearish trend.
EMA Confluence: The price is below the 9 and 20 EMAs, which are crucial indicators of the current market trend. The EMAs are acting as dynamic resistance, further supporting the bearish scenario.
3. Risk Management
The stop loss is placed above the most recent significant high at 189.8636. This placement ensures that we protect against any false breakouts or short-term price reversals.
The target at 168.6490 is derived based on previous support levels and a measured move from the triangle pattern. This target is realistic given the market structure.
4. Price Action
The price action shows lower highs and lower lows, a typical characteristic of a downtrend. If this pattern holds, the next logical price move is to break downward through the support of the triangle.
5. Conclusion
Overall, this setup provides a solid bearish opportunity, backed by technical patterns and strong momentum indicators. The risk-to-reward ratio is favorable, making it a well-structured trade.
Bullish USDJPY (Long Position)Time Frame: 1-Hour
Trade Direction: Bullish
Entry Price: 148.629
Target Price: 149.262
Stop Loss: 148.108
Risk-Reward Ratio: ~2.3:1
1. Chart Analysis:
The price action has been respecting a strong ascending trendline (blue line) indicating a consistent upward momentum over the past several hours.
Price has recently bounced off the trendline and is approaching a resistance zone near 148.6, showing potential for a continuation upward towards 149.262.
Support Level: The price has previously found support at the 148.1 level, confirming a solid demand zone in the market.
2. Indicator Support:
Exponential Moving Averages (EMA): The price is currently trading above both the 9-period and 20-period EMAs, which is a bullish sign indicating upward momentum. The EMAs are also in alignment, further supporting the bullish case.
Volume Trend: There is an increase in volume accompanying the recent bullish price action, confirming strong buying interest and supporting the idea of a potential breakout towards the target.
3. Risk Management:
The stop loss is placed just below the recent low at 148.108 to provide a reasonable buffer against any price retracement, keeping the trade within an acceptable risk range.
The target is set at 149.262, just below the key resistance level, ensuring that we capture the full potential of the current trend while minimizing the risk.
4. Trade Setup Logic:
This setup is based on the continuation of the uptrend, with strong support from both the price action and indicators. The price action has successfully bounced from the trendline, confirming a potential continuation move towards higher prices.
The target lies near a resistance zone, making it a logical point for potential profit-taking.
5. Conclusion:
The overall market structure and indicators are aligned in favor of a bullish position, providing a high-probability setup. With a clear risk-reward ratio, this trade offers a favorable risk profile and a solid chance for profit.

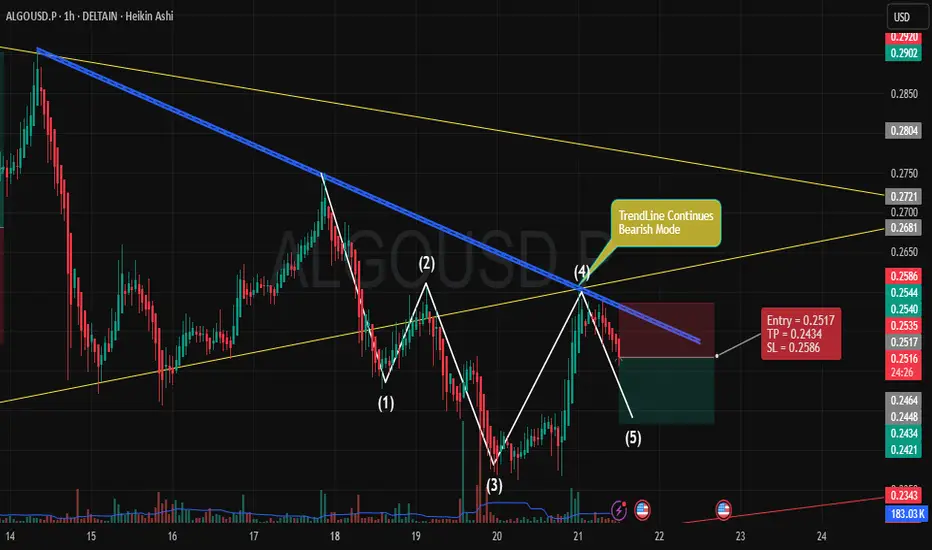
Bearish Continuation for ALGOUSD** IF you like my observation, please boost and follow for more content."
Trade Overview:
Entry: 0.2517
Stop Loss (SL): 0.2586
Take Profit (TP): 0.2434
Key Points:
Trend Analysis:
The price is currently under a bearish trend as indicated by the downward sloping blue trendline. This trendline shows consistent resistance, rejecting price rallies and continuing the bearish bias.
The yellow trendlines represent key support and resistance zones, highlighting the consolidation range where the price has been fluctuating within a defined pattern.
Market Structure:
Price has formed a lower high (marked as point 4), followed by a lower low (point 5), confirming the continuation of the downtrend. This suggests that the market is likely to keep pushing lower towards the target.
The price has retraced upwards but has failed to break the bearish trendline, reinforcing the idea of further downside potential.
Entry Strategy:
Entry Point: We are entering at 0.2517, just below the recent resistance, anticipating the price to continue downward after failing to breach the trendline.
The price action at point (4) suggests weakness in the upward movement, making this a prime opportunity to capitalize on further downside movement.
Risk-Reward Setup:
The Stop Loss is set at 0.2586, just above the last swing high, giving room for minor retracements while protecting against a breakout above the trendline.
The Take Profit is set at 0.2434, targeting the next level of support where the price could potentially find buying interest. This gives a favorable Risk-Reward Ratio of about 2:1.
Volume Confirmation:
Notice the increase in volume during the downward movement, suggesting that sellers are in control. A drop in volume during price retracements further validates the weak bullish momentum and confirms the expected continuation to the downside.
Why This Setup?
The bearish trend, price action, and trendline rejection all align with a continuation trade setup.
The risk-reward is favorable, with a clear structure to exit the trade if the price moves against the position.
The broader market context is also in line with a bearish outlook, making this a high-probability trade setup for the next few hours.
GBP/USD Bearish Trade Idea** IF you like my observation, please boost and follow for more content."
Overview:
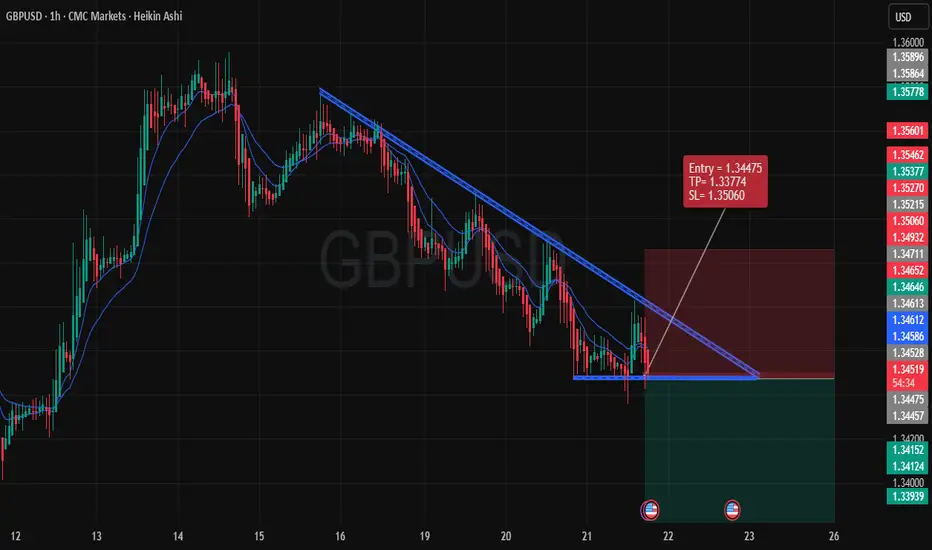
The chart displays a clear bearish setup on the 1-hour timeframe for the GBP/USD currency pair. The pair has formed a descending triangle pattern, indicating potential downward price action. The price has been respecting the trendline resistance, which adds confidence to the short trade. Here’s a detailed breakdown of the key elements for this trade:
1. Pattern Formation:
Descending Triangle: A continuation pattern that suggests consolidation and potential breakout to the downside. The price is nearing the apex of the triangle, and we anticipate the breakout to occur below the horizontal support at 1.34495.
2. Entry Point:
The entry is set at 1.34475, just below the critical horizontal support level. This level aligns with the trendline resistance from previous price action, ensuring that we are positioning ourselves at a point where price momentum is likely to shift downward.
3. Stop-Loss (SL):
The stop-loss is placed at 1.35060, just above the trendline resistance. This level is chosen to minimize the risk in case the price fails to break the support and reverses back upward. Keeping the SL tight ensures that the risk is controlled.
4. Take-Profit (TP):
The take-profit level is set at 1.33774, based on the price's potential to reach a key support zone. The target is set at a conservative level, providing a strong risk-to-reward ratio while aligning with previous price action lows.
5. Risk to Reward Ratio:
With a SL of 85 pips and a TP of 705 pips, the trade offers a favorable 1:8.3 Risk to Reward Ratio. This ensures that the reward far outweighs the risk, making it a worthy trade setup for those seeking high probability and high return trades.
6. Technical Indicators:
Trend Indicators: The 9 and 20 EMA lines confirm the bearish trend as the price is trading below these EMAs. The cross of the 9 EMA below the 20 EMA further supports the downside momentum.
Volume: A decrease in volume during the consolidation phase suggests a buildup for a breakout, likely to the downside as indicated by the pattern.
7. Conclusion:
This trade setup provides a logical bearish scenario, supported by strong technical analysis. The entry, SL, and TP are placed strategically based on price action and pattern confirmation. A breakout below the support level at 1.34475 would trigger the short position, aiming for the next significant support at 1.33774.
The risk is well-managed with a tight SL, and the reward is significant, offering an excellent risk-to-reward profile.
Make sure to monitor the breakout closely, as this setup depends on the price respecting the triangle formation.
INFY Bullish Setup** IF you like my observation, please boost and follow for more content."
Ticker: INFY
Time Frame: 1-Hour
Trade Type: Bullish
Entry Point: 1486.20
Target Price (TP): 1589.15
Stop Loss (SL): 1417.45
Risk-to-Reward Ratio (RRR): 1:1.5
Trade Setup and Rationale:
Market Context:
INFY has been showing signs of recovery, breaking out of a corrective phase. The price is currently positioned for a potential uptrend, supported by a significant bullish pattern forming on the chart.
Entry Point (1486.20):
The price has recently tested a support zone and is now showing signs of a strong reversal. The entry point is set just above this level, ensuring a confirmation of the bullish trend before committing to the trade.
Target Price (1589.15):
The target is set at a key resistance level where price is expected to face potential selling pressure. This level aligns with previous highs and is a reasonable place to lock in profits while riding the trend.
Stop Loss (1417.45):
The stop loss is placed just below the recent swing low, ensuring that the trade has a controlled risk. This placement minimizes the risk of getting stopped out in case of minor fluctuations while keeping the risk-to-reward ratio favorable.
Trade Logic:
The trade is supported by a bullish breakout pattern with increasing volume. After a period of consolidation, price action is showing signs of upward momentum, making this a high-probability trade setup.
The risk-to-reward ratio of 1:1.5 offers a balanced risk for the potential reward, providing a good trading opportunity with a well-placed stop loss.
Volume Confirmation:
Volume is showing a steady increase as the price starts moving upward, indicating that market participants are supporting the bullish move.
Trend Confirmation:
The trend is confirmed by the price breaking above previous resistance, and the bullish setup aligns with the market structure.

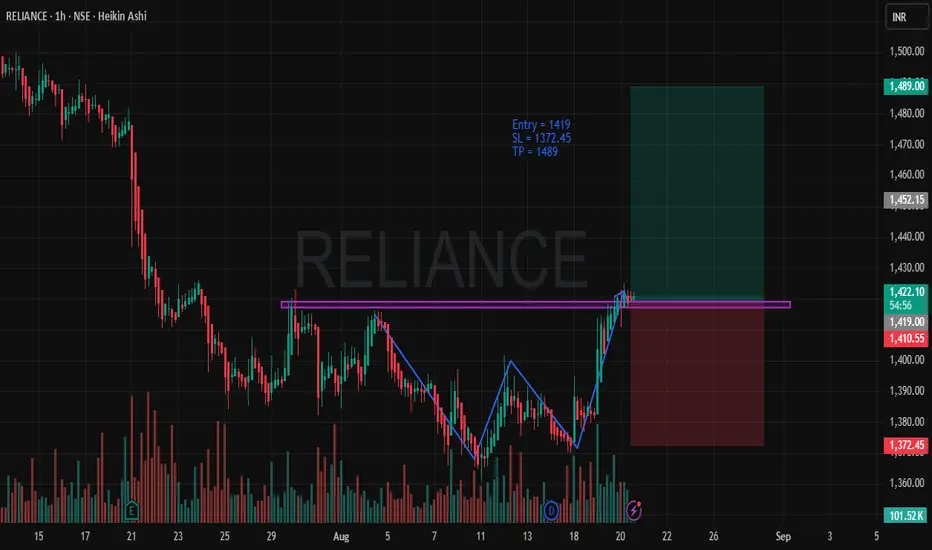
RELIANCE - Bullish SetupTimeframe: 1-Hour
Trade Type: Long Position
Entry Price: 1419
Stop Loss (SL): 1372.45
Take Profit (TP): 1489
Risk-to-Reward (RRR): 1:3.53
Trade Rationale
Bullish Trend Setup: The price action is showing a clear bullish momentum as RELIANCE has recently broken through a significant resistance level (indicated by the purple line). This breakout is a strong signal of potential upward movement.
Chart Pattern: The price forms a classic double bottom pattern (highlighted on the chart), which signifies a reversal from a downtrend to an uptrend. The pattern is confirmed with strong volume, showing the increased participation of buyers.
Entry Point: We are entering this position at 1419, right after the price breaks the resistance and starts moving upwards. This breakout marks the start of the potential rally.
Stop Loss: The SL is placed at 1372.45, just below the recent swing low, ensuring a safe exit if the market decides to reverse.
Take Profit: The TP is placed at 1489, a logical price target that accounts for a solid risk-to-reward ratio of 1:3.53. This is a reasonable expectation based on recent price action and volatility.
Volume Confirmation: Strong volume is observed, confirming the strength of the move. Typically, breakouts accompanied by high volume are more likely to continue in the breakout direction, supporting the bullish scenario.
Market Conditions: The broader market conditions appear favorable for long positions, with sentiment and technical indicators showing bullish signs across the broader market.
Risk Management
A tight Stop Loss ensures that we minimize risk in case of market retracement, while the Take Profit target allows us to ride the trend and maximize the potential return on this trade.
The Risk-to-Reward Ratio is set at 1:3.53, which aligns with sound risk management principles, allowing for substantial profits even with a lower win rate.
LOOKING TO SHORT WTI AT AROUND 76.46The market is overbought at around 76.46, we are expecting a Sell off for about 200 points, This will also mark a weekly correction. The fundamentals are currently supporting this move.

EURUSD BUYThe Company accepts no accountability or obligation for your trading and speculation results, and you consent to hold the Company innocuous for any such outcomes or misfortunes. We are not financial advisers or account managers; We are Forex traders. The recordings on this channel are rigorously for educational and amusement purposes. Trading Forex implies dangers, and you can lose all your venture ; consequently, you exclusively must take a chance.

XAU/USD- Bearish trend continues Intraday Swing LowWe will be selling the swing at around 2012 with stops at around 2020 for a test of 1994 levels, Stock market is flat, Bond is rising nicely. So we would expect another leg low today.
Reports: US treasury auctions offer $13 billion of 20 year bonds at a high yield of 4.423%

AUD/USD Sell Trade Based on Technical Analysis-Forex Pip TargetsDescription:
Embark on a lucrative trading journey with a compelling Forex opportunity that revolves around an AUD/USD sell trade, meticulously analyzed through advanced technical indicators. As the global financial markets continue to evolve, strategic traders are eyeing this potential profit-making scenario with great anticipation.
Technical Analysis Highlights:
Bearish Trend Confirmation:
Comprehensive technical analysis reveals a clear bearish trend in the AUD/USD currency pair. Multiple indicators, including moving averages, RSI (Relative Strength Index), and MACD (Moving Average Convergence Divergence), align to signal a downward trajectory, providing a solid foundation for a sell trade.
Key Resistance Levels:
Critical resistance levels have been identified through careful analysis of historical price action. These levels act as formidable barriers, further validating the potential for a downward movement in the AUD/USD pair.
Chart Patterns:
Recognizing chart patterns is crucial in predicting market movements. The presence of bearish chart patterns, such as descending triangles or head and shoulders formations, adds weight to the sell proposition, enhancing the probability of a successful trade.
Forex Pip Target Projection:
In this sell trade opportunity, traders are encouraged to set a realistic pip target to maximize profits while managing risk effectively. The Forex Pip Target for this AUD/USD sell trade is conservatively projected at pips, offering a balanced risk-reward ratio.
Risk Management Strategy:
Implementing a robust risk management strategy is paramount in navigating the uncertainties of the forex market. Traders are advised to set stop-loss orders strategically, protecting their capital from unexpected market fluctuations. Additionally, monitoring the trade closely and adjusting stop-loss levels as the market progresses is essential for optimal risk management.
Conclusion:
Seize the moment and capitalize on this carefully analyzed Forex trade opportunity in the AUD/USD pair. The sell trade, backed by comprehensive technical analysis, presents a favorable risk-reward profile, making it an attractive prospect for traders seeking potential profits. Stay informed, stay strategic, and embark on this trading endeavor with confidence.
(Note: This description is a generic example and should not be considered as financial advice. Always conduct thorough research and consider consulting with a financial professional before making trading decisions.)

DXY: Market trends todayToday DXY D1 chart stochastic is still falling sharply and the histogram is growing almost at 0, the weekly stochastic is also falling sharply and the histogram is also getting shorter so it is likely that DXY will only return to test the bottom and will continue to decline.

Gold is trending down after a recovery periodToday we will have very important USD news: ISM Manufacturing PMI, JOLTS Job Openings, ISM Manufacturing Prices and in the early morning of November 2 there will be 3 more news: Federal Funds Rate, FOMC Statement, FOMC Press Conference but This news is likely to have a big impact on gold, so we need to pay attention to orders when the news comes out
According to technical analysis, October is a month of strong growth for gold. On the monthly chart, histogram and stochastic have a divergence, RSI does not see a divergence.
Yesterday gold broke through the upward price channel so our trend will be to sell and the H1 stochastic frame is already in the oversold area so it is likely that gold will have a rebound to 1990, the price range from 1990-1992 we can sell stochastic The H4 frame still tends to go down, so the possibility of gold decreasing is very large

AUDUSD in BUY ZoneAUDUSD in BUY Zone - 4 Hour Support Zone
Buy Long @ 0.63125
SL @ 0.62832
TP @ 0.64400

The Fed maintains its hawkish stanceGold prices extended the previous day's healthy recovery from $1,900 or above three-week lows and gained stronger traction for the second straight day on Friday. Momentum lifted XAU/USD to three-day highs around the $1,915-$1,916 region during the Asian session, although a meaningful upside move still seems unlikely.
The US Dollar (USD) has pulled back from its highest since March reached on Thursday and is seen as a key factor driving some of the flows towards US Dollar-denominated Gold prices. The decline in USD may be due to profit-taking amid a slight weakening of United States (US) government bond yields. However, strong expectations that the Federal Reserve (Fed) will keep interest rates higher for longer will be a driver of US bond yields and the Greenback.

Gold price forecast todayGold prices ended five straight days of decline, trading higher at around $1,920, up 0.20% in Thursday's Asian session. However, precious metals are facing downward pressure as traders consider the possibility that the US Federal Reserve (Fed) will increase interest rates by 25 basis points (bps) until the end of 2023. .
Hawkish sentiment surrounding the Fed's policy decision at the upcoming September meeting continues to support US Treasury interest rates. This strengthens investors' confidence in the US Dollar (USD). The yield on the 10-year US Treasury note rose to 4.28%, up 0.05% at press time. The US Dollar Index (DXY) is around 104.80, measuring the value of the Greenback against six major currencies.

CPI news today will be very excitingGold prices tried to make up for the previous day's losses, trading around $1,910 per troy ounce higher in the early trading hours of Wednesday's Asian session. This currency pair is trending up due to the decrease in the value of the US Dollar (USD).
However, gold prices face challenges as the market is cautious ahead of the release of US inflation data, expected to be released later in the North American trading session.
The US consumer price index (CPI) is expected to increase 0.5% month-on-month, up from 0.2% the previous month. Meanwhile, core CPI, which excludes food and energy price fluctuations, is expected to steady at 0.2%

Will it break 1900 in the European session?On August 14, the world's third largest economy, Japan, announced GDP growth in the second quarter of 2023, with an impressive increase of 6% compared to the same period last year, much higher than the expected level. previously reported is 3.7% and forecast is 3.1%.
Along with positive economic information, the USD continued to strengthen. Specifically, the Dollar-Index - measuring the strength of the USD in a basket of 6 major currencies increased by 0.25% compared to the previous session, to 103,170 points.
When the dollar is strong, investors withdraw capital from gold to reduce deposit costs as well as find profitable investment channels. Therefore, pushing the gold price down deeply, there is no chance to reverse and increase again.

XAUUSD : Appearance of weakness in the 1900 zone?U.S. retail sales data released on Tuesday showed consumer spending remained strong in the country, potentially indicating more inflationary pressures in the coming months.
Investors mostly favor the dollar and Treasuries as a safer haven than gold, as risk appetite worsens amid worsening economic conditions across most globally, especially in China.
The greenback steadied near 1-and-a-half month highs on Wednesday, after recovering sharply from 2023 lows over the past month

GOLD 28/6 - Can the bulls hold the $1900 mark?The US Dollar experienced significant gains towards the end of last week as the Federal Reserve adjusted its perception of the interest rate trajectory.
The reaction of Treasury yields will play a crucial role in determining the outcome. If they surpass the inflation rates priced in by the market, real yields may increase slightly, potentially leading to a decline in gold prices.
Although there seems to be a double bottom pattern forming for gold at the H4 timeframe, confirmation of this pattern requires the market to break through the resistance level at $1932. Once this barrier is breached, the short-term target for gold would be $1950.
We will be monitoring the resistance level at the H4 EMA 34 for a potential selling opportunity.
SELL GOLD zone at: $1926 - $1928 - $ SL $1934 (It is best to carefully review the FOMC news before entering the order)
SELL GOLD zone at: $1942 - $1945 SL $1953
Based on technical analysis indicators EMA 34, EMA 89 with strong resistance zone $1940 - $1943
