Gold Fluctuates in Support Range; Accumulation Signals Rise⏰ Timeframe: 30m
📅 Update: 24/11/2025
🔍 Market Context
After a corrective decline from the 4,104 USD area, gold is moving within a range-bound structure with strong support at the 4,003–4,023 USD area.
The market is in a short-term re-accumulation phase, as consecutive CHoCH movements appear around the bottom area — reflecting the buying side's effort to absorb liquidity.
The selling side temporarily controls, but balancing signals are becoming clearer as the price continuously rejects breaking deeply below the Demand Zone.
📊 Technical Structure
Resistance Zone (4,090–4,104 USD): main supply area, confluence with Fibo 1.0, where profit-taking reactions are likely if the price rebounds.
Support Zone (4,023 USD): intermediate support, playing a key role in the current sideways structure.
Demand Zone (4,003 USD): potential demand area, confluence with previous liquidity bottom – main BUY Zone area.
Structure Bias: still inclined towards accumulation – recovery, as long as the price maintains above 4,003 USD.
🎯 Market Outlook
1️⃣ Priority Scenario (Buy setup):
• The price may continue to retest the Demand Zone (4,003–4,023 USD).
• When a clear reaction signal appears, expect a recovery to the Fibo 0.618 → 1.0 area, corresponding to 4,075–4,104 USD.
2️⃣ Secondary Scenario (Breakdown):
• If the price breaks below 4,003 USD, the recovery structure will be invalidated, bringing gold back to the lower liquidity area around 3,985 USD.
💎 Key Zones
BUY Zone: 4,003 – 4,023 USD
SELL Zone: 4,090 – 4,104 USD
🧠 Analyst’s View
Gold is currently in a liquidity re-accumulation phase, as both sides are testing the lower boundary of the main support area.
The buying side needs confirmation with a break above 4,075 USD, while the selling side still holds the advantage if the price cannot maintain above the balance area.
In the current context, price behavior leans towards the “Sweep – Retest – Expansion” model, with the potential for forming a short-term technical recovery wave.
🛡️ Risk Note
The market is in a low volatility area – avoid emotional actions without clear structural confirmation.
Signalsfree

Gold Technical Retracement Before Continuing Main Uptrend⏰ Timeframe: 30m
📅 Update: 11/14/2025
🔍 Market Context
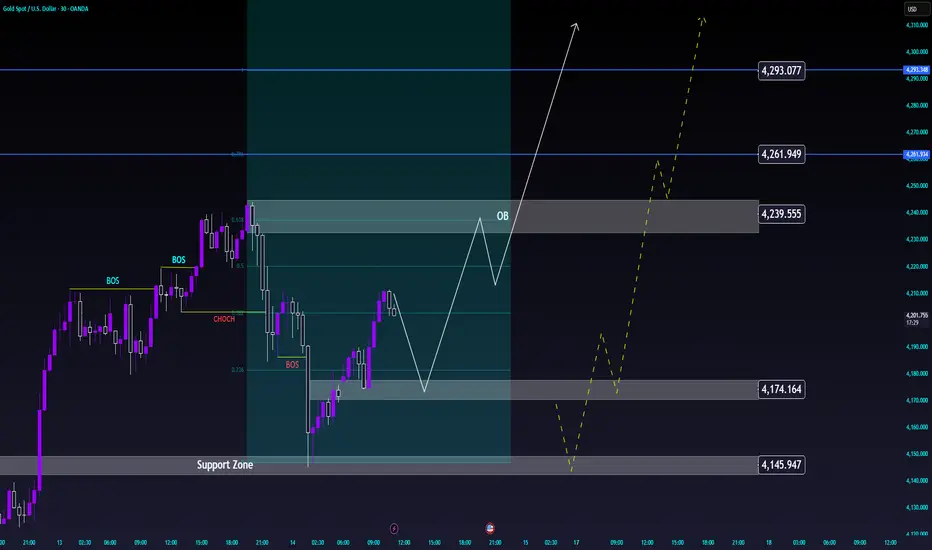
After establishing a short-term peak around 4,239 USD, gold is undergoing a technical retracement to rebalance its structure.
The most recent decline formed a Break of Structure (BOS), but the Support Zone around 4,145–4,174 USD continues to serve as a foundation for the medium-term uptrend.
The current price structure indicates the market is re-accumulating momentum before expanding again.
📊 Technical Structure
Order Block (4,239 USD): a short-term resistance zone where the price may react slightly before continuing upward.
Support Zone (4,145–4,174 USD): a confluence zone with Fibo 0.236–0.382, playing a balancing role in the current cycle.
Liquidity Targets:
• 4,261 USD – intermediate liquidity zone.
• 4,293 USD – main expansion target if the uptrend is maintained.
🎯 Market Outlook
High probability scenario:
1️⃣ The price may retrace to the Support Zone or form a higher low around 4,174 USD, then recover to the OB zone at 4,239 USD.
2️⃣ If the uptrend structure breaks, the market may test deeper towards 4,145 USD before bouncing back.
As long as the price holds above this support zone, the primary trend remains bullish continuation.
🧠 Analyst’s View
This is a phase of market re-accumulation after a rapid increase.
Maintaining a higher low structure will be a confirmation signal for the next expansion phase towards 4,261–4,293 USD.
Buyers are still controlling the cash flow, while sellers mainly participate in the short-term resistance zone.
🛡️ Risk Note
The market is in a slight correction phase – avoid impulsive actions when the price has not completed the accumulation zone.
XAU/USD – Price Accumulating in a Narrow Range, Ready to Expand⏰ Timeframe: 30m
📅 Update: 11/12/2025
🔍 Market Context
Gold maintains a neutral structure after forming a Change of Character (CHoCH) around the 4,144 USD area.
Yesterday's session witnessed a narrow fluctuation between the Demand Zone – Support Zone, indicating the market is absorbing liquidity before determining the next direction.
The medium-term upward momentum remains unbroken, but the price needs a clear balancing phase before continuation.
📊 Technical Structure
Demand Zone (4,144 USD): a short-term supply – demand area where the market previously reacted strongly, now becoming a potential testing zone.
Support Zone (4,099 USD): confluence structure – an area where buying flows may return when the price retests.
Order Block (4,081 USD): a deep defensive zone, corresponding to the main Discount area in the current cycle.
Equal Lows (EQL) & CHoCH: indicate a short-term transition between two sides, but the overall bias slightly leans towards an increase.
🎯 Market Outlook
High probability scenario for the day:
1️⃣ Price may fluctuate within the 4,099–4,144 USD balance zone to attract liquidity.
2️⃣ If a strong reaction occurs from the Support Zone or Order Block, gold may establish a new upward move towards 4,165–4,180 USD.
3️⃣ Conversely, if the price closes below 4,081 USD, the short-term structure will temporarily shift to neutral, prioritizing a re-accumulation phase.
🧠 Analyst’s View
Current price behavior reflects a “pause phase” in the larger upward structure.
When the market balances at lower levels, the key observation is not the bounce, but the reaction when liquidity is swept — where the true momentum of the trend is reignited.
As long as the price does not break the 4,081 USD mark, the medium-term upward trend remains intact.
🛡️ Risk Note
This is a technical analysis, not investment advice.
The market can change rapidly during US sessions – wait for clear confirmation from price action before participating.

XAU/USD – Gold Technical Adjustment Before Continuing Uptrend⏰ Timeframe: 30m
📅 Updated: 11/11/2025
🔍 Market Context
After a strong rally from the start of the Asian session, gold paused around 4,130–4,140 USD, indicating a temporary cooling off after a series of consecutive Break of Structure (BOS).
The current price is situated between a short-term resistance zone and a technical support (Order Block) – clearly reflecting a rebalancing behavior after a rapid expansion.
📊 Technical Structure
Resistance Zone (4,145 USD): a short-term reaction area, coinciding with a Weak High. If the price surpasses this, the uptrend structure will continue towards the Liquidity Zone around 4,198 USD.
Order Block (4,111 USD): a confluence area between 0.382–0.5 Fibonacci, likely to attract buying interest when the price adjusts.
OB Deep (4,081 USD): a deep support area, coinciding with the 0.618 Fibonacci level — where buyers might defend the main trend.
Liquidity Zone (4,198 USD): a potential expansion target if the uptrend structure is reconfirmed.
🎯 Market Outlook
High probability scenario:
1️⃣ Price technically adjusts to OB 4,111 or OB Deep 4,081, creating a reaction at the Discount area.
2️⃣ As buying momentum returns, the price may retest the Resistance Zone 4,145, then expand towards the Liquidity Zone 4,198 USD.
3️⃣ Breaking below 4,081 USD will weaken the short-term structure, shifting to a deeper rebalancing state.
🧠 Analyst’s View
This is a natural “cooldown” phase after a strong rally — the market is seeking liquidity before establishing the next upward move.
As long as the price holds above the 4,081 USD area, the main trend remains bullish.
Observing reactions at the OB will help determine if the upward momentum will continue to dominate in the US session.
🛡️ Risk Note
The market is adjusting within a larger trend — avoid emotional actions when the price has not completed the retracement phase.

Gold Soars on FOMO – 1000-Pip Opportunity Ahead!GOLD PLAN FOR 06.10 | Captain Vincent
✳️ Hello to all traders,
Today, we are not only analysing Gold (XAU/USD) from a purely technical perspective ⚙️, but also witnessing the perfect confluence between technicals and fundamental news. A bullish storm is forming, promising attractive trading opportunities.
📊 1. Technical Analysis: Sustainable Bullish Structure
From a technical standpoint, the uptrend of Gold on the H1 chart is undeniable.
🔹 Break of Structure (BoS):
Gold continuously breaks previous highs, indicating that buying pressure is completely dominant.
Each BoS point is a clear affirmation of the strength of the uptrend.
🔹 Potential Demand Zone:
After each rally, the price often takes a “pause” to accumulate.
Currently, the price may adjust to the $3,883,020 - $3,911,169 zone, where the confluence between Fair Value Gap (FVG) and Bullish Order Block (Bullish OB) – creates an ideal launchpad for the next rally.
🏦 2. Fundamental Analysis: The Fire Has Been Lit
If technicals show the way, then fundamental news is the fuel driving the uptrend.
🔸 US Government Shutdown:
This event creates political and economic instability, causing capital to flee from risky assets.
Gold – the number one safe haven – is directly benefiting as investors seek to preserve their assets.
🔸 Fed Ready to Cut Interest Rates:
The market is almost certain that the Fed will cut interest rates by 0.25%.
This reduces the appeal of the USD, further strengthening Gold's advantage, which is a non-yielding asset.
🔸 “Thirst” for Economic Data:
The government shutdown also disrupts the release of important economic data, leaving the market lacking information and increasing uncertainty.
In this environment, Gold continues to hold its safe haven role.
🎯 3. Comprehensive Trading Plan
When technicals and fundamentals align, the reliability of the trading strategy is significantly enhanced.
Strategy:
Wait to buy (Long) when the price adjusts to the demand zone $3,883,020 - $3,905,169.
Entry signals:
Observe confirmation of a bullish reversal in this zone such as:
Pin bar candles, engulfing
Or BoS on the M15 chart
Targets:
Short-term: $3950 – $3990
Long-term: Target “+1000 pips”
Risk management:
Place Stop Loss below the Bullish OB to protect the account.
🧭 Conclusion
The current market sentiment is very favourable for the Buyers:
USD is under downward pressure
Defensive capital flows are strongly moving into Gold
The FOMO effect can stimulate an extended rally
The combination of a solid technical structure and strong fundamental support is creating an almost perfect bullish picture.
👉 Be patient, stick to the plan, and await this golden opportunity.
💼 Wishing everyone an effective and victorious trading day!

(XAU/USD) – Gold likely to touch $4,000/oz: Ideal buying levels?1. Market Structure & Trend Outlook
On the H1 chart, gold is sustaining its bullish structure with higher highs and higher lows.
After the BoS (Break of Structure), price retraced near 3,862 Buy Zone and bounced upward.
At present, price trades above EMA34 and EMA89, keeping bullish bias intact.
2. Important Levels
Buy Zone: 3,862 – 3,865. Acts as short-term support. Holding above strengthens the bullish case.
OB1: 3,806 – 3,810. Next support in case Buy Zone breaks.
OB2: 3,763 – 3,770. Deeper support, triggered only if market corrects heavily.
Sell Scalping Zone (Fibo): 3,912. A short-term resistance, profit booking expected.
Sell Zone / ATH: 3,933 – 3,935. Breakout here may lead to fresh record highs.
3. Trade Setups
Bullish Setup: Buy on retest of 3,862 – 3,865.
SL: Below 3,850.
TP1: 3,912.
TP2: 3,933 – 3,935.
Bearish Setup (Defensive): If below 3,860, expect test of 3,806 – 3,810.
If this fails, price may decline towards 3,763 – 3,770.
4. Conclusion
Trend remains positive on H1. Best strategy: Buy on dips near support, manage SLs carefully, and book partial profits near resistances. Sustaining above 3,933 may open doors for new highs.

Gold awaits PCE | EMA squeeze, big waves ahead🟡 XAU/USD – 26/09 | Captain Vincent ⚓
🔎 Captain’s Log – Context & News
Trump : Announced a 100% tariff on branded drugs if not produced in the US → escalating trade tensions.
PCE tonight : The FED’s most important inflation gauge, key to shaping October rate cut expectations (current probability 91.09%).
The market is in “hold breath” mode, awaiting the PCE spark to decide the next direction.
⏩ Captain’s Summary : Gold is squeezed between two winds – short-term EMA pressure and major expectations from PCE.
📈 Captain’s Chart – Technical Analysis
EMA : EMA 34 (yellow) remains below EMA 89 (red) → short-term bearish pressure persists, but narrowing gap signals big volatility ahead.
Golden Harbor (Support / Buy Zone)
3,738 – 3,730
3,718
3,687
3,651
Storm Breaker (Resistance / Sell Zone)
3,755 – 3,773
🎯 Captain’s Map – Trade Plan
⚡ Sell (scalp at resistance)
Entry: 3,773 – 3,776
SL: 3,783
TP: 3,755 – 3,745 – 3,734
✅ Buy (trend-follow priority)
Buy Zone 1 (Scalping)
Entry: 3,72x – 3,718
SL: 3,710
TP: 3,750 – 3,769 – 3,776
Buy Zone 2 (Deeper OB)
Entry: 3,685 – 3,683
SL: 3,675
TP: 3,690 – 3,695 – 3,700 – 3,705 – 3,7xx
⚓ Captain’s Note
“The Golden sails are being squeezed between EMA 34 & 89. Golden Harbor 🏝️ (3,734 – 3,683) remains the safe dock for sailors to await the big wave. Storm Breaker 🌊 (3,773 – 3,776) is raising fierce waves, only suitable for short Quick Boarding 🚤 scalps. Tonight’s PCE will be the decisive wind – either pushing the ship beyond 3,78x or forcing it back to retest 3,72x.”
📢 If you find Captain’s Log useful, don’t forget to Follow for the latest updates.
💬 What do you think? Will Gold break through 3,78x or retest 3,72x first?

Gold under EMA pressure Buy at support,short scalp at resistance🟡 XAU/USD – Captain Vincent ⚓
🔎 Captain’s Log – Context & News
FED : Probability of a 25bps cut in October is 91.09% → almost certain.
US Calendar today : GDP, Jobless Claims, Durable Goods Orders, and especially speeches from 3 FED officials → strong volatility expected.
Gold yesterday : Dropped deeply but reacted precisely at key support → according to Vincent, this sell-off was mainly due to investors being cautious ahead of tomorrow’s CPI data.
⏩ Captain’s Summary : Short-term waves are pressured by EMAs, but the bigger voyage remains bullish – sailors prioritize Buy at Golden Harbor, only Quick Boarding 🚤 when facing Storm Breaker.
📈 Captain’s Chart – Technical Analysis (H30, EMA 34 & EMA 89)
EMA : EMA 34 (yellow) crossing below EMA 89 (red) → short-term bearish signal.
Trend : Overall still bullish, with Bullish OBs and Buy Zones below acting as strong supports.
Storm Breaker (Resistance / Sell Zone)
3,769 – 3,777 (Bearish OB)
Golden Harbor (Support / Buy Zone)
3,734 – 3,718 (Bullish OB)
3,687 – 3,685 (Buy Zone OB)
3,650 – 3,648 (Deeper Buy Zone, confluence with EMA 89)
🎯 Captain’s Map – Trade Plan
⚡ Sell (short-term scalp)
Entry: 3,776 – 3,773
SL: 3,783
TP: 3,770 – 3,765 – 3,760 – 3,755 – 3,750
✅ Buy (main priority)
Buy Zone 1 (OB)
Entry: 3,687 – 3,685
SL: 3,678
TP: 3,700 – 3,705 – 3,710 – 3,715 – 3,720
Buy Zone 2 (Deeper OB)
Entry: 3,650 – 3,648
SL: 3,638
TP: 3,665 – 3,670 – 3,675 – 3,680 – 3,685
⚓ Captain’s Note
“The Golden sails are facing headwinds from short-term EMAs, but Golden Harbor 🏝️ (3,734 – 3,650) remains a solid support dock. Storm Breaker 🌊 (3,769 – 3,777) is only suitable for short Quick Boarding 🚤 scalps. Tonight, the US sea will bring big waves from data & FED speeches – sailors, tighten your sails and manage trades with discipline.”
📢 If you find Captain’s Log useful, don’t forget to Follow for the latest updates.
💬 Do you have a different view on Gold? Drop a comment and join the crew discussion!

Gold Hits New Record: Should You Buy or Sell in This Hot Market?Namaste traders,
This past week, gold surprised everyone by closing strong. On Friday (19/09), it moved higher again, marking its 5th consecutive weekly gain at $3,683.24/oz, while futures touched $3,718.50/oz. This surge followed the Fed’s rate cut, which many thought would cool the yellow metal. So, is this a genuine rally or just a bull trap?
Fundamentals: Rate Cut Pushes Gold Higher
Lower interest rates reduce the cost of holding gold.
Fed’s dovish signals raised expectations for more easing.
In India, physical gold demand is at a 10-month high, while China also shows strong appetite despite higher prices.
Technical Outlook
Gold broke its downward trendline, signaling bullish continuation. Buyers are in control.
This Week’s View: Focus on buying near-term targets at $372x and $373x, but stay alert to macro news.
Trading Setups (with strict risk management):
Buy Scalp: $3671–$3669 | SL: $3666 | TP: $3674–$3694
Buy Zone: $3657–$3659 | SL: $3647 | TP: $3669–$3709
Sell Scalp: $3713–$3715 | SL: $3719 | TP: $3705–$3785
Sell Zone: $3731–$3733 | SL: $3741 | TP: $3723–$3683
Will gold shine brighter and set another all-time high? Share your view! 👇

Bullish Trade Setup for XRP/USD - Pattern CompletionThis is a bullish setup based on a harmonic pattern completing, with the price approaching a key resistance zone. Our entry, stop-loss (SL), and take-profit (TP) levels are clearly marked on the chart.
Entry: 3.0628
The entry point is marked when the price reaches the ideal level for the pattern completion.
Take Profit (TP): 3.1832
This is the target area where the price is expected to move towards, as per the harmonic pattern and previous price action.
Stop Loss (SL): 2.9627
The stop-loss is placed below the low of the last structure to protect from unexpected price movement.
Technical Analysis:
Pattern Identification:
A clear bullish harmonic pattern is visible, with points X, A, B, C, and D forming a potential Bat or Gartley pattern. This type of setup has historically shown a high probability of reversal or continuation at point D.
Price Action Confirmation:
The price has already shown some signs of reversal at point C, with increasing buying volume at the current levels.
The market sentiment is strong, and we are entering at a point where the pattern completion aligns with the overall bullish market structure.
Volume:
There is a noticeable increase in volume as the price approaches the resistance zone (point X), supporting the idea of a bullish breakout.
Risk-to-Reward (RRR):
The setup offers a 1:2.56 RRR, which is well within an acceptable range, ensuring that the potential reward outweighs the risk taken on the trade.
Why This Trade Makes Sense:
Pattern Confirmation: The harmonic pattern is completing, and price action aligns with the expectations of a move higher.
Key Resistance Break: If the price breaks above the marked resistance, this could signify a strong continuation of the bullish trend.
Solid Risk Management: With a well-placed stop loss, the trade is risk-managed while giving the price room to move.
This setup provides a good risk-to-reward ratio and a high probability of success, based on the technical confluence of the harmonic pattern and price action.

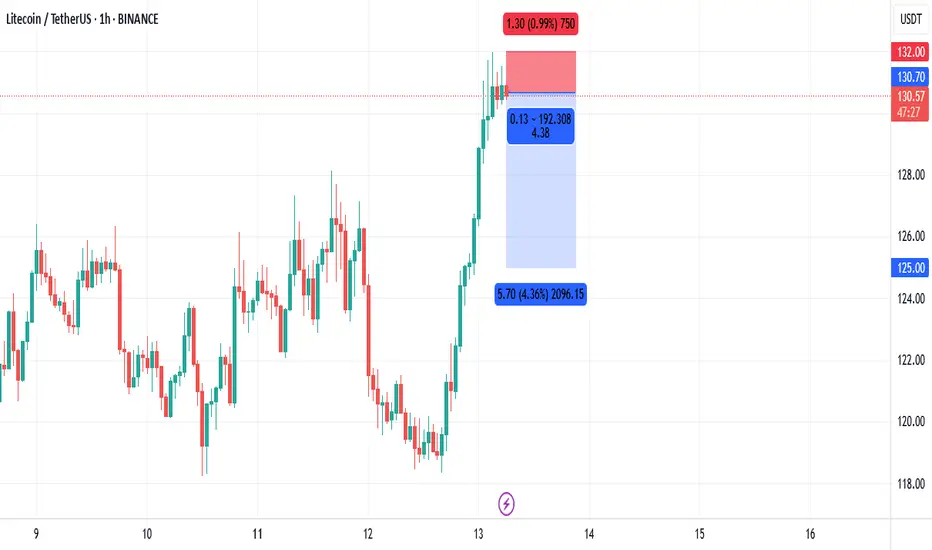
Litecoin-LTCUSDT Short Position LevelsThe Relative Strength Index (RSI) is softening from overbought levels, which could indicate a short-term correction is on the horizon. A failure to hold the $125-121 support level could trigger a move lower.
Entry-$137.70
SL-$139
TP1-$125
TP2-$120
Gold price today (February 7): Unexpected reversalGold has ended a streak of five consecutive sessions of gains, dropping by 0.4% due to pressure from the recovery of the USD and profit-taking after the precious metal continually broke records, driven by heightened demand for safe-haven assets amid concerns over escalating trade tensions.
In my opinion, the combination of the strength of the US dollar, rising bond yields, and profit-taking has put pressure on gold prices ahead of the release of the US jobs report. A Reuters survey indicates that economists expect around 170,000 jobs to have been created in the previous month, after a sharp increase to 256,000 jobs in December 2024. The unemployment rate is forecast to remain unchanged at 4.1%.
The recovery in the labor market is boosting economic growth and may allow the Federal Reserve (Fed) to halt interest rate cuts as it assesses the inflationary impact of President Donald Trump's fiscal, trade, and immigration policies.
Based on the 1-hour chart, gold is currently moving within a downward price channel, with strong resistance at 2,876. After failing to sustain its upward momentum, gold has dropped to the first support level at 2,841. If it cannot recover at this support level, it is likely that gold will decline further toward the second support level at 2,812.
To manage risk and optimize trading opportunities, a stoploss can be set just above the strong resistance at 2,876, specifically at 2,880 or 2,885, to avoid being "spiked" by short-term fluctuations. The take profit can be set at 2,815 or 2,812 if gold continues to decline and tests the support levels. However, depending on your trading strategy and risk tolerance, you may adjust these levels to suit your objectives.

DXY: The trend I predict todayLast week, the DXY Index fell below the 106 mark, then continued to fall to the 105.50-105 range. In the short term, the risk of a trend reversal will only appear if the DXY index slips below 105. The decline is driven by the Fed's dovish stance and that will likely cause the greenback to decline. at least for a short while.

Gold trading strategy todayToday we will not have important news for you to enjoy gold. According to technical analysis of the H1 chart, gold forms a triangle and we can trade in the 2002-1980 price range. In the article, I have marked the points you can enter to make profits. Good.

DXY formed a downtrendThe DXY chart on the 1D frame formed a bullish leaf, but yesterday DXY had a false breakout, so it is likely that today DXY will tend to decrease, tomorrow there will be news of Non-Farm Employment Change, if the news is bad, DXY may dropped to 104.28, on the 1D chart stochastic is in the overbought area and is trending down, RSI is also trending down. On the H4 chart, stochastic is falling very strongly and so is RSI, so it is likely that DXY today will fall in the range of 106.12 - 105.68 and 105.68 also coincides with the 200 EMA, tomorrow there is news that DXY may fall to 104.28.

Technical analysis and news for today's gold trading strategyOn the 1D chart, gold has formed a doji candle, and the FED still maintains the interest rate at 5.50%. In yesterday's press conference, Mr. Powell continued to bring inflation down to 2%, and when the FED has not brought inflation down to 2-2.5%, they still did not reduce interest rates. Mr. Powell emphasized that short-term monetary policy The regime currently in place will continue until inflation and other data dissuade the Fed from maintaining the current interest rate, at which point they will begin to think about reducing interest rates, he also said that the restrictive policies The currency has not yet brought inflation down to 2%. The SPDR fund started buying in small quantities. According to technical analysis, gold is likely to increase and the immediate target is that gold will break the EMA 20, then gold can go up to retest the price increase channel. Currently, daily Stochastic is falling, the histogram has also shown signs of decreasing, RSI has also left the overbought area and is at 64. On the H4 frame, stochastic is in the oversold area and is trending up. Histogram has begun to grow negative. On the H1 chart, the histogram is growing negative and the stochastic is pointing up, showing that it is recovering, showing that gold today will sideway from about 1985-1975 and 1975-1991.

Gold is trending down after a recovery periodToday we will have very important USD news: ISM Manufacturing PMI, JOLTS Job Openings, ISM Manufacturing Prices and in the early morning of November 2 there will be 3 more news: Federal Funds Rate, FOMC Statement, FOMC Press Conference but This news is likely to have a big impact on gold, so we need to pay attention to orders when the news comes out
According to technical analysis, October is a month of strong growth for gold. On the monthly chart, histogram and stochastic have a divergence, RSI does not see a divergence.
Yesterday gold broke through the upward price channel so our trend will be to sell and the H1 stochastic frame is already in the oversold area so it is likely that gold will have a rebound to 1990, the price range from 1990-1992 we can sell stochastic The H4 frame still tends to go down, so the possibility of gold decreasing is very large

GOLD 03/7 - 7/7: Expected bullish recoveryIn the past week, central banks have indicated their intention to tighten monetary policy, leading to a drop in gold prices below $1900.
Despite the possibility of an interest rate hike and a decrease in demand for physical gold, the US economy has shown signs of solid recovery with positive GDP growth in Q1 and continued consumer demand driving GDP growth.
From a technical standpoint, last Friday's retracement suggests a possible rebound in gold prices, offering hope for a recovery.
For this week, I plan to place short-term Buy orders. To start, I will wait for the price zone between $1915 and $1912 to be retested. Once that happens, I will make a purchase with a target of $1930 and $1940 for this week.
Additionally, if the market reacts at these levels, I will also consider setting up Scalp orders at $1930 and $1940.

EURUSD Technical Analysis
Welcome back Traders, Investors, and Community!
Here on EURUSD the price has formed a Reverse Head & Shoulders, which is suggesting the bullish trend if it breaks out of the Neckline and shows us a potential entry after the breakout. However the price might go lower to 1.1868 for the Pullback before it goes up.
Traders, Please hit the 👍 LIKE button if you like this idea and if you have your own opinion about this, please write your it in the comment box . We will be glad for this.
We will have more FREE forecasts in TradingView soon
❤️ Your Support is really appreciated!❤️
Have a Profitable Day

XAUUSD Technical Analysis
Gold is in strong downtrend and can clearly see more big red candles than the green ones which suggests the price has tendency to go lower. We already had a Pullback at 1795.36 and the second Pullback might happen again which would make a double top at 1795.36, but if it doesn't happen we expect the price to go lower to at least 1743.16
Have a Profitable Day
If you find this helpful and want more FREE forecasts in TradingView
Please show your support back,
Hit the 👍 LIKE button,
Drop some feedback below in the comment!
❤️ Your Support is really appreciated!❤️

DOGEUSDT Technical Analysis
Very clear downtrend on the 1 hour time frame. After the price broke below the Support and got out of the Triangle with a long big red candle it's expected to go lower to 0.25 and even lower to 0.225. there might be a pullback which might happen at the Resistance line of the triangle. but most likely it will go lower.
Have a Profitable Day
If you find this helpful and want more FREE forecasts in TradingView
Please show your support back,
Hit the 👍 LIKE button,
Drop some feedback below in the comment!
❤️ Your Support is really appreciated!❤️

XRPUSDT Technical Analysis
So here on XRPUSDT the price has formed a descending Triangle at the Support zone and has got 3 rejections. It is expected that the prices breaks above the Resistance line and goes higher up to 1.04
If the breakout happened at the lower time frame we need to see the candlestick patterns and if we see a Bullish pattern we can go long.
However if it breaks below the Support then after a Pullback it's expected to go lower down to 0.532
Have a Profitable Day
If you find this helpful and want more FREE forecasts in TradingView
Please show your support back,
Hit the 👍 LIKE button,
Drop some feedback below in the comment!
❤️ Your Support is really appreciated!❤️

BTCUSDT Technical Analysis
Here on the 1 hour time frame we see that BTC is in a Bullish channel and has got 3 rejections from the Support line. On the other hand the price is right at the previous Resistance turned into Support which is suggesting the price might go higher from this level. If the Pullback happens it must be around 37978.0
TP1 @ 39690.0
TP2 @ 41078.0
TP3 @ 43748.6
SL @ 37365.0
Happy Trading :)
If you find this helpful and want more FREE forecasts in TradingView
Please show your support back,
Hit the 👍 LIKE button,
Drop some feedback below in the comment!
❤️ Your Support is really appreciated!❤️
