Gold under EMA pressure Buy at support,short scalp at resistance🟡 XAU/USD – Captain Vincent ⚓
🔎 Captain’s Log – Context & News
FED : Probability of a 25bps cut in October is 91.09% → almost certain.
US Calendar today : GDP, Jobless Claims, Durable Goods Orders, and especially speeches from 3 FED officials → strong volatility expected.
Gold yesterday : Dropped deeply but reacted precisely at key support → according to Vincent, this sell-off was mainly due to investors being cautious ahead of tomorrow’s CPI data.
⏩ Captain’s Summary : Short-term waves are pressured by EMAs, but the bigger voyage remains bullish – sailors prioritize Buy at Golden Harbor, only Quick Boarding 🚤 when facing Storm Breaker.
📈 Captain’s Chart – Technical Analysis (H30, EMA 34 & EMA 89)
EMA : EMA 34 (yellow) crossing below EMA 89 (red) → short-term bearish signal.
Trend : Overall still bullish, with Bullish OBs and Buy Zones below acting as strong supports.
Storm Breaker (Resistance / Sell Zone)
3,769 – 3,777 (Bearish OB)
Golden Harbor (Support / Buy Zone)
3,734 – 3,718 (Bullish OB)
3,687 – 3,685 (Buy Zone OB)
3,650 – 3,648 (Deeper Buy Zone, confluence with EMA 89)
🎯 Captain’s Map – Trade Plan
⚡ Sell (short-term scalp)
Entry: 3,776 – 3,773
SL: 3,783
TP: 3,770 – 3,765 – 3,760 – 3,755 – 3,750
✅ Buy (main priority)
Buy Zone 1 (OB)
Entry: 3,687 – 3,685
SL: 3,678
TP: 3,700 – 3,705 – 3,710 – 3,715 – 3,720
Buy Zone 2 (Deeper OB)
Entry: 3,650 – 3,648
SL: 3,638
TP: 3,665 – 3,670 – 3,675 – 3,680 – 3,685
⚓ Captain’s Note
“The Golden sails are facing headwinds from short-term EMAs, but Golden Harbor 🏝️ (3,734 – 3,650) remains a solid support dock. Storm Breaker 🌊 (3,769 – 3,777) is only suitable for short Quick Boarding 🚤 scalps. Tonight, the US sea will bring big waves from data & FED speeches – sailors, tighten your sails and manage trades with discipline.”
📢 If you find Captain’s Log useful, don’t forget to Follow for the latest updates.
💬 Do you have a different view on Gold? Drop a comment and join the crew discussion!
Signalsprovider

Bearish Trade Setup for SOLUSDOverview:
This is a short position on SOLUSD, entering on the 1-hour chart with a well-defined risk-to-reward ratio. The trade is based on a downward trend confirmed by the price action and EMAs, making this a high-probability bearish scenario.
Key Levels and Indicators:
Entry Point: 186.6736
The entry is triggered when the price moves below the resistance level. This confirms the continuation of the downtrend.
Stop Loss: 202.2042
The stop loss is set above the most recent swing high to protect from any sudden price reversals. This level is designed to avoid a whipsaw and ensures the trade is kept within a reasonable risk range.
Target: 155.5356
The target is calculated based on a projected price movement in line with the current trend. Given the current market structure, this target provides an optimal reward-to-risk ratio.
Why is this a Bearish Setup?
Trend Confirmation:
The price has been consistently moving lower, showing strong bearish momentum. The EMAs (9 and 20) are also sloping downwards, reinforcing the likelihood of further downside movement.
Price Action:
The recent price action has formed lower highs and lower lows, a key indication of a strong downtrend.
EMA Alignment:
The 9-period EMA (188.6387) is below the 20-period EMA (192.3233), a classic bearish crossover that confirms the downward bias of the market.
Risk-to-Reward Setup:
The trade offers an excellent risk-to-reward ratio of approximately 1:3, which ensures that potential profits outweigh the risk taken on the trade.
Trade Management:
Entry Criteria: Enter the position when the price breaks below the support zone, ideally near the entry point.
Exit Strategy: Target is set at 155.5356, but keep an eye on the price action in case a trend reversal occurs before hitting the target. Always adjust the stop loss to lock in profits as the price moves in your favor.
Final Thoughts:
This is a well-structured bearish trade idea based on both technical analysis and price action. Always ensure that you follow proper risk management rules and adjust your stop loss or take profit levels based on market conditions.

SOLUSD Short trade @205Overall Crypto market is under correction mode. After sharp fall SOLUSD showed some pullback @205 levels and that’s the best entry price to enter for a Short trade. Risk reward ratio is 1:2.5 in this trade.
Entry - 205
Target -198
SL - 207.80

BNB/USDT – Bullish Breakout Trade Idea✅ Entry: 871.564
🎯 Target: 890.455
⛔ Stop Loss: 862.304
🔎 Trade Rationale:
Ascending Triangle Breakout – Price has respected the rising trendline and finally broken above the neckline resistance, signaling bullish continuation.
Volume Confirmation – A notable increase in buying volume supports the breakout strength.
Resistance Flip – The previous supply zone around 870 has turned into support, adding confluence.
📊 With a strong bullish structure and favorable RRR, this setup aims to capture the next push towards 890 zone.
⚠️ Disclaimer: This is not financial advice. Always do your own research and manage risk before trading.

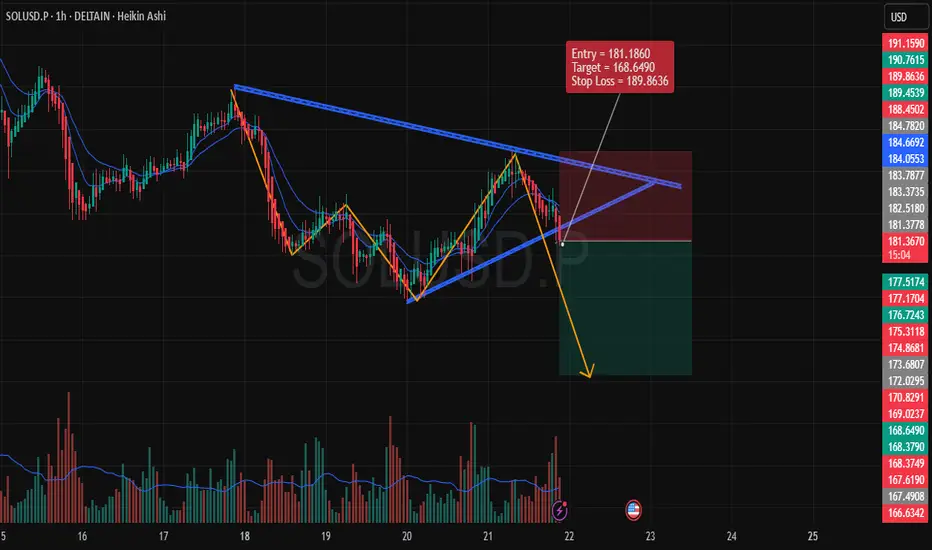
Bearish Setup on SOLUSD (1-Hour Time Frame)Entry Price: 181.1860
Target: 168.6490
Stop Loss (SL): 189.8636
1. Chart Analysis
We are observing a descending triangle pattern formation, which generally signals a bearish continuation once the price breaks downward.
The price action has already shown signs of rejection at the upper boundary of the pattern, reinforcing the possibility of a breakout to the downside.
2. Indicators & Confirmation
Volume Analysis: Noticeable spike in volume during the recent downward movement, which indicates strong selling pressure. This is crucial for confirming the potential bearish trend.
EMA Confluence: The price is below the 9 and 20 EMAs, which are crucial indicators of the current market trend. The EMAs are acting as dynamic resistance, further supporting the bearish scenario.
3. Risk Management
The stop loss is placed above the most recent significant high at 189.8636. This placement ensures that we protect against any false breakouts or short-term price reversals.
The target at 168.6490 is derived based on previous support levels and a measured move from the triangle pattern. This target is realistic given the market structure.
4. Price Action
The price action shows lower highs and lower lows, a typical characteristic of a downtrend. If this pattern holds, the next logical price move is to break downward through the support of the triangle.
5. Conclusion
Overall, this setup provides a solid bearish opportunity, backed by technical patterns and strong momentum indicators. The risk-to-reward ratio is favorable, making it a well-structured trade.
Bullish USDJPY (Long Position)Time Frame: 1-Hour
Trade Direction: Bullish
Entry Price: 148.629
Target Price: 149.262
Stop Loss: 148.108
Risk-Reward Ratio: ~2.3:1
1. Chart Analysis:
The price action has been respecting a strong ascending trendline (blue line) indicating a consistent upward momentum over the past several hours.
Price has recently bounced off the trendline and is approaching a resistance zone near 148.6, showing potential for a continuation upward towards 149.262.
Support Level: The price has previously found support at the 148.1 level, confirming a solid demand zone in the market.
2. Indicator Support:
Exponential Moving Averages (EMA): The price is currently trading above both the 9-period and 20-period EMAs, which is a bullish sign indicating upward momentum. The EMAs are also in alignment, further supporting the bullish case.
Volume Trend: There is an increase in volume accompanying the recent bullish price action, confirming strong buying interest and supporting the idea of a potential breakout towards the target.
3. Risk Management:
The stop loss is placed just below the recent low at 148.108 to provide a reasonable buffer against any price retracement, keeping the trade within an acceptable risk range.
The target is set at 149.262, just below the key resistance level, ensuring that we capture the full potential of the current trend while minimizing the risk.
4. Trade Setup Logic:
This setup is based on the continuation of the uptrend, with strong support from both the price action and indicators. The price action has successfully bounced from the trendline, confirming a potential continuation move towards higher prices.
The target lies near a resistance zone, making it a logical point for potential profit-taking.
5. Conclusion:
The overall market structure and indicators are aligned in favor of a bullish position, providing a high-probability setup. With a clear risk-reward ratio, this trade offers a favorable risk profile and a solid chance for profit.

GBP/USD Bearish Trade Idea** IF you like my observation, please boost and follow for more content."
Overview:
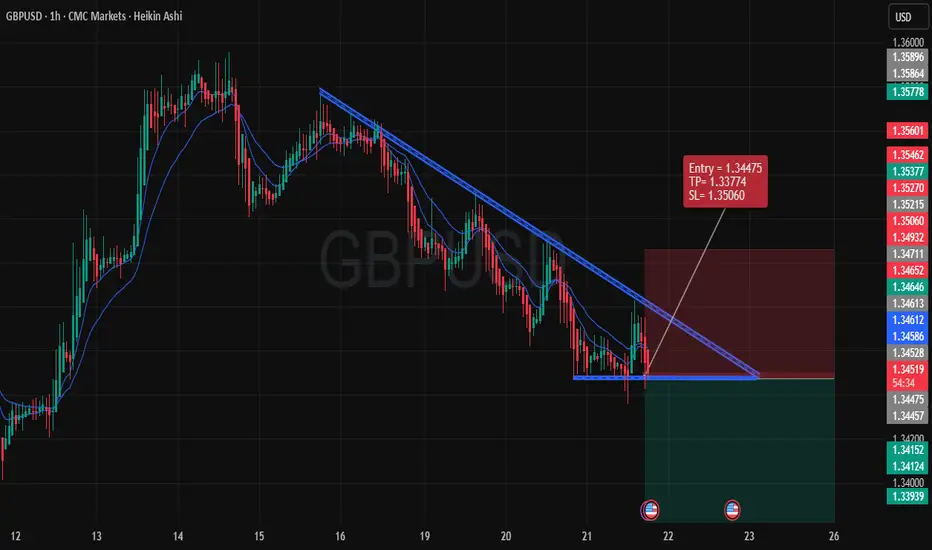
The chart displays a clear bearish setup on the 1-hour timeframe for the GBP/USD currency pair. The pair has formed a descending triangle pattern, indicating potential downward price action. The price has been respecting the trendline resistance, which adds confidence to the short trade. Here’s a detailed breakdown of the key elements for this trade:
1. Pattern Formation:
Descending Triangle: A continuation pattern that suggests consolidation and potential breakout to the downside. The price is nearing the apex of the triangle, and we anticipate the breakout to occur below the horizontal support at 1.34495.
2. Entry Point:
The entry is set at 1.34475, just below the critical horizontal support level. This level aligns with the trendline resistance from previous price action, ensuring that we are positioning ourselves at a point where price momentum is likely to shift downward.
3. Stop-Loss (SL):
The stop-loss is placed at 1.35060, just above the trendline resistance. This level is chosen to minimize the risk in case the price fails to break the support and reverses back upward. Keeping the SL tight ensures that the risk is controlled.
4. Take-Profit (TP):
The take-profit level is set at 1.33774, based on the price's potential to reach a key support zone. The target is set at a conservative level, providing a strong risk-to-reward ratio while aligning with previous price action lows.
5. Risk to Reward Ratio:
With a SL of 85 pips and a TP of 705 pips, the trade offers a favorable 1:8.3 Risk to Reward Ratio. This ensures that the reward far outweighs the risk, making it a worthy trade setup for those seeking high probability and high return trades.
6. Technical Indicators:
Trend Indicators: The 9 and 20 EMA lines confirm the bearish trend as the price is trading below these EMAs. The cross of the 9 EMA below the 20 EMA further supports the downside momentum.
Volume: A decrease in volume during the consolidation phase suggests a buildup for a breakout, likely to the downside as indicated by the pattern.
7. Conclusion:
This trade setup provides a logical bearish scenario, supported by strong technical analysis. The entry, SL, and TP are placed strategically based on price action and pattern confirmation. A breakout below the support level at 1.34475 would trigger the short position, aiming for the next significant support at 1.33774.
The risk is well-managed with a tight SL, and the reward is significant, offering an excellent risk-to-reward profile.
Make sure to monitor the breakout closely, as this setup depends on the price respecting the triangle formation.
Gold Trading Strategy XAUUSD July 31, 2025Yesterday's trading session, after breaking the rising price channel in the 3318 - 3320 area, the gold price fell sharply to the 3269 area.
Basic news: US Treasury yields fell and the weak US labor market report could boost investor demand. Data released by the US Department of Labor on Tuesday showed that the number of new jobs fell in June after 2 consecutive months of increase. Today, the Federal Reserve will announce a new interest rate decision.
Technical analysis: The rising price channel in the H1 frame was broken, and the gold price immediately fell sharply. Currently, the downtrend of gold is still maintained. The MA lines are still resistance for gold prices.
Important price zones today: 3300 - 3305, 330 - 3325 and 3267 - 3272.
Today's trading trend: SELL.
Recommended orders:
Plan 1: SELL XAUUSD zone 3303 - 3305
SL 3308
TP 3300 - 3290 - 3280 - 3270.
Plan 2: SELL XAUUSD zone 3323 - 3325
SL 3328
TP 3320 - 3310 - 3290 - 3280.
Plan 3: BUY XAUUSD zone 3267 - 3269
SL 3264
TP 3272 - 3282 - 3292 - 3302 (small volume).
Wish you a safe, favorable and profitable trading day.🌟🌟🌟🌟🌟

Tesla Next Target is Top of the Channel +26% ROITesla, a Breakout occurred from the Triangle Pattern after reaching the 0.5 Fibonacci Retracement level, and it's also trading within a Channel Pattern. The Next Target is the Top of the Channel.

LINK : Next Target 11 USDThe Downtrend Trendline has been Breakout, signaling an Uptrend Continuation with the Next Target at 11 USD.
I want to help People Make Profit all over the World.

AUD/USD Sell Trade Based on Technical Analysis-Forex Pip TargetsDescription:
Embark on a lucrative trading journey with a compelling Forex opportunity that revolves around an AUD/USD sell trade, meticulously analyzed through advanced technical indicators. As the global financial markets continue to evolve, strategic traders are eyeing this potential profit-making scenario with great anticipation.
Technical Analysis Highlights:
Bearish Trend Confirmation:
Comprehensive technical analysis reveals a clear bearish trend in the AUD/USD currency pair. Multiple indicators, including moving averages, RSI (Relative Strength Index), and MACD (Moving Average Convergence Divergence), align to signal a downward trajectory, providing a solid foundation for a sell trade.
Key Resistance Levels:
Critical resistance levels have been identified through careful analysis of historical price action. These levels act as formidable barriers, further validating the potential for a downward movement in the AUD/USD pair.
Chart Patterns:
Recognizing chart patterns is crucial in predicting market movements. The presence of bearish chart patterns, such as descending triangles or head and shoulders formations, adds weight to the sell proposition, enhancing the probability of a successful trade.
Forex Pip Target Projection:
In this sell trade opportunity, traders are encouraged to set a realistic pip target to maximize profits while managing risk effectively. The Forex Pip Target for this AUD/USD sell trade is conservatively projected at pips, offering a balanced risk-reward ratio.
Risk Management Strategy:
Implementing a robust risk management strategy is paramount in navigating the uncertainties of the forex market. Traders are advised to set stop-loss orders strategically, protecting their capital from unexpected market fluctuations. Additionally, monitoring the trade closely and adjusting stop-loss levels as the market progresses is essential for optimal risk management.
Conclusion:
Seize the moment and capitalize on this carefully analyzed Forex trade opportunity in the AUD/USD pair. The sell trade, backed by comprehensive technical analysis, presents a favorable risk-reward profile, making it an attractive prospect for traders seeking potential profits. Stay informed, stay strategic, and embark on this trading endeavor with confidence.
(Note: This description is a generic example and should not be considered as financial advice. Always conduct thorough research and consider consulting with a financial professional before making trading decisions.)

AUDUSD in BUY ZoneAUDUSD in BUY Zone - 4 Hour Support Zone
Buy Long @ 0.63125
SL @ 0.62832
TP @ 0.64400

#NEARUSDT
REASON
1)DOWNTREND
2)GOOD SUPPLY AND DEMAND
DOWN
1) in a DOWN trend
2) In Breakout
3) High Volatile#NEAR/USDT
Signal Type: Long
Leverage: Cross 20x
Entry Targets: 5.049 5.00
Take-Profit Targets:
1) 5.073
2) 5.100
3) 5.123
4) 5.150
5) 5.175
6) 5.200
7) 5.250
8) 5.300
Stop-Loss: 4.95

USDCAD Sell trade opportunitiesUSDCAD Sell trade opportunities
USDCAD currently bearish trend and is expecting to breakout if it closes below the support area with a very strong Bearish candle then market will be further moving into a bearish phase after confirmation of a breakout wait to retracement then enter in sell trade with a very good risk rewards
"Always trade with Stop Loss"

SHORT BTC/USDTBINANCE:BTCUSDT
SHORT BTC
Short/Sell BTC
CMP :48832
Target :39515
Stop Loss :53237
Signal: Negative
Sentiment: Negative
Crossover: Negative
Timeframe: 5-7 days
Probability: Medium
Note: Some sideways movement expected before the fall.
ABOUT MYSELF:
I am a certified blockchain developer (PG Master's) from a top Canadian University.
I have a bachelors in computer science (B.Tech) from a A grade university in India.
I have developed a AI powered code that provides signals for capital markets.
Accuracy till date: 72%
DISCLAIMER:
This is not an investment advice. Just for discussion/paper trading purposes.
Need any specific coin? DM me on Tradingview.

GJ long this another amazing trade on gj catch 30 pips on that lets goo if you wanna get same trade as me Dm me

MATICUSDT Technical Analysis
Happy Monday guys, I'm here with another Signal
MATICUSDT has broken above a major Resistance and now it's ranging. because of the big Green candle I think it's gonna go higher how ever it might Pullback to 1.3 before it rises. So we need be cautious to see the price action.
Buy now or Buy at 1.300
SL @ 1.23
TP1 @ 1.5
TP2 @ 1.67
Happy Trading :)
If you find this helpful and want more FREE forecasts in TradingView
Please show your support back,
Hit the 👍 LIKE button,
Drop some feedback below in the comment!
❤️ Your Support is very Really appreciated!❤️

XLMUSDT Technical AnalysisXLMUSDT has formed a Falling Wedge with 4 rejection at the Resistance and 3 Rejection at the Support. Meanwhile we see a Divergence in RSI which indicates a potential uptrend. There might be the 5th Rejection at the Resistance also or it might just break above the Resistance and goes higher. If we get the 5th Rejection at the Resistance then a Pullback to 0.283 is expected before the price goes higher to at least 0.352. In either cases we need to see the lower time frame before we enter any trade. If we get the confirmation at the lower time frames it would be safe to enter.
Buy at Resistance Breakout or Buy at 0.283
SL @ 0.26
TP1 @ 0.352
TP2 @ 0.434
TP3 @ 0.53
Happy Trading :)

new strategy signals to make more money so follow me follow for more free sigals that makes more money, please always us e trail stop , so then you can make money 100% do what i say in the signals, all signals will be sent by trading view from tommorow iam gonna give signals

GBPUSD - DAY TRADE VIEW.GBPUSD - It's one of the rarest days we are witnessing today, I suggest you to trade with small lots.
My approach at this point of time in GBPUSD will be a short sell at current price 1.28500
Potential target 1.27680 Maintain stop loss at 1.29000
Traders, if you liked this idea hit the like button & write in the comment section.
Why you should follow this tradingview account ?
Managed by top most renowned trader - Pulak Priyesh
10 + years of trading experience
Professional Day trader
Excellence award winning mentor
Professional chart, clear chart without junks.
Major S/R levels with inner insights
Frequent Day & Swing trade levels
All major and minor FX/INDICES covered
Thanks !!

EURUSD BUY @ 1.1050 Hi Friends,
EURUSD trading on final leg of complex corrective pattern on medium term. On short term price reached its monthly support levels and also as per wave count i am expecting EURUSD found minor bottom @ 1.1050 level. From here i am looking corrective upside upto 1.1130 level.We can clearly see wave 2 of this count took more sideways action so wave 4 we can expect sharp move.
ENTRY & EXIT LEVELS:
LONG @ 1.1050 -- SL @ 1.1000 --- TP @ 1.1130

BTCUSD LONG @ 9100HI FRIENDS,
BTCUSD approaching intermediate wave bottom @ 9100 level, wave B of b completed at this level. Wave B of c target upto 12500 to 12900 level.
ENTER LONG @ 9100 -- SL @ 8000 -- TP @ 12500

XLMBTC Looking Very Good For Trade.XLMBTC Looking too Hot Here Below is the reason why you
need to watch XLMBTC
Holding Previous Support level
Adam & Eve on the making.
Daily Candle is looks like dragonfly doji .
Note: This is only for Educational Purpose this is not an Investment advice.
Please support the setup with your likes, comments and by following on Trading View.
Thanks
Adil Khan
