#SILVER #XAGUSD a 50%upward correction seems completeSilver spurt up in Wave C to complete Wave Y as indicated few hours back. This now seems to have reached the minimum corrective move. If the correction is complete, then we should head down in a large move making new lows. For now a move below 24.20 , the wave B low should confirm the down move has started.
An earlier entry may be possible, will see how this plays out and publish when clear
The larger trend is now down
GOLD should play out in similar fashion
Silver

#SILVER #XAGUSD Yet to complete wave Y, should head higher Silver has been moving sideways for few days and this recent move looks like a Wave B which should now resolve with a Wac c to complete the larger Y. The larger trend remains down so this will help us get better prices to go short
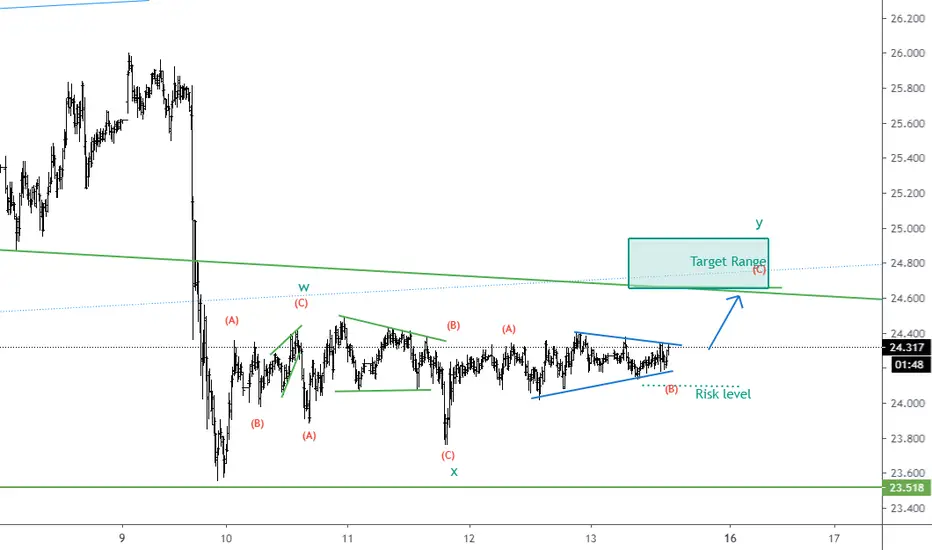
#SILVER #XAGUSD headed for a short upmove in a corrective rallySilver's recent upward to sideways can be counted as an incomplete WXY Flat. Subdivisions of Wave Y is in its final stages. An upmove to the 24.60 -24.80 should complete the rally . The larger downtrend should then resume.


#SILVER # XAGUSD can turn to a new low nowSilver seems to have completed its "Y" wave with the recent sharp move to the $26 / INR 66000 area. This also hit the top of the corrective channel and seems to have a full wave structure. Silver now seems headed to a new low, stop losses will be recent highs made last week $26.05 .


SILVER (XAGUSD) - Weekly Technical Analysis UpdateMidterm forecast:
While the price is above the support 22.15, resumption of uptrend is expected.
We make sure when the resistance at 26.20 breaks.
If the support at 22.15 is broken, the short-term forecast -resumption of uptrend- will be invalid.
Technical analysis:
The RSI resistance #1 at 56 is broken, so the probability of resumption of uptrend is increased.
A trough is formed in daily chart at 22.58 on 10/29/2020, so more gains maximum to Major Resistance (26.20) is expected.
Price is above WEMA21, if price drops more, this line can act as dynamic support against more losses.
Relative strength index (RSI) is 60.
❤️ If you find this helpful and want more FREE forecasts in TradingView
. . . . . Please show your support back,
. . . . . . . . Hit the 👍 LIKE button,
. . . . . . . . . . Drop some feedback below in the comment!
❤️ Your Support is very much 🙏 appreciated! ❤️
💎 Want us to help you become a better Forex trader ?
Now, It's your turn !
Be sure to leave a comment let us know how you see this opportunity and forecast.
Trade well, ❤️
ForecastCity English Support Team ❤️

#SILVER #XAGUSD moving up within corrective channelSilver (INR) completed its wave X at the INR 58450 low and seems to be making its way up within the corrective channel to complete Wave Y. It is most likely headed to INR 66000 area ($26 XAGUSD).
A subsequent correction to new lows is due before a long term upmove.
Risk level for stops also mentioned on the chart

#Silver #XAGUSD Rally reached target rangeSilver has hit the indicated target range rather soon. There should be some cooloff and reversal to the midpoint of the channel now

Silver "Breakout"Buy Silver at cmp 64080 Strict sl - 63199 Target - 66000/67000
Its a high risky trade, please consult your financial advisor before entering any trade.


#SILVER #XAGUSD break of corrective channelThe downside break in prices is a possible opening for the re-entry on the downside. Watch for the risk level to hold. If prices do not re-enter back into the channel in the coming few hours, the downmove should sustain

SILVER (XAGUSD) - Weekly Technical Analysis UpdateMidterm forecast:
While the price is below the resistance 26.20, beginning of downtrend is expected.
We make sure when the support at 19.65 breaks.
If the resistance at 26.20 is broken, the short-term forecast -beginning of downtrend- will be invalid.
Technical analysis:
The RSI downtrend #1 is broken, so the probability of beginning of downtrend is decreased.
While the RSI resistance #2 at 56 is not broken, the probability of price increase would be too low.
A peak is formed in daily chart at 25.50 on 10/12/2020, so more losses to support(s) 23.05, 22.15, 21.00 and minimum to Major Support (19.65) is expected.
Price is above WEMA21, if price drops more, this line can act as dynamic support against more losses.
Relative strength index (RSI) is 50.
❤️ If you find this helpful and want more FREE forecasts in TradingView
. . . . . Please show your support back,
. . . . . . . . Hit the 👍 LIKE button,
. . . . . . . . . . Drop some feedback below in the comment!
❤️ Your Support is very much 🙏 appreciated! ❤️
💎 Want us to help you become a better Forex trader ?
Now, It's your turn !
Be sure to leave a comment let us know how you see this opportunity and forecast.
Trade well, ❤️
ForecastCity English Support Team ❤️


#SILVER $XAGUSD positioned to tumble overSilver rallied up in three waves - and has now completed and a-b-c structure. The fall in the last 30 mins could accelerate and take the issue to new lows. Watch the indicated risk level for exits if caught on the wrong side.


MCX Silver's Next Target 65200 by the Elliott WaveHere, I have applied Elliott wave , moving average , volume , and MACD . Wave 4 can be steady or sideways for a while. Overall, silver is in an uptrend. Safe investors can buy silver at wave 4 for the following levels:
Intraday Targets: 62100 - 63300
Positional Targets: 64260 - 65200
At present, moving average and MACD throwing upward signal by crossover. Technically, multiple volume spikes are a great sign of a bullish trend.

BUY SILVER @ 61150 - 61250 TGT 61900 - 62300 SL -60600BUY SILVER @ 61150 - 61250 TGT 61900 - 62300 -62550
SL - 60600
INTRADAY & POSITIONAL.

Silver above support and about to break the downtrendCheck out the important support and resistance on the Day chart of Silver. One can go long tomorrow if it happens to break the trend line on closing basis.

#SILVER #XAGUSD - downtrend may have resumedThe first downmove that we see has clearly traced a 5 wave sequence and a 3 wave correction. this means we are headed down. Looks for new lows with 25.57 as the risk stop

#SILVER #XAGUSD bounced off sighted resistance Silver headed higher this morning into the indicated resistance at 25.57 and reversed right there , the down move has all the indications of a 5 wave structure and so may turnout to be a trend reversal. Updated charts will be posted soon.
Direction seems to be down to new lows if 25.57 remains intact

#SILVER #XAGUSD targeting 25.57 in Wave YSilver progressed very well as expected in Wave c of Wave Y. It should face resistance at around 25.57 where Wave Y = Wave W. This is also where the parallel trend channel tops.
We should watch price reaction at this area to understand if the trend will change downward ( most likely will, but lets listen to the price) . 25.57 is a good area for the W-X-Y corrective upward rally to terminate.

💡SILVER (XAGUSD) - Weekly Technical Analysis UpdateMidterm forecast:
While the price is above the support 19.65, resumption of uptrend is expected.
We make sure when the resistance at 26.20 breaks.
If the support at 19.65 is broken, the short-term forecast -resumption of uptrend- will be invalid.
Technical analysis:
The RSI downtrend #1 is broken, so the probability of resumption of uptrend is increased.
While the RSI resistance #2 at 64 is not broken, the probability of price increase would be too low.
A trough is formed in daily chart at 22.85 on 10/06/2020, so more gains to resistance(s) 25.65 and maximum to Major Resistance (26.20) is expected.
Price is above WEMA21, if price drops more, this line can act as dynamic support against more losses.
Relative strength index (RSI) is 53.
❤️ If you find this helpful and want more FREE forecasts in TradingView
. . . . . Please show your support back,
. . . . . . . . Hit the 👍 LIKE button,
. . . . . . . . . . . Drop some feedback below in the comment!
❤️ Your Support is very much 🙏 appreciated! ❤️
💎 Want us to help you become a better Forex trader ?
Now, It's your turn !
Be sure to leave a comment let us know how do you see this opportunity and forecast.
Trade well, ❤️
ForecastCity English Support Team ❤️
