Silver’s Breakdown Points to Much Lower LevelsSilver’s recent price action is not showing signs of strength or accumulation.
Instead, it reflects a clean structural breakdown followed by weak, corrective consolidation — the kind of behavior that usually precedes another leg lower.
After losing the key $84 level, silver didn’t stabilize or reclaim lost territory. It simply drifted into a lower range, suggesting that the move down was not just a temporary flush, but the start of a broader repricing phase.
What the market is doing now looks less like accumulation and more like post-breakdown exhaustion.
The $84 zone: where structure changed
The $84 area was a major structural level.
It acted as a balance zone where price previously found support and built value.
Once that level broke:
Buyers lost control of the structure
The market shifted from balance to imbalance
Liquidity started moving downward
Strong markets defend key levels.
Weak markets lose them and never look back.
So far, silver is behaving like the latter.
The inability to reclaim $84 suggests that the market is now operating in a lower value regime, where rallies are likely to be sold into, not chased higher.
Current price action: drift, not recovery
After the sharp drop, price entered a sideways range. But this range lacks the characteristics of real accumulation.
There is:
No strong impulsive buying
No reclaim of broken structure
No sustained upward expansion
Instead, the market is:
Printing lower highs
Moving sideways to slightly down
Showing reactive buying, not aggressive accumulation
This type of behavior is typical in markets that are pausing before the next leg lower.
The downside path: where liquidity sits
Below the current price, multiple untested liquidity zones remain.
These areas represent prior consolidation, psychological levels, and structural supports.
First major target: $56.52
This is the nearest meaningful support zone.
It represents:
A prior demand area
A structural pause in the previous trend
A natural magnet after the $84 breakdown
A move to this level would be a logical continuation, not a panic move.
Secondary target: $49.78
If $56 fails to hold, the next liquidity pocket sits near $49.78.
This level aligns with:
Deeper structural support
A prior consolidation region
A zone where longer-term buyers may begin to re-enter
This would represent a full structural correction from the $84 breakdown.
Deeper flush zones: $44.13 → $37.48 → $34.82
If the market enters a true risk-off phase or broad commodity weakness:
$44 becomes the next major structural test
$37 acts as a deeper psychological and technical level
$34 represents a full-cycle liquidity reset zone
These levels are where:
Long-term positioning resets
Weak hands are fully cleared out
Real accumulation could begin
Why the bearish scenario makes structural sense
Several factors support the downside path:
1) Clean structural breakdown
The loss of $84 shifted the entire market regime.
2) Lack of impulsive recovery
Strong markets bounce fast. Weak markets drift.
3) Overhead supply above current price
Every rally now runs into trapped longs from higher levels.
4) Untested liquidity below
Multiple clean targets sit beneath the current range.
Markets naturally move toward unfilled liquidity zones.
The likely sequence from here
The higher-probability path:
Continued sideways-to-lower drift below $84
Gradual breakdown of the current range
First major test around $56.52
If that fails, extension toward $49.78
Deeper flush possible toward $44 → $37 → $34 zones
Real accumulation is more likely after these levels are tested, not at current prices.
Bottom line
Silver is not showing signs of a bottom.
It’s showing signs of a market adjusting to a lower price regime.
The $84 breakdown changed the structure.
Since then, price has only drifted — not recovered.
That usually means the move isn’t over.
The structure currently favors:
First major downside target: $56.52
Secondary level: $49.78
Deeper reset zones: $44 → $37 → $34
This isn’t a base in silver.
It’s a pause before the next move.
Silveranalysis

Silver future heading towards 100 MA Silver future is heading towards it's 100 mA of 2,15,000 almost. But one can consider 199,282 as the pivot level and 1,71508 as the major support, because that was the last major leg of this rally.

Buy above 85 with stop below 78Buy above 85 with stop below 78 TARGET 100+
After a pull back this zone seems to be a good entry

How ₹2 Lakh Can Be Invested in Gold & Silver Using SIP + GTTLet’s take a simple example of an investor who wants to invest ₹2,00,000 in Gold and Silver, but does not want to invest everything at one price.
Instead of predicting the bottom, the investor follows a rule-based SIP + GTT (dip buying) strategy.
📉 Market Context (At the Time of Planning)
Gold has already corrected ~22% from its all-time high
Silver has already corrected ~40% from its all-time high
Prices have cooled down, but further correction is still possible.
So the strategy is designed to work even if prices fall further.
📊 Current ETF Prices (Reference)
Gold ETF (GoldBeES): ₹115
Silver ETF (SilverBeES): ₹206
(Exact prices are not important — the strategy is percentage-based.)
💰 Total Capital in This Example
Total Investment Amount: ₹2,00,000
Investment Mode: ETFs (low cost, high liquidity)
Allocation
Gold ETF: ₹1,20,000
Silver ETF: ₹80,000
🪜 GTT “Dip Buying” Plan (Price-Based Buying)
In this example, the investor decides:
“I will invest more only when price falls, not based on news or emotions.”
So, GTT (Good Till Triggered) orders are placed at every 5% price fall.
🪙 Gold ETF – GTT Ladder (Example)
Current price: ₹115
Further possible correction assumed: 20%
Level Price (₹) Amount Invested
Current level 115 ₹30,000
5% fall 109 ₹25,000
10% fall 103 ₹25,000
15% fall 98 ₹20,000
20% fall 92 ₹20,000
Total Gold Investment — ₹1,20,000
👉 Result: Average price improves automatically if the market falls.
🥈 Silver ETF – GTT Ladder (Example)
Current price: ₹206
Further possible correction assumed: 30%
Level Price (₹) Amount Invested
Current level 206 ₹15,000
5% fall 196 ₹15,000
10% fall 185 ₹15,000
15% fall 175 ₹12,000
20% fall 165 ₹12,000
25% fall 155 ₹6,000
30% fall 144 ₹5,000
Total Silver Investment — ₹80,000
👉 Silver is more volatile, so the investment is spread across more levels.
📅 SIP + GTT Hybrid Plan (Example)
Along with dip buying, the investor also uses monthly SIPs for discipline.
🔁 Monthly SIP Setup
ETF Monthly SIP
Gold ETF ₹4,000
Silver ETF ₹2,000
👉 Total monthly SIP = ₹6,000
SIP runs every month (market up or down)
GTT orders activate only when price falls
This creates a balance of consistency + opportunity.
📈 Expected Outcome (Realistic Range)
Based on historical behaviour:
After 2 years: ~₹2.4 – ₹2.5 lakh
After 3 years: ~₹2.8 – ₹3.0 lakh
(Actual returns depend on global cycles and market conditions.)
🔄 Profit Booking Rules Used in This Example
Gold ETF:
At ~25–30% profit → sell 20–30% of units
Silver ETF:
At ~40–50% profit → sell 40–50% of units
Partial profit booking helps lock gains and reduce volatility risk.
🧾 Tax Treatment (India)
Holding less than 3 years:
Profit taxed as per income slab
Holding 3 years or more:
20% tax with indexation
Long-term holding improves tax efficiency.
🧠 Key Takeaway from This Example
This ₹2 lakh example shows that:
You don’t need to predict the bottom
Discipline matters more than timing
SIP builds consistency
GTT removes emotion
Averaging happens automatically
Plan the investment.
Let the market do the rest.
⚠️ Disclaimer
This content is shared strictly for educational and informational purposes only.
It is not investment advice or a recommendation to buy or sell any security.
Markets involve risk, and returns are not guaranteed.
Investors should do their own research or consult a qualified financial advisor before making any investment decisions.

$SILVER Long ideaTVC:SILVER can be longed with the RRR of almost 7!! There is a good support at ~252000 to ~235000. I think there can be a good reversal from this point. This is only an educational idea. Not a Fianancial Advice. Have a good trading day.

Silver Weekly Outlook: Post-Exhaustion PhaseSilver has entered a high-volatility post-exhaustion phase after a sharp parabolic rise followed by an equally aggressive correction. The weekly chart clearly shows that price moved too far, too fast, and the recent sell-off is a classic example of mean reversion after euphoric buying. Such phases rarely resolve in a straight line and typically evolve into consolidation, base-building, or deeper corrective structures.
At current levels, Silver is hovering near an immediate demand zone around the 80–85 region, which now acts as a crucial decision area. This zone represents the first major area where buyers are expected to defend aggressively. The way price behaves here will define the next medium-term trend.
Scenario A – Range / Base Formation (High Probability):
The most probable outcome at this stage is sideways consolidation. After a vertical fall, markets often need time to absorb supply and rebuild demand. If Silver manages to hold above the immediate demand zone and starts forming higher lows on lower timeframes, it would indicate base formation rather than trend failure. This scenario favors range traders and patient positional participants, as price may oscillate between support and overhead resistance for several weeks or months.
Scenario B – Breakdown Continuation (Moderate Probability):
If the current support zone fails decisively with strong weekly closes below it, Silver could enter a deeper corrective phase. In such a case, price may gravitate toward the next major demand zone near 73–75, which aligns with prior consolidation and breakout structure. This move would likely be driven by broader risk-off sentiment or macro pressure rather than technical weakness alone. Traders should avoid aggressive longs if this breakdown structure develops.
Scenario C – Bullish Reclaim and Bounce (Low Probability, Needs Confirmation):
A less likely but still possible outcome is a bullish reclaim, where Silver holds current levels, absorbs selling pressure, and reclaims the 90+ zone with strong weekly confirmation. For this scenario to gain credibility, price must show acceptance above resistance with volume and structure. Until then, any bounce should be treated as reactive and corrective, not a confirmed trend reversal.
From a structural perspective, the major resistance remains far above near the 115–120 zone, which was the distribution area before the sharp reversal. This level will act as a long-term supply cap unless Silver builds a strong base over time.
In summary, Silver is no longer in a trending phase but in a transition zone. Patience is critical here. Traders should focus less on prediction and more on reaction to price behavior at key demand levels. Let structure, confirmation, and risk management guide decisions, as this phase can easily trap both early bulls and aggressive bears if approached without discipline.

Gold & Silver as Safe Haven AssetsFactors Driving Gold & Silver Safe Haven Demand
Several macroeconomic and geopolitical factors dictate the demand for gold and silver as safe havens:
Inflation and Currency Depreciation
When inflation accelerates, the purchasing power of fiat currency declines. Investors often turn to gold and silver to preserve wealth. Historically, gold has outperformed during high inflation periods due to its finite supply. Silver, while also a hedge, can experience higher volatility due to its industrial applications.
Geopolitical Tensions
Wars, political instability, and global conflicts tend to increase demand for safe havens. Gold, being globally recognized, often rallies during crises. For example, gold prices surged during the 2008 financial crisis and geopolitical conflicts in the Middle East.
Financial Market Volatility
Equity and bond market instability drives investors to allocate funds into gold and silver. These metals often have a low or negative correlation with traditional assets like stocks, making them effective portfolio diversifiers.
Central Bank Policies
Expansionary monetary policies, low interest rates, and quantitative easing can weaken currencies, prompting investors to shift to gold. Central banks themselves hold gold reserves, and their buying or selling activity can significantly impact prices.
Currency Fluctuations
Gold is typically priced in US dollars. A weakening dollar often boosts gold demand globally, whereas a stronger dollar can depress gold prices. Investors may use gold as a hedge against currency depreciation in local currencies.
Safe Haven Strategies for Gold & Silver
Investors employ various strategies to utilize gold and silver for capital preservation and risk management. These strategies vary depending on risk tolerance, investment horizon, and market conditions.
1. Physical Ownership
Physical ownership remains the most direct method. This includes coins, bars, and bullion. The advantages are tangible asset holding, no counterparty risk, and universal acceptance. Key considerations include storage, security, and liquidity. Investors often maintain 5-15% of their portfolio in physical metals as a hedge.
2. Exchange-Traded Funds (ETFs)
Gold and silver ETFs provide exposure without the need to physically store metals. ETFs like SPDR Gold Shares (GLD) or iShares Silver Trust (SLV) track the price of the underlying metal. ETFs offer high liquidity, ease of trading, and lower transaction costs, making them suitable for both short-term hedging and long-term protection.
3. Futures and Options
Derivative contracts allow strategic exposure to gold and silver price movements. Futures contracts can hedge against currency devaluation or portfolio risk. Options, including calls and puts, provide leverage and flexibility to profit from price swings or hedge against downside risks. However, derivatives involve higher complexity and risk, and they are suitable primarily for sophisticated investors.
4. Mining Stocks and ETFs
Investing in gold and silver mining companies provides indirect exposure to metal prices. Mining stocks often outperform physical metals during strong rallies due to operational leverage. Mining ETFs, such as the VanEck Vectors Gold Miners ETF (GDX), offer diversified exposure across the sector. Risks include operational and geopolitical factors affecting mining operations.
5. Portfolio Diversification
Incorporating gold and silver into a diversified portfolio can reduce overall volatility. Traditional safe haven allocation ranges from 5% to 20%, depending on risk appetite and market conditions. During crises, these allocations may increase to protect wealth and maintain liquidity.
6. Currency Hedge Strategy
Gold and silver serve as effective hedges against local currency depreciation. Investors in emerging markets, for example, often shift part of their portfolio into USD-denominated gold to preserve value against domestic currency weakness.
7. Systematic Investment
Dollar-cost averaging (DCA) into gold and silver mitigates timing risk. By investing fixed amounts at regular intervals, investors accumulate metals at varying price points, reducing the impact of short-term volatility. This is particularly effective in long-term wealth preservation strategies.
8. Crisis-Triggered Allocation
Some investors follow a reactive strategy, allocating funds to gold and silver only during market stress or geopolitical uncertainty. While this approach can maximize returns during crises, it requires precise timing and continuous monitoring of global events.
Risk Management and Considerations
Even as safe havens, gold and silver are not risk-free. Investors must account for price volatility, storage costs, and liquidity risks. Key considerations include:
Price Volatility: While gold is relatively stable, silver can experience sharp swings due to industrial demand and speculative trading.
Opportunity Cost: Holding metals in lieu of higher-yielding assets may reduce returns in bull equity markets.
Liquidity Needs: Physical metals may be less liquid than ETFs or stocks.
Market Timing: Buying during price spikes can reduce long-term returns.
Balancing safe haven strategies with other portfolio components ensures optimal protection without sacrificing growth potential. A combination of physical metals, ETFs, and mining stocks can provide diversification across risk levels and investment horizons.
Behavioral Aspects and Investor Psychology
Safe haven strategies are also driven by behavioral factors. Fear, uncertainty, and panic often amplify demand for gold and silver. Historically, during crises, investors flock to these metals even if underlying fundamentals remain stable. Understanding these psychological drivers can help investors time entries and exits more effectively. Long-term investors may avoid panic-driven purchases and maintain consistent allocations to metals as part of a disciplined risk management plan.
Case Studies of Safe Haven Performance
2008 Financial Crisis: Gold surged from around $800 to over $1,000 per ounce as equity markets collapsed, demonstrating its crisis resilience.
COVID-19 Pandemic (2020): Both gold and silver rallied sharply amid unprecedented fiscal and monetary stimulus. Gold reached all-time highs, while silver doubled in value, highlighting its dual safe haven and industrial appeal.
Geopolitical Conflicts: In periods like the Russia-Ukraine conflict, gold demand spiked globally, emphasizing its role as a geopolitical hedge.
These examples underscore that gold and silver provide a reliable buffer against systemic risk, preserving wealth and reducing portfolio drawdowns.
Conclusion
Gold and silver remain cornerstone assets in safe haven strategies, offering protection against inflation, currency depreciation, financial market volatility, and geopolitical risks. Strategies range from physical ownership and ETFs to derivatives, mining stocks, and systematic investment plans. While gold is historically more stable, silver provides higher upside potential but with greater volatility.
Effective safe haven strategies integrate these metals into a diversified portfolio, balancing risk and liquidity needs while considering market conditions and behavioral factors. By maintaining a disciplined approach and aligning allocations with risk tolerance, investors can harness the wealth-preserving power of gold and silver, ensuring resilience in uncertain economic environments.

Highlight of the day: Silver again up by 6%Silver rose to a new high by 6% heading towards ₹ 4 lac / kg apparently.

It seems silver is going to loose its shine soonSilver (XAGUSD) prices are near all time high, hovering near the VAH logarithmically on monthly chart. Highly cautious period next one or two months. Keep watching !!

SILVER - HEALTHY CONSOLIDATION LONGSSilver doing a healthy consolidation - momentum intact.
very strong support for momentum to continue is $90, belov that momentum vill be lost.
small resistance at $93.50
major resistance at $95.50 - $96
above $96 v should likely test 3digits - $100.
above that vill be a price discovery one can trail at ST 1.5 on 75m chart.

Xau USD Bullish Xau USD buying come at 4671 and then boom to 4852 . It's good bet as Usa is Asking for greenland and Max EU countries are selling USA bonds. Then Buying will come more in Safe haven assest like Gold & Silver . Xau USD may touch 5000 in coming week . Keep SL . Trial SL.
Tgt 5000+

MCX Silver: Healthy Dip Before Next RallyMCX Silver is in a strong long-term uptrend on the daily chart. The market has already completed wave 1, 2, and a strong wave 3 upward. After this big rise, price is now expected to make a normal correction (wave 4). This pullback can come toward the 236,000 area, which is an important support zone. As long as price stays above this support, the overall trend remains bullish. After wave 4 is completed, Silver is expected to start wave 5, which can push prices to new highs. In short, the trend is up, and any dip is a healthy correction, not weakness.
Stay Tuned :)
@Money_Dictators

Silver bull case above 94 and bear case below 86 Looks like silver has taken a halt now and in accumulation phase. Looks breakout can come above 93 and breakdown below 86.
Either side rally of 8-10% is anticipated.

SILVER Triangle BreakoutSilver has given a breakout after forming a triangle pattern on 1h & 4h timeframe. Silver is also trading above 200 EMA on both the timeframes.

SILVER LONGSSMarket broke $79 yesterday on closing and spiked up till $82.50.
Now market is just testing $79 yesterday breakout zone for buyer dominance - if we hold the $79 on closing we can again spike up to highs and more.
Support - $78.50 - $79
Small Resistance - $82.50
Next - Vallhalla

SILVER | XAGUSD 1H Chart - Make or Break LevelsFX:XAGUSD MCX:SILVER1!
Silver is trading at a make-or-break support zone — this level will decide whether the broader uptrend survives or cracks.
🔹 Price is sitting near the 200 EMA, a level that historically acted as a launchpad
🔹 Last time Silver tested the 200 EMA (around $50), it marked the base before a multi-year breakout
🔹 Now, price has again pulled back to the same EMA near $70
📌 Key Observation:
As long as Silver holds above the 200 EMA, this move looks like a healthy retracement, not trend failure.
To Reduce the Noise switch to 4h Chart and see its forming 2 range candle just above 50EMA a break ot that will trigger the trade.
Need Confirmation from 4h chart then only go long
Keep Learning, Happy Trading.

Silver Analysis $Silver Price Prediction For Long-Term
Cup & Handel Pattern
BUYING ZONE- 25% - 32% Down from current price

Silver Forecast - Elliott Wave AnalysisThis Rally continue possible up to Around $80 without break trendline support or Invalidation level so go long ...

Breakout in Silver (Ag)...Chart is self explanatory. Levels of breakout, possible up-moves (where silver may find resistances) and support (close below which, setup will be invalidated) are clearly defined.
Disclaimer: This is for demonstration and educational purpose only. This is not buying or selling recommendations. I am not SEBI registered. Please consult your financial advisor before taking any trade.

Silver at a Critical Inflection Point [25% DOWNSIDE EXPECTED]Silver has delivered a powerful rally this year , but key Technical Milestones will now complete. in the 72-75 zone
🔹 Multiple Cup & Handle targets achieved on the log chart
🔹 ~300% Fibonacci extension of the post-COVID move reached
🔹 Decades-long $50 resistance broken — a major structural event
🔹 Using price symmetry, $75 now stands out as a heavy resistance zone
🔹Possible Retracement zone: 46 to 54
📉 With pattern completion and long-term resistance converging, risk-reward strongly favors caution at current levels.
Markets move in cycles — and Silver may be entering the next phase.
NOT SEBI REGISTERED. ⏐ ALL VIEWS ARE PERSONAL⏐ NOT AN INVESTMENT ADVICE

silver intraday trade ideasilver can be bought near pink marked zone with sl slightly below that zone for quick intraday scalp or trade rest all are mentioned in chart

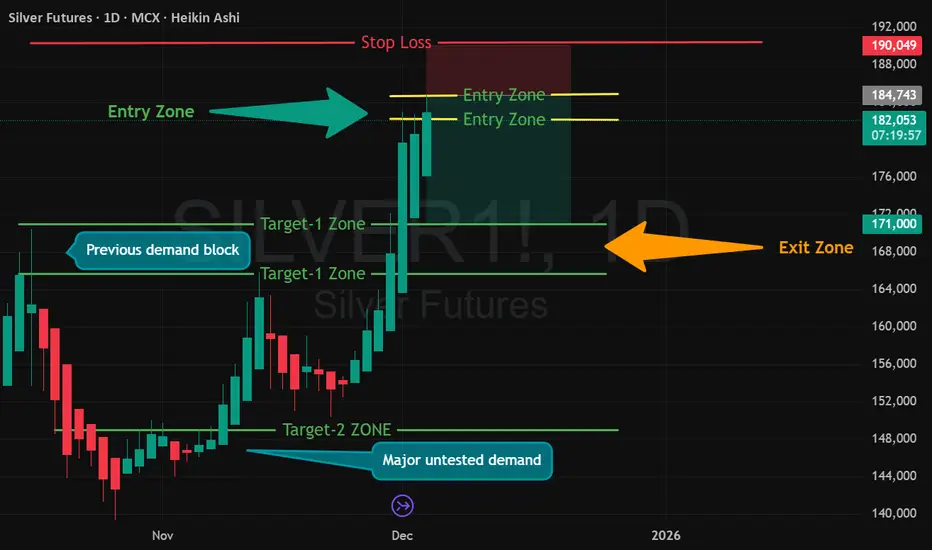
MCX Silver Mar-26 — Short Setup IdentifiedMCX:SILVER1!
Silver Futures (MCX Mar-26) has formed 3 strong bullish candles with equal body size, which often signals momentum exhaustion. Price is now consolidating near resistance, creating a short-biased educational setup as per my analysis.
🔽 Short Setup (Educational Technical Analysis)
📌 Short Entry Zone:
₹185000 – ₹182000
🔴 Stop Loss:
₹190000
🎯 Target Zones (As per my analysis)
Target 1: ₹171000 – ₹165000
Target 2: ₹149000
Target-1 aligns with the current Exit Zone shown in chart.
Target-2 is for advanced traders with trailing SL to Cost-to-Cost.
📊 Why This Setup?
3 equal-sized bullish candles = possible buyer exhaustion
Price hitting resistance zone
Fresh consolidation indicating distribution
Strong mean-reversion probability
⚠️ SEBI Advisory Note
I am not a SEBI-registered investment advisor.
This analysis is only for educational learning, not buy/sell signals.
#Silver #MCXSilver #SilverFutures #MCX #CommodityTrading
#ShortSetup #PriceActionTrading #TechnicalAnalysis
#HeikinAshi #SupplyDemand #TrendReversal #BearishSetup
#TradingEducation #ChartAnalysis #MarketPsychology
#RiskManagement #AdijhonAnalysis
SILVERHello & welcome to this analysis
Silver had a dream run from August to October before going into a sideways correction.
Just like Gold, it too is forming a triangle, now likely into its last leg.
Comex Silver an ascending triangle as long as it does not trade above $54.40 could dip down to $51.50 - 50.75 to complete the formation of the triangle provided the expected last leg down does not go below 48.63.
MCX Silver is a contracting triangle (due to $:INR) as long as it does not trade above 165818 could dip down to 157000 - 155000 to complete the formation of the triangle provided the expected last leg down does not go below 150350.
Upon completion of the triangles the upside target on resumption of uptrend are $59 / INR 186000
All the best
