Silver’s Breakdown Points to Much Lower LevelsSilver’s recent price action is not showing signs of strength or accumulation.
Instead, it reflects a clean structural breakdown followed by weak, corrective consolidation — the kind of behavior that usually precedes another leg lower.
After losing the key $84 level, silver didn’t stabilize or reclaim lost territory. It simply drifted into a lower range, suggesting that the move down was not just a temporary flush, but the start of a broader repricing phase.
What the market is doing now looks less like accumulation and more like post-breakdown exhaustion.
The $84 zone: where structure changed
The $84 area was a major structural level.
It acted as a balance zone where price previously found support and built value.
Once that level broke:
Buyers lost control of the structure
The market shifted from balance to imbalance
Liquidity started moving downward
Strong markets defend key levels.
Weak markets lose them and never look back.
So far, silver is behaving like the latter.
The inability to reclaim $84 suggests that the market is now operating in a lower value regime, where rallies are likely to be sold into, not chased higher.
Current price action: drift, not recovery
After the sharp drop, price entered a sideways range. But this range lacks the characteristics of real accumulation.
There is:
No strong impulsive buying
No reclaim of broken structure
No sustained upward expansion
Instead, the market is:
Printing lower highs
Moving sideways to slightly down
Showing reactive buying, not aggressive accumulation
This type of behavior is typical in markets that are pausing before the next leg lower.
The downside path: where liquidity sits
Below the current price, multiple untested liquidity zones remain.
These areas represent prior consolidation, psychological levels, and structural supports.
First major target: $56.52
This is the nearest meaningful support zone.
It represents:
A prior demand area
A structural pause in the previous trend
A natural magnet after the $84 breakdown
A move to this level would be a logical continuation, not a panic move.
Secondary target: $49.78
If $56 fails to hold, the next liquidity pocket sits near $49.78.
This level aligns with:
Deeper structural support
A prior consolidation region
A zone where longer-term buyers may begin to re-enter
This would represent a full structural correction from the $84 breakdown.
Deeper flush zones: $44.13 → $37.48 → $34.82
If the market enters a true risk-off phase or broad commodity weakness:
$44 becomes the next major structural test
$37 acts as a deeper psychological and technical level
$34 represents a full-cycle liquidity reset zone
These levels are where:
Long-term positioning resets
Weak hands are fully cleared out
Real accumulation could begin
Why the bearish scenario makes structural sense
Several factors support the downside path:
1) Clean structural breakdown
The loss of $84 shifted the entire market regime.
2) Lack of impulsive recovery
Strong markets bounce fast. Weak markets drift.
3) Overhead supply above current price
Every rally now runs into trapped longs from higher levels.
4) Untested liquidity below
Multiple clean targets sit beneath the current range.
Markets naturally move toward unfilled liquidity zones.
The likely sequence from here
The higher-probability path:
Continued sideways-to-lower drift below $84
Gradual breakdown of the current range
First major test around $56.52
If that fails, extension toward $49.78
Deeper flush possible toward $44 → $37 → $34 zones
Real accumulation is more likely after these levels are tested, not at current prices.
Bottom line
Silver is not showing signs of a bottom.
It’s showing signs of a market adjusting to a lower price regime.
The $84 breakdown changed the structure.
Since then, price has only drifted — not recovered.
That usually means the move isn’t over.
The structure currently favors:
First major downside target: $56.52
Secondary level: $49.78
Deeper reset zones: $44 → $37 → $34
This isn’t a base in silver.
It’s a pause before the next move.
Silvershort


SELL SILVER - everyone says this, but i say only when i'm sureMarkets that run too far from their statistical/structural mean tend to revert back — especially after parabolic rallies. Classic studies show prices can overshoot by large factors before pulling back toward long-term averages.
arXiv
Silver in 2025 experienced extraordinary gains (~150–170%+), which is well beyond typical historical norms relative to commodities or industrial metals.
Trading Economics
When a rally of that magnitude climaxes, mean-reversion theory suggests:
Prices overshoot the “fair value band”
Sellers (especially momentum traders) begin taking profits
Volatility spikes increase backwardation/short squeezes
This is exactly what has been happening recently — sharp pullbacks, volatility, and aggressive liquidation.

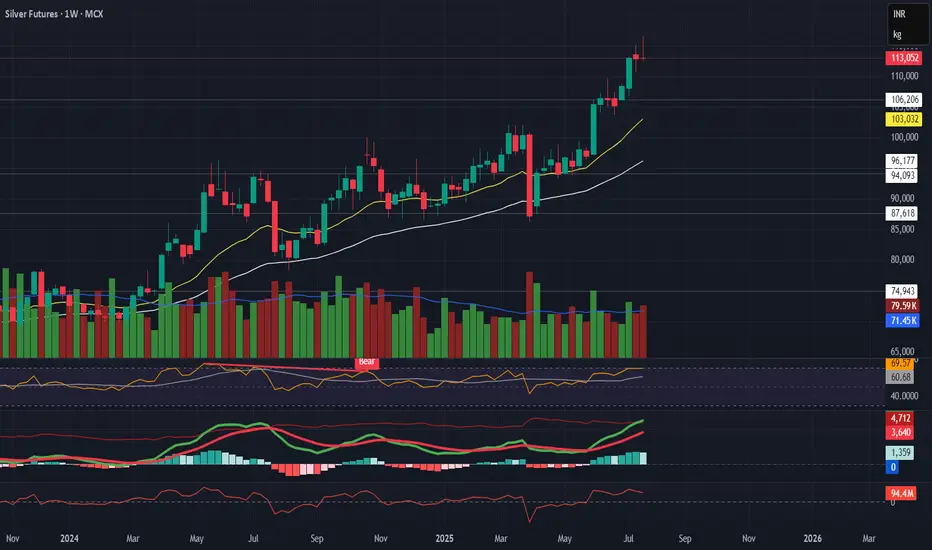
Silver at a Critical Inflection Point [25% DOWNSIDE EXPECTED]Silver has delivered a powerful rally this year , but key Technical Milestones will now complete. in the 72-75 zone
🔹 Multiple Cup & Handle targets achieved on the log chart
🔹 ~300% Fibonacci extension of the post-COVID move reached
🔹 Decades-long $50 resistance broken — a major structural event
🔹 Using price symmetry, $75 now stands out as a heavy resistance zone
🔹Possible Retracement zone: 46 to 54
📉 With pattern completion and long-term resistance converging, risk-reward strongly favors caution at current levels.
Markets move in cycles — and Silver may be entering the next phase.
NOT SEBI REGISTERED. ⏐ ALL VIEWS ARE PERSONAL⏐ NOT AN INVESTMENT ADVICE

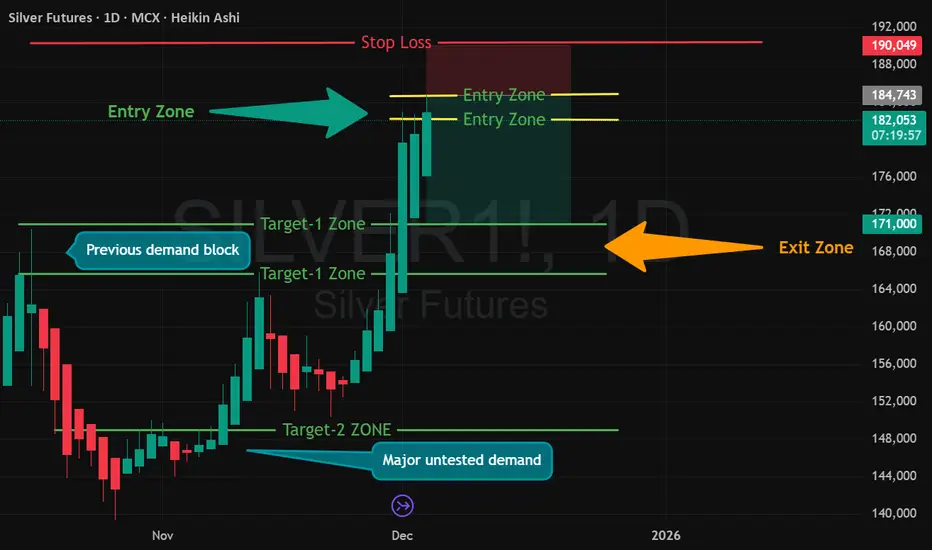
MCX Silver Mar-26 — Short Setup IdentifiedMCX:SILVER1!
Silver Futures (MCX Mar-26) has formed 3 strong bullish candles with equal body size, which often signals momentum exhaustion. Price is now consolidating near resistance, creating a short-biased educational setup as per my analysis.
🔽 Short Setup (Educational Technical Analysis)
📌 Short Entry Zone:
₹185000 – ₹182000
🔴 Stop Loss:
₹190000
🎯 Target Zones (As per my analysis)
Target 1: ₹171000 – ₹165000
Target 2: ₹149000
Target-1 aligns with the current Exit Zone shown in chart.
Target-2 is for advanced traders with trailing SL to Cost-to-Cost.
📊 Why This Setup?
3 equal-sized bullish candles = possible buyer exhaustion
Price hitting resistance zone
Fresh consolidation indicating distribution
Strong mean-reversion probability
⚠️ SEBI Advisory Note
I am not a SEBI-registered investment advisor.
This analysis is only for educational learning, not buy/sell signals.
#Silver #MCXSilver #SilverFutures #MCX #CommodityTrading
#ShortSetup #PriceActionTrading #TechnicalAnalysis
#HeikinAshi #SupplyDemand #TrendReversal #BearishSetup
#TradingEducation #ChartAnalysis #MarketPsychology
#RiskManagement #AdijhonAnalysis
Silver Up 4% | Less Volume Silver rose by 4% today but the volume didn't seem to participate. Till 3:30 PM, silver future volume quoted below it's average volume. If it doesn't open in gap-up tomorrow with volume support, then a reversal won't be that surprising.
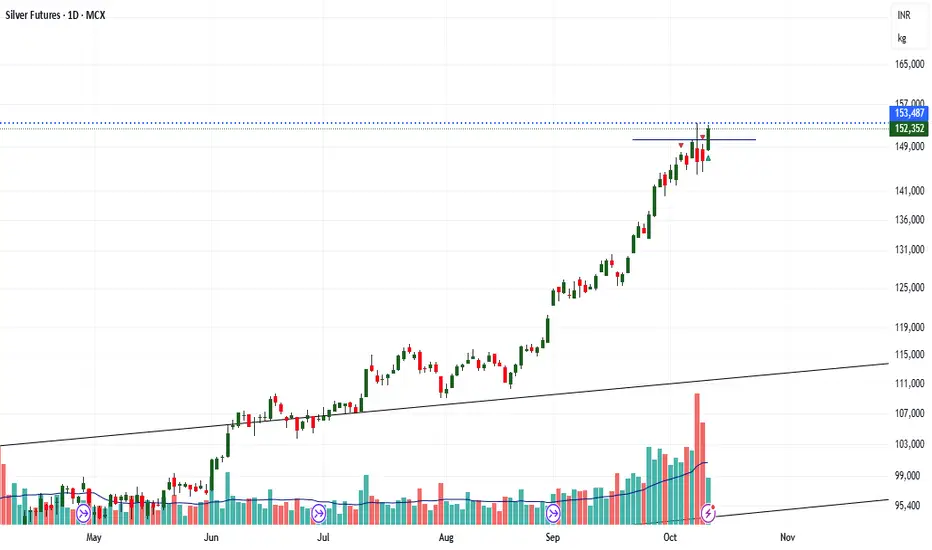
Silver Reversed from 1,50,000Silver reversed from the psychological hurdle of 1,50,000 level as expected and posted on 6th Oct,2025.

Demat Account Secrets in Trading —Every Traders Should KnowIntroduction
A Demat account is the digital locker for your shares and securities — the backbone of equity investing and trading in modern markets. But beyond opening an account and watching prices, there are plenty of practical, operational, and strategic “secrets” that experienced traders and long-term investors use to reduce costs, manage risks, and extract real value. This guide unpacks those lesser-known but high-impact insights: from choosing the right Depository Participant (DP) and optimizing charges, to advanced features like pledging, e-voting, corporate actions handling, fraud prevention, and tax implications. Whether you’re a frequent intraday trader, a swing trader, or a buy-and-hold investor, these tips will help you use your Demat account more intelligently.
1. Demat 101 — the fundamentals (so you can stop guessing)
A Demat (dematerialized) account holds securities in electronic format. In India, two depositories — NSDL and CDSL — maintain the records; brokers or banks act as Depository Participants (DPs) who provide the interface. When you buy shares, they land in your Demat account; when you sell, they are debited.
Key components:
DP (Depository Participant): Your broker/bank managing the Demat.
Client ID / Beneficiary Owner (BO) ID: Unique identifier for holdings.
ISIN: International Security Identification Number for each instrument.
Statement of Holdings (MSOH): Periodic summary of your holdings.
Understanding the basics helps avoid simple but costly mistakes, like missing corporate action deadlines or confusing a brokerage trading account fee with a DP demat charge.
2. Choosing the right DP — the biggest hidden lever for costs & convenience
Everyone talks about brokerage, but DP fees and service quality quietly shape net returns.
What to compare:
Account opening fees and annual maintenance charges (AMC) — DPs vary widely.
Transaction fees / custodian charges — per scrip or flat per transaction?
Pledge/unpledge fees — important if you use margin funding.
Speed & UI of the DP portal/app — corporate actions, e-voting, and statements are handled through the DP interface.
Customer service responsiveness — when issues arise (frozen shares, IPO refunds), fast support saves money.
Integration with your broker — some brokers offer bundled Demat+trading at lower cost.
Value-adds — auto-pay for corporate actions, consolidated statements, or tax reports.
A little fee shopping can save hundreds per year for active traders. If you trade frequently, prioritize low transaction/DVP (delivery versus payment) costs. If you hold long-term, low AMC and reliable corporate action handling matter more.
3. Know every charge — the micro-fees that add up
Demat-related costs are often small, but they compound.
Common fees:
Account opening fee
Annual maintenance charge (AMC)
Transaction charges (debited shares, off-market transfer)
Rematerialization fee (if you want physical certificates)
Pledge/unpledge fee
Dematerialization fee (converting physical to electronic)
Re-registration fee (if transferring DP)
Pro tip: Ask for a clear fee schedule before opening. Some DPs waive AMC for the first year or if you maintain a minimum balance.
4. Pledging shares — a secret weapon (and its pitfalls)
Pledging lets you use your Demat holdings as collateral for loans or margin from your broker or financial institution without selling them. This is a powerful tool but needs careful handling.
When to pledge:
To avoid selling for short-term margin calls.
To take loans against shares for diversification, emergency liquidity, or tax planning.
Risks & secrets:
Margin haircut: Lenders apply haircuts; volatile scrips get lower borrowing value.
Forced unpledge/sell: If the borrower (you or broker) defaults, the lender can liquidate.
Pledge charges & delays: Unpledging can take time; if markets move quickly you might not recover positions in time.
Keep pledged shares low proportion of total holdings to preserve flexibility.
Best practice: Use pledging conservatively and document the exact terms — interest, margin maintenance, and liquidation triggers.
5. Corporate actions — don’t let freebies slip away
Corporate actions include dividends, bonus shares, rights issues, stock splits, and buybacks. These affect your holdings and tax position.
Secrets:
Auto-execution settings: Some DPs auto-apply rights/renunciation choices; others require manual action. Know your DP’s default.
Track ex-dates and record dates: Missing a record date can mean missing a dividend or allocation.
Tax implications: Dividends and buybacks have different taxation; plan around holding periods to optimize capital gains tax.
Fractional shares from corporate actions may be paid out in cash — watch your account for small value credits.
Tip: Set calendar reminders for big corporate events for your core holdings.
6. Intraday trading & Demat — what traders often misunderstand
Many intraday traders think Demat doesn’t matter because intraday uses the trading account. But Demat still influences some things:
Delivery cycles: If you convert an intraday position to delivery, shares will land in your Demat only after settlement — check T+1/T+2 rules for the exchange.
Transaction vs delivery charges: No Demat debit for intraday (since shares aren’t delivered), but frequent delivery trades create more DP debits and costs.
Avoid unnecessary delivery: If you don’t intend to hold beyond the day, use intraday product to avoid DP transaction costs.
Secret: Using product/overnight margin vs MIS/Intraday modes changes margin requirements and whether shares actually hit your Demat account.
7. Security & fraud prevention — protect the locker
Scams target accounts everywhere. Protecting your Demat is non-negotiable.
Practical measures:
No POA unless necessary: Power of Attorney allows brokers to debit shares; while convenient, it’s a risk if given indiscriminately.
Two-factor authentication for broker/DPS portals.
Regularly reconcile your MSOH with transactions — report discrepancies immediately.
Keep KYC up to date — mismatches slow down corporate actions and transfers.
Beware phishing & SMS frauds: Never share OTPs, passwords, or UCCs.
Freeze facility: Many DPs offer "freeze" on holdings to prevent off-market transfer — useful if you detect suspicious activity.
Secret: If you must grant POA for ease of trading, limit it and use a reputable broker with transparent audit logs and insurance cover.
8. Reconciliation and statements — the daily routine of pros
Make it a habit:
Check daily trade reports and weekly Demat statements.
Match buy/sell confirmations with Demat credits/debits.
Track corporate action updates and small credits (fractional payouts, interest).
Why this matters: Small reconciliation catches — like a miscredited dividend or a failed transfer — can save disputes and losses later.
9. Off-market transfers & gifts — tax and legal subtleties
Off-market transfer (transfer of shares between Demat accounts without exchange) is common for gifts, family transfers, or private transactions.
Secrets:
Stamp duty & documentation: Gifts may require stamped transfer forms and declarations.
Gift taxation: In many jurisdictions, gifts from non-relatives have tax consequences. Document relationship and value.
Lock-in periods for ESOPs: Employee stock plans often have restrictions — off-market transfers may be blocked until vesting or expiry.
Always get the paperwork right to avoid future audits or blocked transfers.
10. IPO allotment & ASBA — how Demat helps get allocations
When you apply for IPOs, you must provide your Demat beneficiary ID. ASBA (Application Supported by Blocked Amount) ties refunds to the bank account, but Demat ensures shares — if allotted — are credited cleanly. Tip: Keep your Demat details updated and ensure PAN/DP mapping is correct to avoid allotment or transfer failures.
11. Taxation & reporting — your Demat is a tax record
Demat statements are primary source documents for capital gains calculations. Hidden advantages:
Broker consolidated statements often include trade-wise P&L and tax reports — use them for accurate filings.
Record holding periods precisely to differentiate between short-term and long-term rates.
Track cost basis across corporate actions — splits, bonus shares, and mergers alter cost per share; your DP statement and ISIN mapping help reconstruct basis.
Secret: Use consolidated transaction history from DP + broker to build an auditable trail for taxes.
12. Advanced tricks traders use (legitimately)
Scrip selection for pledge-margins: Keep a small basket of high-liquidity, low-volatility blue-chips for emergency pledges — they attract better haircuts.
Arbitrage of corporate actions: Professional traders sometimes buy before bonus/record dates to capture specific corporate actions, but account for ex-dates and tax impacts.
Fractional sell tactic: For small fractional leftover holdings after corporate actions, monitor for cash credits or plan an off-market consolidation to reduce micro-lots.
Caveat: All strategies must respect exchange rules and insider trading laws.
13. Common mistakes & how to avoid them
Giving POA to unknown brokers. Fix: Use limited POA or avoid if not necessary.
Ignoring AMC & small fees. Fix: Annual review of DP and renegotiate or switch.
Not tracking corporate action timelines. Fix: Subscribe to alerts and maintain a calendar.
Assuming all charges are the broker’s responsibility. Fix: Read fee schedule and keep records.
Failure to reconcile statements. Fix: Weekly reconciliation habit.
14. Switching DPs — the painless way
If you’re unhappy, transfer holdings using the Off-Market Transfer or Consolidation process. You’ll submit a DIS (Delivery Instruction Slip) at your current DP or use electronic transfer forms. Watch for transfer fees and timing — sometimes it’s cheaper to transfer slowly to avoid peak fees.
Secret: Coordinate transfer during low market activity to avoid missing corporate action deadlines.
15. Final checklist — your Demat hygiene
Know your DP’s fee schedule inside out.
Keep KYC & bank details updated and linked.
Avoid giving unrestricted POA; prefer limited authorizations.
Reconcile statements weekly.
Use pledge sparingly and understand haircut rules.
Track corporate action dates and tax implications.
Enable strong authentication and freeze options if suspicious activity occurs.
Use consolidated broker/DP tax reports at filing time.
Conclusion
A Demat account is more than a passive repository — it’s an operational hub for your market activity. Traders who master its mechanics and hidden levers (fee optimization, pledge use, corporate action handling, security practices) gain efficiency, reduce unexpected costs, and protect themselves from fraud. Whether you’re day-trading, swing trading, or building a long-term portfolio, treat your Demat account with the same discipline you apply to strategy and risk management. Small operational advantages compound over months and years — and often separate consistent winners from unlucky participants.
Silver Futures – Bearish Reversal in Progress
Silver Futures – Bearish Reversal in Progress
Description:
Silver is showing a strong technical reversal across timeframes. Short-term correction looks likely.
Technical Setup:
Daily:
Evening Star + Bearish Engulfing
Flattening EMAs
Volume and MACD confirming momentum slowdown
Weekly:
Gravestone + Southern Doji near resistance
RSI close to overbought
EMA slope still up, but weakening signs visible
Macro View:
No major bearish macro trigger — Fed dovish, USD stable, inflation low.
→ This is likely a technical pullback, not a fundamental reversal.
Trade Plan:
🔻 Breakdown Level: ₹114,560
🎯 Targets: ₹107K → ₹101K → ₹93K
🛑 SL: ₹116,000+
Caution: No position without breakdown confirmation.
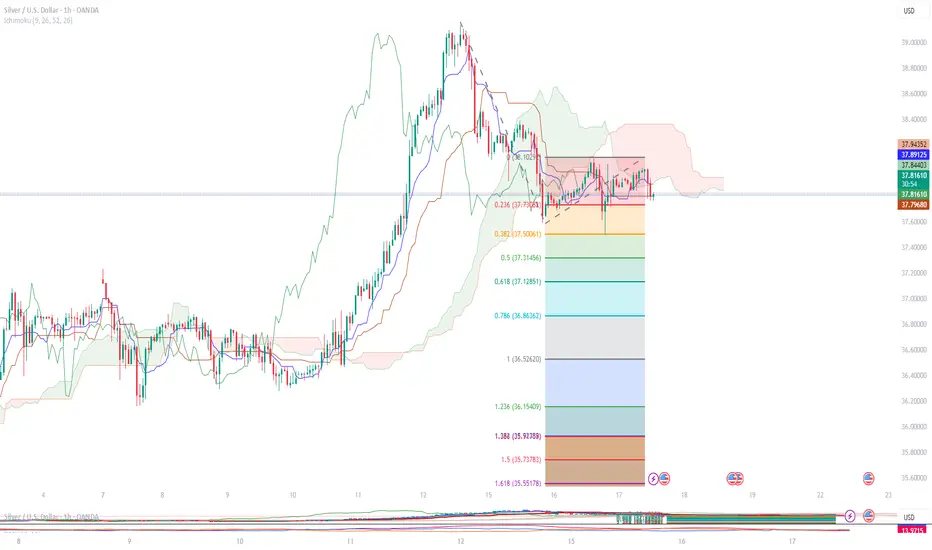
OH Silver Chart Indicate some bearish tone...Key Points:
Trend:
The price is below the Ichimoku cloud → showing a bearish trend.
The blue and red lines (Tenkan & Kijun) are also in a bearish position.
The price is near the 0.236 Fibonacci level (around $37.78) – acting as a weak support.
Resistance Zone:
Around $38.10 – $38.20
Support Levels (Fibonacci):
0.382 → $37.50
0.5 → $37.31
0.618 → $37.12
1.0 → $36.52
🔄 Swing Trading Idea (Sell Setup):
Direction: Sell (because the trend is weak)
Entry Zone: $37.79 – $37.83 (Current Price)
Target 1: $37.50
Target 2: $37.12
Stop Loss (SL): Above $38.10
Risk-Reward Ratio: Around 1:2
If price goes above $38.10, this sell idea will fail.
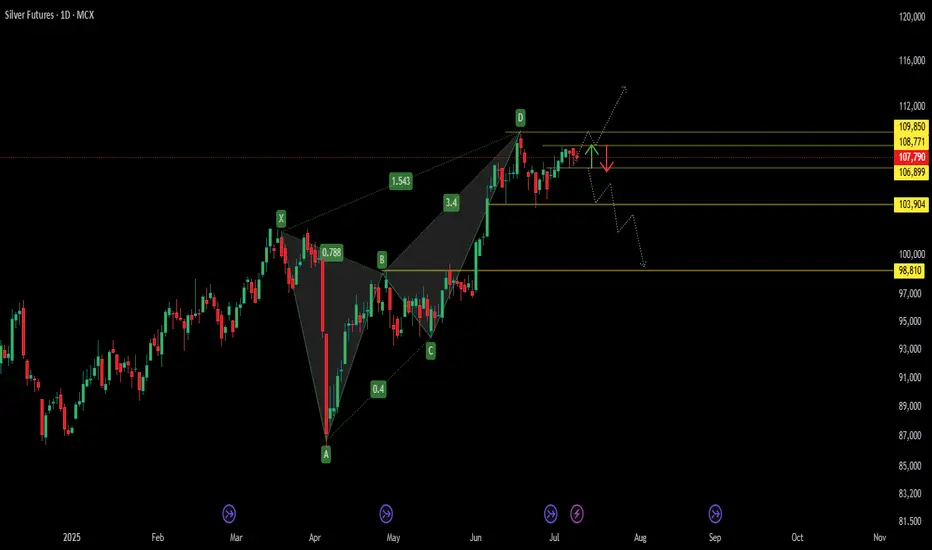
Bearish Harmonic in Play – Silver Sell Zone TriggeredBearish Harmonic in Play – MCX:SILVER1! Sell Zone Triggered 🔔
The pattern marked from X → A → B → C → D forms a Bearish Harmonic Structure , most likely a Bearish Butterfly , confirmed by key Fibonacci ratios:
* XA to AB retracement: 78.8%
* BC to CD extension: 1.543
This setup signals the formation of a Potential Reversal Zone (PRZ) near point D , where a bearish trend may initiate.
📉 Bearish Price Outlook
The dotted projection lines and red arrow illustrate the anticipated downward move:
* Price is likely to face resistance and reverse from the PRZ between ₹108,771 and ₹109,850
* A break below ₹106,899 could trigger further decline toward key support levels at ₹103,904 and ₹98,810
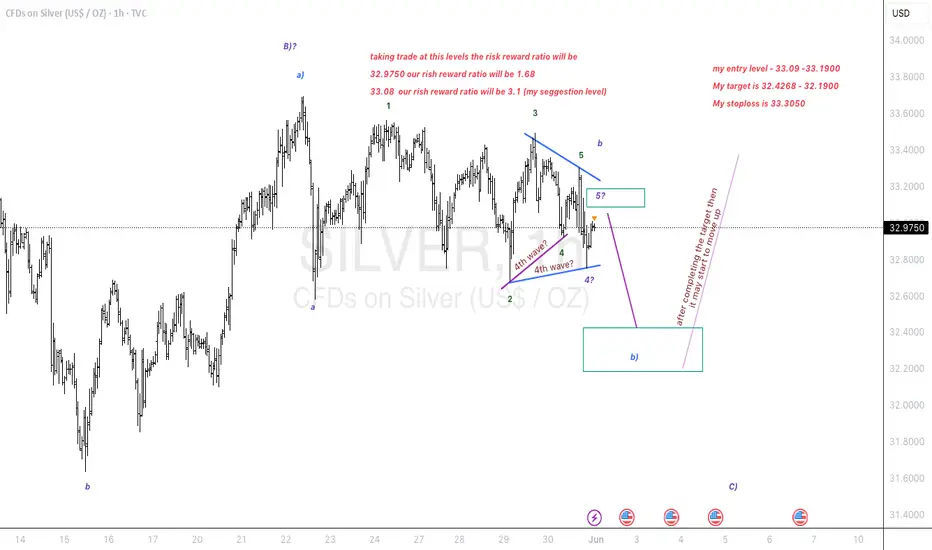
Triangle breakout in silver. Down to earth..
Elliott Wave Analysis:-
1st possibility:- (look Previous chart published)
Silver is in a triangle breakout. if it is getting towards upside breakout then we have a nice opportunity of pullback and and we can add it if the pullback occurs. else we can enjoy this journey quietly.
2nd possibility:-
Silver had already made a pullback towards down side breakout. Once it start the way it will fly towards downside and then it will complete a C wave in whole B wave then upside C wave will be impulsive.
My Entry, Stop, Target all have been discussed.
My suggestion to take a trade at this place to reduce the risk better reward.
I just spoke what chart whisper's in my ear.
I am not a SEBI registered advisor. Before taking a trade do your own analysis or consult a financial advisor. I share chart for education purpose only. I share my trade setup.
XAGUSD/SILVER 4H BUY PROJECTION 06.09.24In this latest upward cycle of the silver market, Fed interest rate moves are playing an oversized role in pumping up silver prices. In early July, as analysts factored in the rising potential for interest rate cuts in the remainder of 2024, silver prices were once again testing May's nearly 12-year high.

Silver....What a fall in silver....
With unprecedented move in silver last couple of days saw a very good profit booking.
Now at TL Supp...
Trading channel Marked.
Imp Reversal Marked..
Every Bounce is a SELL.
Happy Trading
Like... Share... Support

Silver - 2nd Opportunity to Short: C wave.Silver had a strong run up till 86k, after which profit booking was seen which brought it down till 83k.
Now, pull back of the first wave of profit booking seems complete, which gives another opportunity to take a short trade.

Silver - Correction Time?A 1:1 movement (on Daily) has completed with a rising wedge in the end.
Expecting a 1.5-2k point pull back to start with.
A very good RR trade. :)

Silver sell on risejust like gold silver gap up on 20th march the price is fading its buying momentum and with that bias im looking for sell on rise setup
which i think 75300 could be the short entry and sl will be 75500 with the target of 74300 and second target of 73600
conclusion the target area are possible area to boost the buying liquidity again there will be exiting the trade

Short the SILVER(XAGUSD).Elliott wave analysis:-
Impulse wave formation has been formed.
1,3,5 wave are impulse and the 5the wave was an Ending Diagonal. .
if this wave has not broke above the 5th wave then we can go for short at CMP.
stoploss@22.24201
if pattern failed then we have to wait and watch the wave formation.
i am not a SEBI registered advisor. Before taking a trade do your own analysis or consult a financial advisor. I share chart for education purpose only. I share my trade setup.

Bulls be carefulFriday's price action
a) brought the price precariously close to the descending triangle breakdown
b) Trendline recapture miserably failed and confirmed the breakdown
Both (and 2 other EW based factors) points towards price reaching green zone after break of blue zone.
The momentum oscillator is also no-where near the oversold zone and indicating some more downside possibility.
Lets see how this develops further.
Happy Trading !

silver could fall 3-4% ?? The Gap up of 30th aug was not Bullish case in the price
gap just grabed all the pending liqduidity from old order block (from 20 and 27 july)
due to gap up price face hard selling liquidity and buyer liquidity made a stretch of (15 or more than !%) which created the imbalance
with all this conditions it is clear that price will be dropping lower to find more buyer liqudity
the red arrow highlighting the buyer liqudity lvls
for long entry only from 70600 - 70400 & main point of interest will be 70,000 - 69350

Selling Silver below 72025Below 72025 breakout, Selling silver for targets of 71000 and 70472 for the longer-term and 71064 as an immediate target.
On rejection of immediate support, 72154-150 and the price is rallying up then an alternative short is on rejection of 72750 as resistance.

silver short Breakdown from consolidation in the downtrend. looks like the lower supports will be tested and the momentum oscillators are also in the bearish territory.

Silver Important Intraday update !Short silver if manages to close below support region.
target or next immediate support of silver is marked in the chart.
