Singapore Nifty has Cup and Handle - 23-1-2023 Note: Always try to find a good #price action patterns or any #candle stick patterns in marked zones in smaller timeframe to take entry with small stop loss. Or can take entry based on one 5 min candle close below or above the zone with SL previous candles high or low (*try to avoid big candles) .
(Color code for #Support & Resistance zones: Red - Sell, Green - Buy, Price once cross above resistance it is obvious it will work as support, vis versa price cross below support zone ). Please understand that market can break all the support and resistance anytime. If any doubt for take entry in price action patterns, please ask in comment box, i will try to help.
Disclaimer: Im not tip provider and this chart is not indented to take trade in my levels, It is shared here for learning purpose. Trading in this pattern is all your own risk. #Nifty #cupandhandle #bullishpattern
Singapore

💡Don't miss the great buy opportunity in USDSGDMidterm forecast:
While the price is above the support 1.2995, beginning of uptrend is expected.
We make sure when the resistance at 1.3460 breaks.
If the support at 1.2995 is broken, the short-term forecast -beginning of uptrend- will be invalid.
Technical analysis:
The RSI downtrend #1 is broken, so the probability of beginning of uptrend is increased.
A trough is formed in daily chart at 1.3146 on 01/06/2021, so more gains to resistance(s) 1.3335, 1.3390 and maximum to Major Resistance (1.3460) is expected.
Price is above WEMA21, if price drops more, this line can act as dynamic support against more losses.
Relative strength index (RSI) is 53.
Take Profits:
Take Profits:
TP1 @ 1.3335
TP2 @ 1.3390
TP3 @ 1.3460
TP4 @ 1.3675
TP5 @ 1.3785
TP6 @ 1.4035
TP7 @ 1.4635
TP8 Free
❤️ If you find this helpful and want more FREE forecasts in TradingView
. . . . . Please show your support back,
. . . . . . . . Hit the 👍 LIKE button,
. . . . . . . . . . . Drop some feedback below in the comment!
❤️ Your Support is very much 🙏 appreciated! ❤️
💎 Want us to help you become a better Forex trader ?
Now, It's your turn !
Be sure to leave a comment let us know how do you see this opportunity and forecast.
Trade well, ❤️
ForecastCity English Support Team ❤️


SGX NIFTY (NIFTY 50) MIRRORSGX nifty is currently rallying towards 10550 on pull back rally now the chart is retracing towards 9000

technically SGX nifty has price rotation.? 8323 target then, price will not break or close 8622. Incase of break & close above 8612, then channel will not continue.
Daily chart:
During the falling wave, 3 times reduction in price has been seen.
While using the retracement, 32.2% retraced is at 9249. Price rotatio range is betw een 8838 and 8188.

Ying Li intl stock can buying opportunityYing Li intl stock can be buying opportunity with trending with rising ema 21 days.

HawPar stock may fall furtherStock Haw Par (H02.SI) Singapore listed stock trading below 55 days MA.
Macd indicator also signals below zero line which is also negative.
After break of major support 12.30 stock to level of 12.10 and 12.00

COSCO SHP SG may test 0.330Stock can test level of 0.330 in coming days after breaking major support of 0.345.
Also MACD indicator pointing downward trend with trading below signal line.
Stock facing immediate resistance around 0.370 as per price rejection around this level clearly visible.

Berjaya Corporation Bhd rise furtherBerjaya Corporation Bhd after forming double bottom around 0.260 consolidate in price band of 0.270-0.290.
On first time stock breaks and made high 0.290 with volume surge.
Stock can rise till 0.300-0.315 with support comes at 0.260 on closing basis

Ezion stock can bounce after crossing 0.047Ezion stock can bounce after crossing 0.047 level immediate support comes at 0.042 break of which can lead stock to retest the level of 0.38.
RSI indicator also reverse from level of 40.

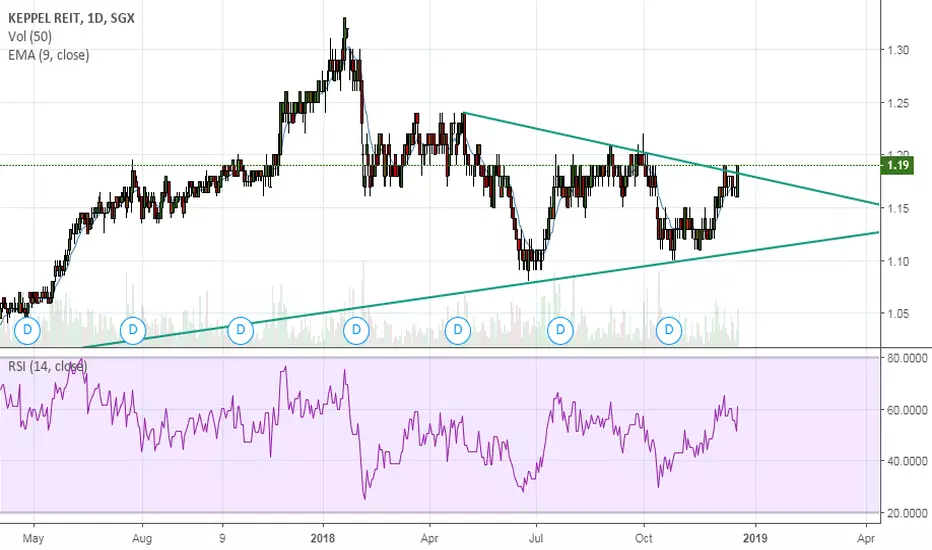
Keppel Reit Breaks out of traingle patternKeppel Reit breakout and closed above trend line forming triangle.
It can rise up to 1.23 even after SGX index fall this stock remains in positive zone.
Below 1.15 this breakout fails.
Maple Tree Log Tr breaking ResistanceMaple Tree Log Tr breaking Resistance level of 1.30.
Stock made low around 1.18 and shift upwards after forming Doji around this level.
Stock is rising in uptrend with strong momentum.
Momentum indicator like RSI also rising current value pointing to 65.0 level.
Stock can rise till 1.35-1.38 with support comes around 1.23-1.24

Genting Sing Stock (G13) in uptrendGenting Sing (G13) stock tested rising trend line around 0.960 level.
Stock can rise above 1.05.
As per moving averages trading sideways
can be also one indicator that stock going to trade side ways quite some time but give upside breakout after recent higher high formation.

Maple tree Log Trust stock trading in channelStock Maple tree Log Trust trading in parallel channel with Price range of 1.18-1.31.
To get up move in price need to break out from this channel.
Till one can trade in this range.

HPH TRUST USD Stock HPH TRUST USD looks bullish carts forming rounding bottom like pattern.
stock can rise up to level 0.295.

Keppel Corp forming rectangle patternKeppel Corp forming and trading Rectangle Continuation pattern.Today price actin saw huge bullish candle close near high end of rectangle.candle for looks like Bullish Morbozu with open and low remains the same.
One can keep watch on stock for breakout.

SIA Singapore Airlines can be a range playSingapore Airlines stock will trade in range of 9.50 to 9.90. if stock break this trading range either on upside or downside.
As to look sector as whole airlines stocks globally have headwinds higher fuel prices.Recent fall in oil prices be good for these stocks.
Positive only above break of $10.Below 9.50 slide to 9.30-9.00
