3 Signs a Smallcap Can Become a Multibagger!Hello Traders!
Smallcap stocks are like hidden treasure chests in the stock market, most people ignore them until they explode in value.
But how do you separate future multibaggers from risky bets?
Here are 3 signs that can help you spot the potential winners early.
1. Strong & Consistent Revenue Growth
A company that’s steadily increasing its sales is building a strong foundation.
In smallcaps, consistent revenue growth shows the business is gaining market share and customer trust.
Look for companies that can grow even in slower economic conditions.
2. Low or Zero Debt
Debt can crush small companies during tough times.
A low-debt or debt-free balance sheet means the company can focus on growth instead of paying interest.
It also makes them more attractive to institutional investors.
3. Expanding Profit Margins
If a company can improve its margins while growing sales, it means they’re becoming more efficient.
Better margins often lead to higher profits, which can push the stock price up significantly.
Rahul’s Tip:
Smallcaps can be multibaggers, but they can also be wealth destroyers if chosen poorly.
Always check management quality, industry potential, and whether the company is transparent with its investors.
Conclusion:
Finding the next multibagger isn’t about luck, it’s about spotting strong fundamentals early.
When you find a smallcap with growing sales, low debt, and improving margins, you might just be looking at your next big winner.
If this post gave you ideas, like it, share your views in the comments, and follow for more stock market insights you can actually use!
Smallcapstocks

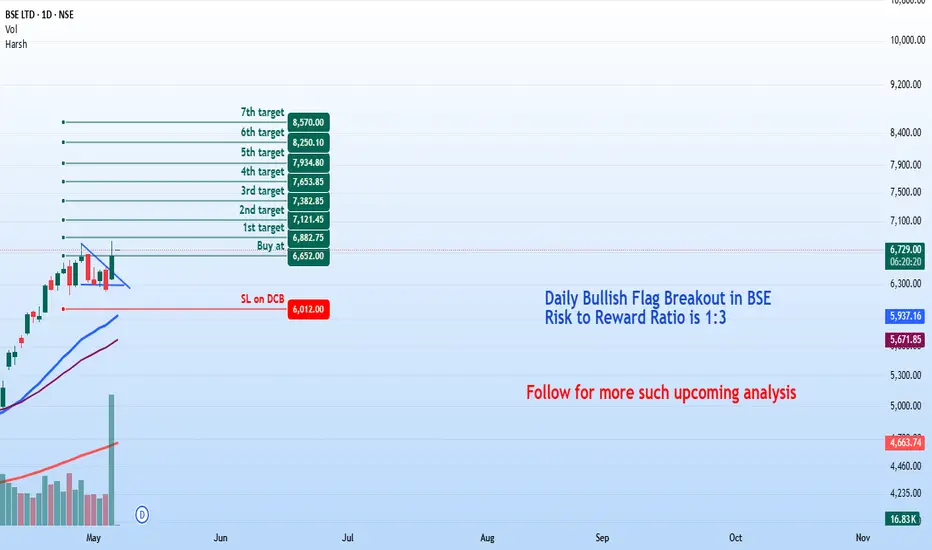
BSE Ltd - Bullish Breakout Setup (Daily Timeframe)Stock: BSE Limited ( NSE:BSE )
Trend: Strong Bullish Momentum 🚀
Risk-Reward Ratio: 1:3 (Favorable)
Trade Parameters
🎯 Entry Zone: ₹6,650 (Breakout Confirmation)
🛑 Stop Loss: ₹6,012 (Daily Closing Basis) (~9.6% Risk)
🎯 Target Levels:
₹6,882.75
₹7,121.45
₹7,382.85
₹7,653.85
₹7,934.80
₹8,250.10
₹8,570 (Final Target)
Technical Justification
✅ Bullish Flag Breakout - Price has broken out from a consolidation pattern, indicating continuation of uptrend
✅ Strong Momentum - Daily & Weekly RSI >60 (Bullish zone)
✅ Volume Confirmation - Breakout volume 10.8M vs previous day's 2.51M (4.3x surge!)
✅ Fundamental Catalyst - Very good quarterly results supporting bullish sentiment
Key Observations
• The breakout comes with exceptionally high volume, validating strength
• Multiple targets allow for progressive profit booking
• Risk-reward ratio of 1:3 makes this an attractive setup
Trade Management Tips
• Consider partial profit booking at each target level
• Move stop loss to breakeven after Target 1 is achieved
• Trail stop loss to protect profits as price progresses
Disclaimer 📢
This analysis is for educational purposes only and does not constitute financial advice. Trading in equities involves substantial risk of loss and is not suitable for every investor. Past performance is not indicative of future results. Always conduct your own research and consider your risk tolerance before making any investment decisions. The author assumes no responsibility for any trading losses that may occur from using this information.
Medium term trading opportunity in KIMS for >20% upsideHi,
NSE:KIMS has given a Bullish Flag Breakout on Weekly charts with very good volume.
MACD is also on the bullish side on Weekly time frames. RSI is also on the bullish side on daily, weekly and monthly time frames.
In the current market scenario, I am expecting that the bullish momentum will continue.
Complete price projection like entry, stop loss and targets mentioned on the charts for educational purpose.
Don't Forget to Follow me to get all the updates.
Please share your feedback or any queries on the study.
Disclaimer: Please consult your financial advisor before making any investment decision.

Bullish Flag Breakout in Marico. A Potential Upside OpportunityStock: Marico Ltd. (NSE: MARICO)
CMP: ₹715
Buy Above: ₹715
Stop Loss: ₹678
Target Levels: ₹729.50, ₹745.20, ₹761.25, ₹777.60, ₹794.30, and ₹810 (Final Target)
Time Frame: Short to Medium Term
🏢 About the Company: Marico Ltd.
Marico Limited is one of India's leading consumer goods companies operating in the beauty and wellness space. With well-known brands like Parachute, Saffola, Hair & Care, Set Wet, and Livon, Marico has a strong domestic presence and a growing international footprint across emerging markets in Asia and Africa. The company is known for consistent performance, strong cash flows, and product innovation in the fast-moving consumer goods (FMCG) sector.
Sector: FMCG
Market Cap: Approx. ₹91,000 Cr (as of April 2025)
Headquarters: Mumbai, Maharashtra
NSE/BSE Code: MARICO
🔍 Technical Analysis
A bullish flag breakout has been observed on the daily chart, indicating a potential continuation of the uptrend. Key observations:
Strong volume spike confirms buyer interest at breakout levels.
The price broke above the flag pattern with a decisive close above the resistance trendline.
Moving averages are aligned in a bullish formation (price > 20 EMA > 50 EMA).
RSI near 62 and rising, without being overbought, supports further upside.
This setup aligns with classic flag pattern breakout behavior, offering an excellent risk-reward ratio.
📊 Trade Setup
Entry Stop Loss Target 1 Target 2 Target 3 Target 4 Target 5 Final Target
₹715 ₹678 ₹729.50 ₹745.20 ₹761.25 ₹777.60 ₹794.30 ₹810
⚠️ Disclaimer
This analysis is for educational and informational purposes only.
I am not a SEBI-registered advisor. All trading and investment decisions should be made based on your own research or consultation with a qualified financial advisor. Stock markets involve risks, and past performance is not indicative of future results. Please use proper risk management and position sizing strategies when trading.
Don't forget to Follow for more such Ideas

RCF is in bullish mode.RCF is forming evening star candle stick pattern on monthly chart.
As per chart it may test 240 soon as it is previous high level.
Returns around 78%.
As per report upcoming monsoon session will be better than expectation.
It is in Demand zone can long it for next 2-4 months.

Nifty / Small Cap 100Hello & welcome to this analysis
The relative strength of Nifty vis a vis Small Cap index is showing signs of a reversal from its slanting trend line after a period of 56 months of underperformance.
What does relative strength (RS) signify?
It suggests whether the underlying financial asset (in this case Nifty) is outperforming or underperforming against another financial asset (in this case Small Cap 100)
It means, in case of this RS slanting upwards
In rallies Nifty will do better than Small Cap 100
In corrections Nifty will fall less than Small Cap 100
If we go by the past reference as plotted, then a big reversal could be happening in terms of time for a period of 2 years at least. The horizontal lines as marked are trigger levels one needs to review.
Investing in Large caps (Nifty) appears safer than Small caps from here onwards unless this flips and continues to decline.
All the best with your investing & trading decisions

Trading Opportunity: Kabra Extrusiontechnik (Daily Flag BreakoutStock: NSE:KABRAEXTRU
Pattern: Flag Breakout (Daily Chart)
Type: Short to Medium-Term Trade
Trade Details
Buy Level: ₹513
Stop-Loss: ₹485
Targets:
₹527
₹543.35
₹555.60
₹570.05
₹584.35
Final Target: ₹597.50
Risk-to-Reward Ratio: 1:3
Analysis and Rationale
Kabra Extrusiontechnik has formed a classic flag breakout pattern on the daily chart, signifying a strong continuation of the ongoing uptrend.
Entry Level: ₹513 aligns with the breakout confirmation.
Stop-Loss: ₹485 protects against invalidation of the setup.
Targets: Derived based on measured moves and prior resistance levels.
Key Observation s
Trend Continuation: The flag breakout indicates bullish momentum.
Risk Management: Attractive risk-to-reward ratio of 1:3 enhances trade viability.
Scaling Out: Partial profit-booking at intermediate targets is advised.
Disclaimer
This analysis is for educational purposes only. Trading involves risk; consult a financial advisor before making investment decisions. Always trade within your risk tolerance.

Trading Opportunity: Salzer Electronics (On-Neck Breakout)Stock: NSE:SALZERELEC
Pattern: On-Neck Breakout (Weekly Chart)
Type: Medium-Term Trade Opportunity
Trade Details
Entry Point: Buy at ₹1411
Stop-Loss: ₹1257
Targets:
₹1486.45
₹1561.90
₹1649.90
Final Target: ₹1739
Risk-to-Reward Ratio: 1:2
Analysis and Rationale
The stock of Salzer Electronics has shown an on-neck breakout on the weekly chart, indicating a continuation of bullish momentum. This breakout is backed by strong price action, suggesting a favorable medium-term opportunity for traders.
Entry Level Justification: ₹1411 is a key level of confirmation where the breakout appears sustainable.
Stop-Loss Positioning: ₹1257 serves as a strategic stop to protect capital while allowing the trade room to develop.
Target Projections: The targets are calculated based on historical resistance levels and measured moves post-breakout.
Key Observations
Bullish Momentum : The on-neck breakout signifies buyer strength, hinting at further upside potential.
Volume Confirmation: Monitor trading volume, as increasing volume can further validate the breakout.
Medium-Term Horizon: The trade is structured for medium-term gains, ideal for positional traders.
Trade Plan
Risk Management: Maintain discipline by adhering to the stop-loss to ensure controlled risk.
Scaling Out: Consider partial profit-booking at intermediate targets to lock in gains.
Monitoring: Regularly track the stock’s performance to adjust levels if market conditions change.

SARLAPOLY By KRS Charts27th Nov 2024 / 3:30 PM
Why SARLAPOLY ❓
1. Stock was Stuck under 80 Rs. Resistance since many Years and this year in May it broke the resistance and sustained above 80 Rs. 📈
2. Fundamentally Good company with less than 15 P/E. 💪
3. With Accumulations on Higher TFs SARLAPOLY is making Cup & Handle Pattern. ☕
4. As we discuss it already Broke 80 Rs. Range and recently it retests too on same resistance this makes my conviction strong on this 💪
5. Today giving 15 % Upside move with Strong Volume is confirmed Entry.
✅
Target is expected 145 Rs in Medium to long Term
With SL of 78 Rs 1W Closing basis.

Supriya Lifescience Ltd. (SUPRIYA): Flag Breakout OpportunityKey Points:
Pattern : Clear Bullish Flag breakout on daily chart.
Entry : Ideal buy point at ₹804 after breakout confirmation.
Stoploss : Set at ₹745 to protect against downside.
Targets:
833 INR
862 INR
891 INR
922 INR
948 INR
977 INR
Risk-Reward : Offers a potential reward up to 173 INR with a risk of 59 INR.
Considerations: Volume spike on breakout necessary for validation. Always review market conditions and company fundamentals.

KIRIINDUS (Kiri Industries Ltd.): Bullish Flag BreakoutSetup:
Pattern: Kiri Industries has formed a Bullish Flag on the daily chart, signaling a potential continuation of the prior uptrend.
Breakout: The stock has recently broken out of its consolidation phase, confirming the flag pattern.
Entry Strategy:
Buy at: 613 INR. Wait for a confirmation close above the flag's resistance for entry.
Risk Management:
Stoploss: Set at 554 INR, positioned below the flag's lower trendline.
Profit Targets:
1st Target: 644 INR
2nd Target: 670 INR
3rd Target: 702 INR
4th Target: 729 INR
5th Target: 760 INR
6th Target: 788 INR
Risk/Reward:
Risk : 59 INR (Entry - Stoploss)
Rewards: Ranging from 31 INR to 175 INR, offering a strong risk-reward profile.
Notes:
Volume Confirmation: Ensure the breakout volume is higher than average to validate the setup.
Market Context: Consider the sector and broader market trends for added confidence.
Fundamentals: For long-term holds, review company fundamentals.
This setup provides traders with a clear plan for entering, managing risk, and aiming for multiple profit levels. However, always adapt your strategy to real-time market conditions.

KOTHARI PETRO By KRS Charts31st Oct 2024 / 10:13 AM
Why KOTHARIPETRO❓
1. Fundamentally Good Company with Good Durability and at Good Valuations. ✅
2. Technically, All Time Bullish Stock. 📈
3. In August, Broke Resistance and Now again giving opportunity to Buy at same Price while Retesting same Resistance Zone.
4. Though Better Entry would be around 206 to 209 Rs range.
5. Further Bullish sign, Bullish Continues Divergence is visible with MACD, means Sellers are Exhaust and Failed to Make New High. 💪
Target is Marked in Chart SL will be Flexible Either staying above 100 EMA or Staying above Resistance Zone any.

Easy 20% return with Piccadily Agro IndustriesBSE:PICCADIL looks perfectly poised to give a solid 20% return to investors with a short term horizon.
Technicals: When we see the candlestick chart on a daily basis, it is trading at 750 which lies in between its nearest support at 700 and nearest resistance of 780. The MACD indicator points in the direction of an uprise with a healthy positive value.
Fundamentals: BSE:PICCADIL is a very fundamentally strong stock. It has high ROCE and ROE of 29.6% and 30.6% respectively. BSE:PICCADIL QoQ sales have increased by 62% and QoQ profits have increased by 121%. This shows it has got healthy growth going forward. Also its revenue mix is starting to be dominated by the distillery segment over its sugar segment. This showcases BSE:PICCADIL has diversified in the right direction, in turn unlocking more value for its shareholders.
Trade Setup: Buy BSE:PICCADIL when it hits 780, place a stop loss at 720 and a sell order at 960.

Medium term trading opportunity in Black Box for V.good upsideHi,
NSE:BBOX has given a Bullish Flag Breakout on Weekly charts with very good volume.
MACD is also on the bullish side on Weekly time frames. RSI is also on the bullish side on daily, weekly and monthly time frames.
In the current market scenario, I am expecting that the bullish momentum will continue.
Complete price projection like entry, stop loss and targets mentioned on the charts for educational purpose.
Don't Forget to Follow me to get all the updates.
Please share your feedback or any queries on the study.
Disclaimer: Please consult your financial advisor before making any investment decision.

Medium term opportunity in Coromandel for >20% upsideHi,
NSE:COROMANDEL has given a Bullish Flag Breakout on Weekly charts with very good volume.
MACD is also on the bullish side on Weekly time frames. RSI is also on the bullish side on daily, weekly and monthly time frames.
In the current market scenario, I am expecting that the bullish momentum will continue.
Complete price projection like entry, stop loss and targets mentioned on the charts for educational purpose.
Don't Forget to Follow me to get all the updates.
Please share your feedback or any queries on the study.
Disclaimer: Please consult your financial advisor before making any investment decision.

Medium term opportunity in Oriental PG Electr for V. good upsideHi,
NSE:PGEL has given a Bullish Flag Breakout on Weekly charts with very good volume.
MACD is also on the bullish side on Weekly time frames. RSI is also on the bullish side on daily, weekly and monthly time frames.
In the current market scenario, I am expecting that the bullish momentum will continue.
Complete price projection like entry, stop loss and targets mentioned on the charts for educational purpose.
Don't Forget to Follow me to get all the updates.
Please share your feedback or any queries on the study.
Disclaimer: Please consult your financial advisor before making any investment decision.

Short term opportunity in Dynamic Cables for V. good UpsideHi,
NSE:DYCL has given a Bullish Flag Breakout on Daily charts with very good volume.
MACD is also on the bullish side on Weekly time frames. RSI is also on the bullish side on daily, weekly and monthly time frames.
In the current market scenario, I am expecting that the bullish momentum will continue.
Complete price projection like entry, stop loss and targets mentioned on the charts for educational purpose.
Don't Forget to Follow me to get all the updates.
Please share your feedback or any queries on the study.
Disclaimer: Please consult your financial advisor before making any investment decision.

Short term trading opportunity in GP ECO for > 20% upsideHi,
NSE:GPECO has given a Bullish Flag Breakout on Daily charts with very good volume.
MACD is also on the bullish side on Weekly time frames. RSI is also on the bullish side on daily, weekly and monthly time frames.
In the current market scenario, I am expecting that the bullish momentum will continue.
Complete price projection like entry, stop loss and targets mentioned on the charts for educational purpose.
Don't Forget to Follow me to get all the updates.
Please share your feedback or any queries on the study.
Disclaimer: Please consult your financial advisor before making any investment decision.

Medium term opportunity in Suven Pharma for V. Good UpsideHi,
NSE:SUVEN has given a Bullish Flag Breakout on Weekly charts with very good volume.
MACD is also on the bullish side on Weekly time frames. RSI is also on the bullish side on daily, weekly and monthly time frames.
In the current market scenario, I am expecting that the bullish momentum will continue.
Complete price projection like entry, stop loss and targets mentioned on the charts for educational purpose.
Don't Forget to Follow me to get all the updates.
Please share your feedback or any queries on the study.
Disclaimer: Please consult your financial advisor before making any investment decision.

Medium term trading opportunity in Aarvee Den for V. good UpsideHi,
NSE:AARVEEDEN has given a Bullish Flag Breakout on Weekly charts with very good volume.
MACD is also on the bullish side on Weekly time frames. RSI is also on the bullish side on daily, weekly and monthly time frames.
In the current market scenario, I am expecting that the bullish momentum will continue.
Complete price projection like entry, stop loss and targets mentioned on the charts for educational purpose.
Don't Forget to Follow me to get all the updates.
Please share your feedback or any queries on the study.
Disclaimer: Please consult your financial advisor before making any investment decision.

Texmaco Rail& Eng by KRS Charts20th Sept 2024 / 3:19 PM
Why TEXRAIL ❓
1. All Over Bullish in Trend by making HHs & HLs.
2. Was correcting for over 3 months and Today Big Green Candle Closing with Range Breakout ✅
3. Also, in 1W it'll probable closing hammer candle stick too.
4. Furthermore, my conviction is on today only is because of its in Fibbo Golden Zone ❗
Target is Expected to break ATH price point 👍🎯

Short term trading opportunity in Hindalco Ind for > 10% upsideHi,
NSE:HINDALCO has given a Bullish Inverted Head & SHoulder Breakout on Daily charts with very good volume.
MACD is also on the bullish side on Weekly time frames. RSI is also on the bullish side on daily, weekly and monthly time frames.
In the current market scenario, I am expecting that the bullish momentum will continue.
Complete price projection like entry, stop loss and targets mentioned on the charts for educational purpose.
Don't Forget to Follow me to get all the updates.
Please share your feedback or any queries on the study.
Disclaimer: Please consult your financial advisor before making any investment decision.

Medium term trading opportunity in VPRPL for v. good upsideHi,
NSE:VPRPL has given a Bullish Flag Breakout on Weekly charts with very good volume.
MACD is also on the bullish side on Weekly time frames. RSI is also on the bullish side on daily, weekly and monthly time frames.
In the current market scenario, I am expecting that the bullish momentum will continue.
Complete price projection like entry, stop loss and targets mentioned on the charts for educational purpose.
Don't Forget to Follow me to get all the updates.
Please share your feedback or any queries on the study.
Disclaimer: Please consult your financial advisor before making any investment decision.
