XAUUSD – H2 Technical AnalysisXAUUSD – H2 Technical Outlook: Bullish Structure Rebuild as Precious Metals Surge | Lana ✨
Precious metals are back in focus as silver surges sharply, adding momentum to the broader metals complex. In this context, gold is showing signs of structure rebuilding after a healthy correction, setting the stage for potential continuation.
📈 Market Structure & Technical Context
After a strong impulsive drop, gold successfully defended the 4,420–4,450 strong support zone, where buyers stepped in decisively. Since then, price has been forming higher lows along an ascending trendline, signalling a shift from distribution into recovery.
The current price action suggests this move is corrective-to-bullish, not just a short-lived bounce.
🔍 Key Levels to Watch
Strong Support: 4,420 – 4,450
This zone remains the structural base. As long as price holds above it, bullish scenarios stay valid.
Mid Resistance / Reaction Zone: ~5,050 – 5,080
Price is currently consolidating here, absorbing supply after the rebound.
Next Resistance: ~5,135
A clean break and acceptance above this level would confirm continuation strength.
Upper Targets: ~5,300 – 5,350
Aligned with Fibonacci extensions and prior supply zones.
Higher Objective: ~5,580
Only in play if bullish momentum accelerates across the metals market.
🎯 Bullish Scenarios
If gold continues to respect the upper trendline and holds above the 5,000 psychological level:
A brief pullback into 5,000–5,050 could offer structure for continuation.
Acceptance above 5,135 opens the path toward 5,300+.
Strong momentum, supported by silver’s breakout, could extend moves toward 5,580.
Any pullbacks toward support are currently viewed as constructive corrections, not weakness.
🌍 Intermarket Insight
Silver’s sharp rally highlights renewed demand across precious metals, often acting as a leading signal for broader sector strength. This backdrop supports the idea that gold’s recent correction was a reset, not a reversal.
🧠 Lana’s View
Gold is rebuilding its bullish structure step by step. The focus is not on chasing price, but on how price reacts at key levels. As long as structure and momentum remain aligned, the broader trend stays constructive.
✨ Stay patient, respect the zones, and let the market confirm the next expansion.
Smartmoney

XAUUSD (H3) – Liam PlanXAUUSD (H3) – Liam Plan
Safe-haven bid is back, but structure is still corrective | Trade the zones, not the headlines
Quick summary
Gold is up for a second day as US–Iran tensions revive safe-haven demand. At the same time, expectations for Fed rate cuts keep the USD on the defensive, which typically supports non-yielding assets like gold. However, with ADP and ISM Services PMI ahead, short-term volatility can spike fast — and that’s exactly where gold tends to run liquidity before choosing direction.
My approach: respect the macro tailwind, but execute based on structure.
Macro context
Gold usually benefits when:
geopolitical risk rises (risk-off flows),
rate-cut expectations increase (lower real yields),
the USD weakens or struggles to sustain a bounce.
That said, pre-data sessions often produce fake moves. The market will likely “test” both sides before committing.
Technical view (H3 – based on the chart)
Price rebounded sharply from the recent low, but the overall swing structure is still in a correction / rebalancing phase after a major impulse down.
Key zones on the chart:
Major supply / premium target: 5570 – 5580 This is the clear “sell reaction” zone if price expands higher.
Current decision area: around 5050 – 5100 Price is pushing back into a key mid-range level — where continuation must prove acceptance.
Deep demand / liquidity base: 4408, then 4329 If the market fails to hold higher supports, these are the next magnets for sell-side liquidity.
This is a classic: bounce → retest → decide environment.
Trading scenarios (Liam style: trade the level) Scenario A: Continuation bounce
If price holds above the current base and continues to reclaim levels:
Upside rotation can extend toward 5200 → 5400 → 5570–5580
Expect reactions near each resistance band, especially approaching premium.
Logic: safe-haven flows + softer USD can fuel continuation, but only if price accepts above the mid-range.
Scenario B: Rejection and rotation lower
If price fails to hold above 5050–5100 and prints rejection:
Expect a pullback back into prior demand
Deeper continuation opens toward 4408, then 4329
Logic: corrective rallies often redistribute before the next leg lower, especially around major data.
Execution notes
With ADP + ISM ahead, avoid chasing candles.
Wait for price to tag the zone and show a clear reaction.
Trade smaller if spreads widen.
My focus: If price accepts above the mid-range, I’ll respect the bounce. If it rejects, I’ll treat the move as a corrective rally and look for rotation lower. Either way, I’m trading levels — not headlines.
— Liam

XAUUSD – H2 Technical AnalysisXAUUSD – H2 Technical Outlook: Short-Term Sell Pressure as Liquidity Gets Cleared | Lana ✨
Gold is showing signs of short-term weakness after an aggressive upside expansion. Price action suggests the market may continue to move lower in the near term, not as a trend reversal, but as a liquidity-driven correction within a broader bullish structure.
At this stage, the focus shifts from continuation to how price behaves while liquidity is being taken below structure.
📈 Market Structure & Price Behavior
The recent vertical rally has left the market overextended, making a corrective phase technically healthy.
Price has broken below short-term support and is now trading under a descending corrective trendline, signaling short-term bearish pressure.
This type of structure often develops when the market needs to clean buy-side positions before rebuilding for the next leg.
While the higher-timeframe trend remains bullish, the intraday bias has shifted to corrective / bearish until liquidity objectives are met.
🔍 Key Liquidity Zones on the Chart
Short-term sell zone: the descending trendline near current price As long as price reacts below this trendline, rallies are more likely to be sold.
Scalping buy liquidity: around 5050–5070 This area may generate temporary bounces, but reactions here should be treated as short-term only.
Key bullish order block: 4825 – 4830 A critical zone where stronger buyer participation may appear if the sell-off extends.
Major swing liquidity zone: 4613 – 4625 This is a high-confidence liquidity pocket where the market could complete a deeper correction and reset the broader bullish structure.
🎯 Trading Scenarios
Primary scenario – Continuation of the pullback: As long as price remains below the descending trendline, gold may continue to move lower to sweep liquidity below recent lows. This favors sell-on-rallies rather than buying strength.
Secondary scenario – Temporary reaction: Short-term bounces may occur around the 5050–5070 area, but without structural reclaim, these moves are more likely corrective than trend-changing.
Structural defense scenario: If price reaches the 4825–4830 or 4613–4625 zones, watch closely for signs of stabilization and absorption, which would signal that the liquidity objective has been completed.
🧠 Lana’s View
This move lower is best seen as liquidity cleanup, not panic selling. Lana stays patient during corrective phases, avoiding early longs and waiting for price to reach clear liquidity zones before reassessing bullish continuation.
✨ Let the market take what it needs, then look for structure to rebuild.

Bitcoin at Demand: Where Most Traders Panic and Smart Money WaitWhen I look at this chart, I don’t see weakness.
I see price reacting exactly where it should .
Bitcoin is sitting above a clearly defined demand zone, and instead of collapsing, price is slowing down and compressing.
That usually tells me the market is absorbing liquidity, not distributing .
Key things I’m focusing on:
Price is holding above ascending demand , which shows buyers are still defending structure.
Reactions from the demand zone are clean , not impulsive, a sign of controlled participation.
Overhead supply is present , which explains the compression instead of an instant breakout.
RSI bullish divergence adds confidence that downside momentum is weakening near demand.
My mindset here:
I’m not chasing moves.
I’m not panicking into demand.
I’m simply watching how price behaves here , because this zone decides whether the next move expands or fails.
As long as structure holds, patience matters more than prediction.
Disclaimer:
This analysis is for educational purposes only. Not financial advice. Always manage your risk.

Bitcoin Is Reacting, Not Breaking, Patience Before the Next MoveWhen I look at this chart, I don’t see panic or trend failure. I see price pulling back into a clearly defined demand area within a rising structure and responding from it. That matters. If sellers were truly in control, price wouldn’t pause here, it would slice through demand without hesitation. Instead, Bitcoin is holding above structure, absorbing selling pressure, and stabilising.
The repeated rejections from the upper supply zone show that resistance exists, but the key point is this: sellers are unable to push price into a breakdown. Momentum has cooled, volatility has compressed, and RSI has reset without price collapsing, all signs of balance, not weakness.
This phase feels slow and uncomfortable, especially for traders who expect constant movement, but historically this is where the market builds the base for its next decision. I’m not interested in chasing price near resistance, and I’m not interested in panic selling into demand. I want to observe how price behaves here, because reactions at structure tell the real story. As long as Bitcoin continues to respect this rising demand and doesn’t accept below it, the broader structure remains intact and upside expansion stays on the table. A clean break below structure would force me to rethink, until then, patience is the position. Sometimes the best trades don’t come from predicting the next candle. They come from waiting while price proves who is actually in control.
Disclaimer: This analysis is for educational purposes only and not financial advice. Always manage risk and trade according to your own plan.

BTC Compression Phase: Where Smart Money Builds Positions!Hey guy's, When I look at this chart, I’m not seeing fear or trend failure.
I’m seeing something far more important, controlled compression above demand .
Bitcoin has pulled back, swept liquidity, and is now holding above a clearly defined demand area while volatility keeps contracting.
This kind of behaviour rarely appears during panic.
It usually appears when the market is absorbing supply quietly .
What I’m seeing on the chart:
Price is still respecting the ascending demand structure , which tells me higher-timeframe buyers are active and defending key levels.
The recent move cleaned out weak hands below demand , but price did not accept lower, a classic liquidity sweep, not a breakdown.
Supply is visible above , which explains why price is compressing instead of expanding immediately. Sellers are present, but they are not overpowering buyers.
The range between ascending demand and overhead supply is tightening . This is where impatience builds, and where strong positioning usually happens.
The psychology part (this matters):
This phase feels uncomfortable.
Price isn’t doing much.
Both sides are frustrated.
And that’s usually a clue.
If Bitcoin wanted to break structure, it had a clean opportunity below demand.
It didn’t take it.
That tells me sellers are getting weaker, not stronger.
So my thinking stays simple:
I don’t want to chase upside after expansion.
I don’t want to panic into a sell-off that already swept liquidity.
I want to watch how price reacts around demand, because this is where real decisions are made.
As long as structure holds:
Pullbacks into the 88k–87k demand zone remain high-probability reaction areas.
Compression above demand keeps the door open for a mean-reversion move toward higher levels.
Only a clean breakdown and acceptance below ~84k would invalidate this structure.
Until then, I’m not trying to predict the next candle.
I’m trying to read behaviour .
Markets don’t move when everyone is excited.
They move when most people get bored, confused, or impatient.
Disclaimer:
This analysis is for educational purposes only. Not financial advice. Always manage risk and trade according to your own plan.

XAUUSD (H3) – Liam StrategyTrendline break confirms the uptrend ✅ | Buy the discount, scalp-sell at ATH
Quick overview
On the H3 chart, the story is clean: price has broken the bearish trendline and held structure after a clear BOS, which keeps the bias bullish for continuation.
But the best execution is still the same: no FOMO. I’d rather buy from discount liquidity zones than chase mid-range candles.
Key Levels (from your chart)
✅ Buy Zone 1 (re-buy): 4434 – 4437
✅ Buy Zone 2 (liquidity imbalance): 4340 – 4343 (deep sweep zone)
✅ ATH Sell scalping: 4560 (main profit-taking / reaction sell)
Technical read (Liam style)
Breaking through the trend confirms uptrend: the trendline break signals buyers are back in control.
4434–4437 is the clean re-entry area: a logical pullback zone with better R:R.
If volatility spikes and price hunts liquidity, 4340–4343 is the “best value” area to look for a strong reaction.
Trading scenarios
✅ Scenario A (priority): BUY the pullback at 4434–4437
Entry: 4434 – 4437
SL: below 4426 (or below the most recent H1/H3 swing low)
TP1: 4485 – 4500
TP2: 4560 (ATH – main target)
Logic: Uptrend confirmation is in place — I only want the pullback entry, not a chase.
✅ Scenario B (deep buy): If price sweeps down into 4340–4343
Entry: 4340 – 4343
SL: below 4330
TP: 4434 → 4500 → 4560
Logic: This is the “sweet spot” if the market does a liquidity reset before pushing higher again.
⚠️ Scenario C (scalp only): SELL reaction at ATH 4560
Entry: 4560 (only if we see clear rejection / weakness)
SL: above the sweep high
TP: 4520 → 4500 (quick scalp)
Note: This is a scalp idea at ATH — not a long-term bearish call while the bullish structure is intact.
Key notes
Avoid entries mid-range. Only execute at 4434–4437 or 4340–4343.
Wait for confirmation on M15–H1 (rejection / engulf / MSS).
Risk management: 1–2% per idea, scale out into ATH.
Are you waiting for the 4434 pullback buy, or hoping for a deeper sweep into 4340 for the cleanest entry? 👀

Why Gold Loves Trapping Both Buyers and Sellers!Hello Traders!
If you have traded Gold for some time, you’ve probably felt this frustration more than once. You take a clean buy, price stops you out and reverses. You flip to sell, and the same thing happens again. It starts feeling personal, like Gold is hunting you specifically.
The truth is, Gold doesn’t hate buyers or sellers.
Gold loves liquidity, and liquidity comes from trapped traders on both sides.
This is not manipulation in the emotional sense. This is how a highly liquid, institution-driven market functions.
Why Gold Rarely Moves in a Straight Line
Gold is one of the most actively traded instruments in the world. Because of this, it cannot afford to move cleanly for long. Straight moves don’t provide enough participation.
Clean trends attract late buyers at the worst possible prices
Obvious breakdowns invite emotional sellers too early
Both sides place stops at similar, predictable levels
Before Gold commits to direction, it usually clears both sides first.
How Buyers Get Trapped in Gold
Buy side traps often appear after a strong bullish candle or breakout. The structure looks convincing, momentum feels strong, and buyers feel safe.
Price breaks a visible resistance and attracts breakout buyers
Stops get placed just below the breakout level
Gold pulls back sharply to test liquidity below
Buyers aren’t wrong on direction.
They’re early, and early entries are expensive in Gold.
How Sellers Fall Into the Same Trap
Sell-side traps usually form after a sharp rejection or false breakdown. Fear builds quickly, and sellers assume the move is done.
Price dips below support and invites aggressive shorts
Stops cluster just above the rejected level
Gold spikes upward to clear those stops
Again, direction is not the issue.
Timing is.
Why Gold Needs Both Traps
Gold doesn’t choose a side until enough liquidity is collected. Buyers provide one side of liquidity. Sellers provide the other.
Trapped buyers fuel downside liquidity
Trapped sellers fuel upside liquidity
Only after both sides react does structure become clean
This is why Gold feels chaotic to emotional traders and logical to patient ones.
How This Changed My View on Gold
Once I understood that traps are part of the process, not mistakes, my trading became calmer.
I stopped reacting to the first breakout
I waited for both sides to show their hand
I focused more on reactions than predictions
Gold didn’t change.
My expectations did.
Rahul’s Tip
If Gold traps you once, learn from it.
If it traps you repeatedly, it’s not the market, it’s impatience. The real opportunity usually appears after frustration peaks on both sides.
Buyers get trapped.
Sellers get trapped.
Patient traders get paid.
If this post matches your Gold trading experience, drop a like or share your thoughts in the comments.
More real, experience-based lessons coming.

The Second Move Strategy in Gold – Why the First Spike Is a TrapHello Traders!
There is a moment in Gold trading that has trapped more traders than bad analysis ever did. It’s that sudden spike, fast, aggressive, and convincing, where everything on the chart screams this is the move. Your instincts tell you not to miss it. Your emotions tell you to act now. And that’s exactly why most traders lose money there.
Gold is not a market that rewards excitement. It rewards restraint. The first spike is rarely the opportunity, it is usually the test.
Why the First Spike Feels Impossible to Ignore
The first move in Gold often arrives with speed and confidence. Candles expand, momentum increases, and breakouts appear clean. This creates urgency, not clarity.
Fast candles trigger fear of missing out
Indicators flip direction almost instantly
Breakout traders pile in without confirmation
The move looks strong because it is designed to look strong.
Strength attracts participation, and participation creates liquidity.
What That First Spike Is Really Doing
In many cases, the first spike is not commitment, It is information gathering. Actually market is checking who is chasing, where stops are sitting, and how much emotional money is willing to enter without patience.
Early entries get trapped during shallow pullbacks
Stops cluster around obvious support or resistance
Traders confuse volatility with direction
This is where most losses begin, not from bad direction, but from bad timing.
Why the Second Move Is Where Professionals Act
After the initial spike, Gold usually pauses. It retraces, consolidates, or retests key levels. This is not weakness, this is clarity forming.
Liquidity from the first move gets absorbed
Weak hands exit under pressure
Structure becomes visible instead of emotional
The second move lacks drama, But it carries intent.
How This Changed My Gold Trading
Once I stopped chasing the first candle, my trading changed quietly but completely. I started letting price reveal itself instead of reacting to it.
I stopped entering during emotional expansion
I waited for retests and structural confirmation
I reduced position size until direction proved itself
Nothing fancy changed, Just patience, and patience did the heavy lifting.
Rahul’s Tip
If a Gold move makes you feel rushed, excited, or pressured, step back. That feeling is not intuition. It’s emotion. The best Gold trades usually feel boring at entry and obvious only in hindsight.
Final Thought
Gold doesn’t trap traders with complexity. It traps them with urgency. The first spike grabs attention. The second move offers opportunity. Learn to wait, and you stop trading reactions. You start trading structure.
If this post made you rethink how you enter Gold trades, drop a like or share your experience in the comments. More real trading lessons coming.

Bitcoin Is Quiet Again — That’s Usually When Big Moves BeginBitcoin spent multiple sessions moving sideways inside a clearly defined accumulation range.
This kind of price behavior usually signals one thing, strong hands are building positions while weak hands get shaken out.
Sideways markets are not random. They are preparation phases.
Price remained compressed inside the accumulation zone, showing balance between buyers and sellers with declining volatility.
The breakout candle was decisive and impulsive, indicating acceptance above the range rather than a fake move.
After breakout, price pulled back into the prior range high, which is a classic bullish retest behavior.
As long as price holds above the breakout base, the structure favors continuation toward the expansion zone marked on the chart.
A failure back inside the range, would invalidate the breakout and shift momentum back to neutral.
If this helped you read price better, like, follow, or comment, more clean structure studies coming.
⚠️ DISCLAIMER: This analysis is for educational purposes only and is not financial advice. Markets involve risk. Always manage your position size and do your own analysis.

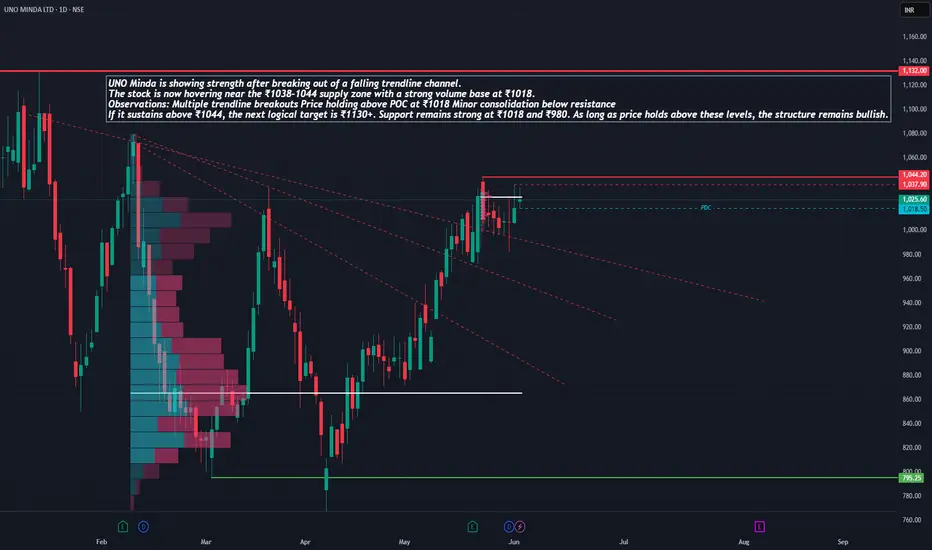
UNO MINDA – Ready to Revisit All-Time Highs?UNO Minda is showing strength after breaking out of a falling trendline channel. The stock is now hovering near the ₹1038–1044 supply zone with a strong volume base at ₹1018.
Observations:
Multiple trendline breakouts
Price holding above POC at ₹1018
Minor consolidation below resistance
If it sustains above ₹1044, the next logical target is ₹1130+. Support remains strong at ₹1018 and ₹980. As long as price holds above these levels, the structure remains bullish.
Like, comment your thoughts, and share this post
Explore more stock ideas on the right hand side your feedback means a lot to me!
Disclaimer: This post is for educational purposes only and should not be considered a buy/sell recommendation.
EUR/USD – Accumulation After Sell-Off, Structure-Based Long IdeaEUR/USD has seen a strong sell-off, followed by a sharp reaction from a well-defined support zone. This area has already proven its strength by absorbing selling pressure and pushing price higher.
After the bounce, price is now consolidating near support instead of breaking down further, indicating potential accumulation at these levels.
What Price Is Telling Us: Price is holding above the support zone with multiple rejections and overlapping candles, showing a clear loss of bearish momentum. Sellers are failing to push price lower despite earlier strength.
This type of behavior often appears before a corrective move or continuation higher, especially after an impulsive decline.
If this analysis helped you, like, follow, and comment for more clean Forex breakdowns.
Disclaimer: This analysis is for educational purposes only and does not constitute financial advice. Trading involves risk, and past performance does not guarantee future results. Please manage risk responsibly.

BTC Technical Outlook – Cycle High WatchBitcoin is potentially entering the final push of the current cycle, with price action forming a Head & Shoulders (H&S) structure near the newly formed ATH. While this pattern is not confirmed yet, it does raise caution for a possible local top.
📈 Upside Scenario:
Our immediate focus remains on the $111,000 zone, which aligns with a potential liquidity grab area. A push into this region followed by strong rejection would strengthen the bearish case.
📉 Risk Zone to Monitor:
If rejection occurs near $111K, attention will shift to the neckline area, which will be crucial in confirming the H&S breakdown.
⚠️ Key Takeaway:
Bullish continuation remains valid until rejection is confirmed
$111K = key upside target & decision zone
Neckline break would confirm trend exhaustion
_Wait for confirmation. Trade the reaction, not the prediction._

Why Gold Spikes Right When Everyone Gives Up!Hello Traders!
Over the years, one thing I’ve noticed again and again is this, gold rarely moves when everyone is confident about it.
In fact, the strongest gold spikes I’ve seen came at moments when traders were tired, bored, and emotionally done with gold.
No excitement, no news, no hype. just silence and frustration. That is usually when gold decides to move. This post is about that exact moment most people miss.
1. The Phase Where Traders Emotionally Disconnect
After a long consolidation or slow decline, gold starts testing patience more than levels.
Daily candles become small, nothing seems to work, and traders slowly stop caring.
People say things like “gold is not moving” or “nothing is happening here” and shift their attention elsewhere.
I’ve personally learned to be very alert during this phase.
When traders disconnect emotionally, the market often prepares its next move.
2. Giving Up Is Not Random, It Is a Signal
When traders finally give up, they close positions without a plan, just to feel relief.
This creates a wave of selling from weak hands.
That selling provides clean liquidity for stronger participants to step in quietly.
Gold does not spike because something suddenly improves.
It spikes because selling pressure gets exhausted.
3. Why Gold Loves Emotional Extremes
Gold is not driven only by fundamentals, it is heavily driven by emotion and sentiment.
Fear pushes people into gold, boredom pushes them out.
When boredom and frustration peak, price often stops falling even though sentiment stays negative.
Whenever I see gold refusing to go lower despite bad sentiment,
I know the story is changing under the surface.
4. What Retail Traders Usually Do at This Point
Most retail traders stop watching gold charts completely.
They move to faster markets or trending assets.
They tell themselves they will come back “once gold starts moving again”.
Ironically, by the time gold starts moving, it is already far from the level where patience was required.
5. How I Personally Read These Gold Spikes
I focus more on behavior than prediction.
I look for long periods where price goes nowhere but also refuses to break down.
I pay close attention when volatility compresses and volume dries up.
When price holds steady while emotions collapse,
I don’t rush, I observe.
That calm observation has helped me catch moves that looked sudden to everyone else.
6. The Spike Feels Sudden Only If You Were Not Prepared
By the time gold spikes, accumulation is usually already complete.
To emotional traders, the move feels random and unfair.
To prepared traders, it feels logical and almost expected.
Big moves never announce themselves loudly.
They quietly prepare while most people lose interest.
Rahul’s Tip
Whenever I feel bored or frustrated watching gold, I pause instead of walking away.
That emotional discomfort is often a signal, not a problem.
If you can stay present when others disconnect, you automatically gain an edge.
Conclusion
Gold rarely spikes when belief is strong. It spikes when patience is gone and hope feels weak.
If you understand this emotional timing, you stop chasing gold and start positioning before it moves.
If this post felt relatable, like it, share your experience in the comments, and follow for more market psychology insights.

Gold After Liquidity Grab: Short side intraday move, R you readyHello Everyone, let's analyse Gold as this once again tested a major resistance zone, but instead of giving a clean breakout, price briefly moved above the level and then quickly reversed. This move was not strength, it was a liquidity grab.
In simple words, smart money pushed price above resistance to trap breakout buyers, collect their stop-loss liquidity, and then bring price back into the range. This is why price failed to hold above the highs and started showing weakness soon after.
Right now, Gold is trading back below resistance, which keeps the short term bias cautious to bearish. If selling pressure continues, price may slowly rotate toward the lower support / demand zone, where buyers could appear again.
This chart is a good reminder that not every breakout is real. Waiting for confirmation always matters more than speed.
Disclaimer: This analysis is for educational purposes only and should not be taken as financial advice. Please do your own research or consult your financial advisor before investing.
Analysis By @TraderRahulPal | More analysis & educational content on my profile.
If this helped you understand price behavior better, like, follow, and share your view in comments.

How Market Makers Trap Retail Traders & How to Avoid It?Hello Traders!
Have you ever taken a perfect-looking trade, only to see price hit your stop loss and then move exactly in your direction?
You felt unlucky.
You blamed manipulation.
You thought the market was against you.
But here’s the uncomfortable truth.
Most retail traders don’t lose because their setup is bad.
They lose because they don’t understand how market makers operate.
Once you understand how traps are created, your entire way of reading charts changes.
Who Are Market Makers (In Simple Words)?
Market makers are not sitting there to hunt you personally.
Their job is to provide liquidity and execute large orders.
To do that, they need one thing from the market.
Orders.
Stop losses, breakout entries, panic exits, all of these are liquidity.
Common Ways Retail Traders Get Trapped
False Breakouts
Price breaks an obvious high or low.
Retail traders jump in expecting a strong move.
Within a few candles, price reverses sharply and traps them.
Stop-Loss Hunts
Price suddenly spikes just enough to take out stop losses placed below support or above resistance.
Once liquidity is collected, price moves in the opposite direction.
Emotional Candles
Big red or green candles appear after news or during high volatility.
Retail reacts emotionally.
Market makers use this emotion to fill positions.
Choppy Ranges
Price keeps moving up and down inside a range, stopping out both buyers and sellers.
Retail overtrades.
Smart money accumulates quietly.
If this feels familiar, don’t worry.
Almost every trader learns this the hard way.
Why Retail Traders Fall Into These Traps
They chase obvious levels that everyone can see.
They place predictable stop losses at exact highs and lows.
They trade based on excitement instead of structure.
They react instead of waiting for confirmation.
Market makers don’t need to predict the future.
They simply exploit predictable behavior.
How I Avoid Market Maker Traps
This part changed my trading completely.
I Stop Chasing Breakouts
If a level looks too obvious, I wait.
Real moves usually come after trapping traders, not before.
I Wait for Confirmation
I look for price to break a level and then fail.
False moves often reveal real direction.
I Respect Liquidity Zones
Highs, lows, equal highs, equal lows, these are liquidity pools.
I expect reactions there, not blind continuation.
I Trade With Calm, Not Urgency
When I feel FOMO, I know I’m late.
Good trades never force you emotionally.
Trading became much easier once I stopped trying to be right and started trying to be patient.
The Biggest Mindset Shift
The market’s job is not to be fair.
Your job is not to be emotional.
Once you accept this, traps stop hurting you.
Sometimes you even start using them to your advantage.
Rahul’s Tip
If price does something that feels “too obvious,” pause.
Ask yourself one question
“Who benefits if retail enters here?”
That single question has saved me from many bad trades.
Conclusion
Market maker traps are not a conspiracy.
They are a result of human psychology and predictable behavior.
When you stop reacting and start observing,
the market stops feeling random and starts making sense.
If this post helped you see traps differently, like it, share your thoughts in the comments, and follow for more real-world trading psychology content.
Why Bitcoin Hits Your Stop Loss Before the Real MoveWhy Bitcoin Hits Your Stop Loss Before the Real Move
Have you ever placed a Bitcoin trade and noticed this? 🤔
Your stop loss 😭💸 gets hit… just a few pips from your entry… then the price suddenly rockets 🚀💎 in the direction you were expecting!
This is not bad luck. It’s a Stop Loss Hunt 💥, used by smart money 🏦💰 to collect liquidity before the real trend begins.
1️⃣ Liquidity Pools Above Highs & Below Lows 📊💎
Retail traders place stop losses at obvious highs/lows 📈📉
These stops create liquidity zones 💧, which smart money targets 🔍
Price moves to these zones to collect liquidity → fuels the next trend 🚀
Example:
BTC trending upward 📈
Traders place buy stops above the previous high ⬆️
Smart money pushes price to trigger stops 💥 → collects liquidity 💎 → then moves the price in the real trend direction 🚀
2️⃣ Stop Loss Sweep 💥⚡
Price triggers retail stop losses 🛑
Retail traders get stopped out 😭💸
Institutions enter large positions with minimal resistance 💹
Key Insight:
Price needs liquidity 💧 to move strongly.
Without collecting stops, smart money cannot drive momentum efficiently ⚡
3️⃣ Fake Breakouts & Wicks 🌪️🔥
Watch for wick spikes or sudden breakouts 🕵️♂️
These are stop loss hunts
Many traders panic 😱 and exit positions
Smart money uses this to trap retail traders and continue the trend 🚀
4️⃣ The Real Move Begins 🚀🔥
After liquidity is collected 💎💧
The true trend resumes 📈
Traders who waited can enter safely 🧘♂️💹
Often, the move is stronger and faster ⚡ because institutions now control the market
5️⃣ Market Psychology Behind Stop Hunts 🧠💭
Retail traders panic when stops are triggered 😅💸
Fear is used to manipulate sentiment 🧲
Recognizing this psychological trap helps you stay calm 🧘♂️ and trade strategically 🏆
6️⃣ How to Trade Stop Loss Hunts 💡🧠
✅ Avoid stops at obvious highs/lows 🚫
✅ Wait for liquidity sweep ⏳💧
✅ Watch for wick spikes 🌟 — early signs of stop hunts
✅ Follow market structure 📊 (BOS/CHoCH)
✅ Trade after confirmation ⏱️
✅ Patience + discipline = profits 💎💹
7️⃣ Examples in Bitcoin Trading 🔍
Double top wicks above high → triggers stops 💥 → continues trend 🚀
Price dips below support → triggers stops 😭 → rebounds ⬆️
💡 Observation: Every wick tells a story 🌟 — learn to read it!
💬 Key Takeaways
Stop Loss Hunts = institutional footprints 👣
Price hunts liquidity 💧 — that’s why your SL is hit 💥
Understanding this helps you:
Trade smarter 💎
Avoid losses 😅💸
Spot trends before they happen 🚀

Why Gold Hits Your SL🌟 Why Gold Hits Your SL 😭💛📈
Gold is one of the most aggressive and volatile assets in the market — and if you’ve ever wondered “Why does gold ALWAYS hit my stop-loss before moving in my direction?”, this post explains the real reason.
Let’s break it down clearly 👇
🔶 1. Gold Loves Liquidity — Not Levels 💦💰
Gold doesn’t move based on your support/resistance lines.
It moves based on liquidity, meaning:
Where traders place stop-losses ❌
Where pending orders sit 🎯
Where large institutions want to fill positions 🏦
Your SL is simply sitting where everyone else puts theirs, which makes it prime liquidity.
🔶 2. XAUUSD Spikes Are Designed to Collect Orders ⚡💥
Gold often creates sudden:
Wicks
Fake breakouts
Quick pumps or dumps
Sharp candle spikes
These moves are NOT random — they’re engineered to:
🔸 Trigger stop-losses
🔸 Activate pending buy/sell orders
🔸 Grab liquidity before the real move
This is why your SL gets hit by $1–$3 before price completely reverses.
🔶 3. Gold Moves Session-by-Session 🕒🌍
Gold behaves differently depending on the time of day:
Asia session → Slow, tight range
London session → First big manipulation
New York session → Volatility explosion + real direction
Most SL hunts take place when London opens or when NY session begins ⚠️🔥
🔶 4. Clean Highs & Lows = SL Magnets 🧲📌
Gold LOVES attacking:
Previous day’s high/low
Asian range high/low
London session extremes
Double tops & bottoms
Round numbers (like 4000 / 4050 / 4100)
These areas hold thousands of stop-losses.
So before gold takes a real direction — it sweeps them first. 🏹😈
🔶 5. The Classic Gold Pattern: Trap → Reversal → Expansion 🔁🚀
Most XAUUSD moves follow this sequence:
1️⃣ Sweep liquidity 😭
2️⃣ Fake breakout 😈
3️⃣ Sharp rejection 👋
4️⃣ Real trend begins 🚀
If you’ve ever seen price:
Break a level
Wick hard
Then reverse the entire move
That’s gold performing a liquidity grab.
🔶 6. How To Avoid Getting Stopped Out ✔️
Here’s what actually helps:
🌟 A. Don’t put SL exactly at obvious levels
Move it beyond common liquidity zones.
🌟 B. Wait for the sweep before entering
Let gold perform the trap first.
🌟 C. Trade reaction — not prediction
Look for re-entry after the wick forms.
🌟 D. Use sessions to your advantage
Avoid placing SL right before London/NY opens.
🌟 Final Words
Gold isn’t hunting you —
it’s hunting liquidity.
Your job is simple:
👉 Stop placing stops where everyone else does
👉 Let gold sweep liquidity first
👉 Then catch the real move
Trade smarter, not tighter. 💛⚡

Smart Money Liquidity Trap Explained⭐ Smart Money Liquidity Trap Explained
✨ A deep dive into how institutions manipulate price before major moves ✨
In every financial market — Forex, Crypto, Stocks, Indices — price doesn’t simply move at random. Behind the scenes, Smart Money (institutions, banks, hedge funds) engineer setups that allow them to enter positions at the best possible price. One of their most effective tools is the Liquidity Trap.
Let’s break it down beautifully and clearly. 👇
🔥 What Is a Liquidity Trap?
A Liquidity Trap occurs when Smart Money deliberately pushes price into areas loaded with:
❌ Stop-loss orders
📉 Sell-side liquidity
📈 Buy-side liquidity
😰 Emotional retail entries
🔥 Breakout traders placing pending orders
These areas become liquidity pools — perfect fuel for institutions to fill their massive positions.
Retail traders think it’s a breakout…
But Smart Money thinks:
➡️ "Thank you for the liquidity."
🧩 How Smart Money Creates the Trap
1️⃣ Phase 1: Build the Setup
Smart Money guides price slowly toward an obvious level:
A clean high
A clean low
A trendline
A double top/bottom
Retail traders get excited:
📢 “Breakout coming!”
But institutions are simply gathering attention.
2️⃣ Phase 2: The Liquidity Grab ⚡
Price spikes violently above/below the obvious level.
This move triggers:
🟥 Stop-loss hunts
📉 Forced liquidations
💥 Breakouts that fail instantly
This sudden spike gives institutions the liquidity needed to place large buy or sell orders without causing massive slippage.
This is why the spike is often fast and dramatic.
3️⃣ Phase 3: The Real Move Begins 🚀
After the liquidity is collected, price reverses sharply.
This is the moment Smart Money actually commits to the real direction.
Retail traders feel:
🤯 “Why did it reverse?!”
😭 “I got stopped out for nothing!”
😵 “The breakout was fake!”
But Smart Money simply executed their strategy perfectly.
🎯 How to Use Liquidity Traps in Your Trading
Study where retail traders commonly place:
⛔ Stops
📌 Breakout orders
❗ Predictable entries
Then wait for the fast liquidity grab followed by:
A displacement 🎇
A sharp wick rejection
A structure shift (CHoCH / BOS)
These signals often reveal the true direction of the upcoming move.
💡 Key Features of a Smart Money Liquidity Trap
✨ Sudden spike into obvious areas
✨ Fast liquidation and stop-hunting behavior
✨ Sharp wick rejections
✨ Structure shift after the spike
✨ Smooth continuation in the real direction
🚀 Why This Concept Is So Powerful
Recognizing liquidity traps allows you to:
❌ Avoid fake breakouts
🛡️ Protect yourself from stop-hunts
🎯 Enter the market at premium/discount levels
🤝 Align with Smart Money
💼 Improve long-term consistency
This is how professional traders stay on the right side of volatility — by understanding why the market moves, not just where it moves.

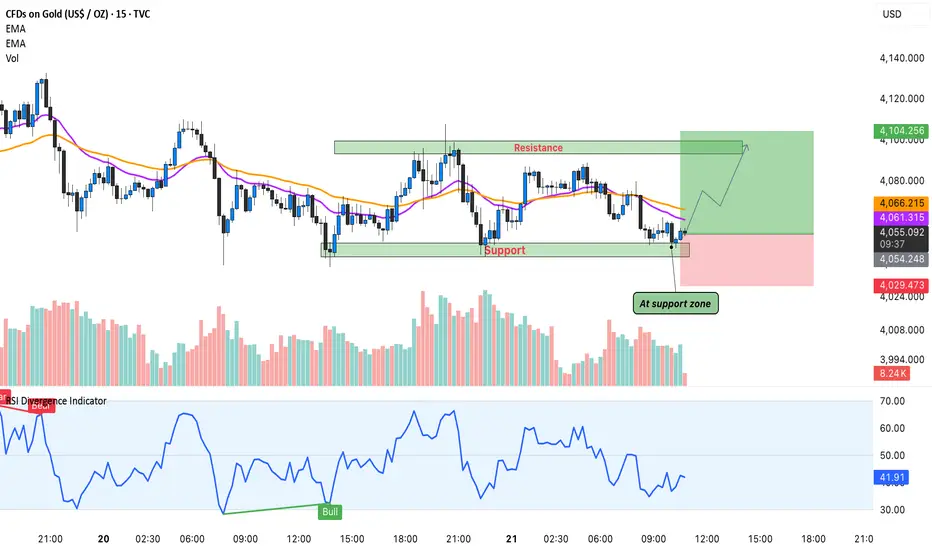
Gold’s Intraday Reversal – Buyers Stepping In!Hello Guy's Let's analyse Gold and it is once again respected the intraday support zone highlighted on the chart. This level has acted as a strong demand area multiple times, and today price reacted from the same zone with clear bullish intent.
Price is also sitting above EMA 20 & EMA 50, and the RSI bullish divergence confirms that momentum could be shifting back toward the upside.
If buyers hold this support, we can see a short-term push toward the 4,090–4,105 resistance region. A clean breakout above that may open more upside, but for now the focus remains on this bounce setup.
This is not breakout trading, this is simply reacting to a level where buyers have shown strength many times.
As long as this support holds, the risk-reward favors the bullish side.
Analysis By @TraderRahulPal | More analysis & educational content on my profile.
Mazdock : A Sleeping Giant Mazgaon Dock broke out of a very strong resistance after forming a base to form new life time high
Post that if you notice
1) volumes dropped
2) Price has fallen
3) There is an obvious invalidation of the breakout which took it to life time high
4) Classic Smart Money Liquidity Sweep
It has posted a healthy set of results in the last quarter and with defense spending ramping up this stock is going to perform extremely well.
It can 2X from here in a reasonably good amount of time.
Watch for a high volume Marubozu on the chart, any time now!

The Herd Mentality – Why Everyone Buys When It’s Too Late?Hello Traders!
You’ve seen it a hundred times, the market rallies, social media explodes, and suddenly everyone starts buying.
Then, just when retail traders feel “safe” entering, the price crashes.
It’s not bad luck, it’s herd mentality .
And unless you understand how it works, you’ll keep following the crowd straight into losses.
1. What is Herd Mentality in Trading?
Herd mentality is the instinct to do what everyone else is doing, buying when others buy, selling when others sell.
It’s rooted in human psychology, our brains feel safer when we’re part of a group.
In trading, this instinct is deadly because the crowd always reacts late.
When you feel comfortable entering a trade, it’s usually because the market has already moved.
2. The Cycle of Fear and Greed
Every bull run begins with a few smart traders who buy quietly when no one’s interested.
As prices rise, social media hype builds, the crowd starts joining in.
Then, when “everyone” is talking about the coin, smart money exits, leaving the herd trapped at the top.
The same happens in bear markets, panic selling at bottoms while professionals buy patiently.
It’s not about intelligence, it’s about emotion.
3. How the Market Exploits the Crowd
Institutions and big traders understand herd behavior better than anyone.
They create liquidity by pushing prices to levels where retail traders feel emotionally forced to act.
The market uses human nature, fear and greed, as its fuel.
The crowd provides the liquidity, and professionals use that liquidity to enter or exit quietly.
4. How to Avoid Becoming Part of the Herd
Develop your own plan, if your entry depends on others’ excitement, it’s not your setup.
Buy when the market feels uncomfortable; sell when everyone feels confident.
Learn to think independently. The best trades usually feel the hardest to take.
Patience and conviction are your weapons against the herd.
5. The Truth Most Traders Don’t Want to Hear
If you wait for social proof to feel confident, you’ll always be late.
By the time the crowd “believes,” the move is already priced in.
You don’t get rich by following others, you get rich by understanding why others behave the way they do.
Rahul’s Tip:
The market doesn’t punish retail traders because they lack knowledge, it punishes them because they act emotionally together.
Train your mind to do what’s uncomfortable, not what’s popular. That’s where the profit hides.
Conclusion:
The herd mentality is the silent killer of most portfolios.
The more people talk about an asset, the less opportunity it holds.
Smart traders buy silence and sell noise.
Once you learn to think independently, you’ll stop being the liquidity, and start trading like the ones who create it.
If this post opened your eyes to herd psychology, like it, share your view in comments, and follow for more deep market insights!
Order Blocks Simplified — How Institutions Control Price🔥 Order Blocks Simplified — How Institutions Control Price
Order Blocks are one of the most important concepts in modern trading — because they show where institutions place REAL positions, not where retail traders guess. 🏦📊
When you understand Order Blocks, you stop chasing random candles and start reading the footprints of smart money. Let’s simplify it. 👇✨
📌 What Is an Order Block? 🧱💰
An Order Block (OB) is a price zone where big institutions (banks, hedge funds, market makers) place massive orders.
These zones often appear before strong market moves — because that’s where smart money builds positions.
Think of an Order Block as:
🔹 The origin of a powerful move
🔹 A zone where price reacts repeatedly
🔹 A region that creates imbalance and momentum
🔹 A point where institutional orders remain unfilled
Once price returns to that zone, institutions fill the rest of their orders, causing another strong reaction. ⚡📈📉
📌 Why Do Order Blocks Matter? 🧠🔥
Because institutions control 80%+ of market volume — not retail.
So when they accumulate or distribute positions:
📈 Trends are born
📉 Reversals appear
🌊 Momentum shifts
💥 Big candles print
Order Blocks give you insight into:
✔️ Where big players enter
✔️ Where real support/resistance exists
✔️ Why price reverses at specific zones
✔️ Where high-probability trades form
It’s the closest thing to tracking the “big money blueprint.”
📌 How Order Blocks Form 🛠️📊
Order Blocks are created during periods of:
🔸 Accumulation (smart money buys quietly)
🔸 Distribution (smart money sells quietly)
Then price explodes away from that zone, showing that a major order cluster was executed.
This explosive move creates:
🔥 Imbalance (FVG)
🔥 Break of structure (BOS)
🔥 A directional trend
These are all signs of institutional activity.
📌 Types of Order Blocks 🟥🟩
🟥 Bearish Order Block (B-OB)
The last bullish candle before a strong bearish move.
It marks institutional selling.
🟩 Bullish Order Block (B-OB)
The last bearish candle before a strong bullish move.
It marks institutional buying.
Both act as high-probability reaction zones.
📌 How Institutions Use Order Blocks 🎯🏦
Institutions don’t enter all at once — their orders are too large.
So they:
1️⃣ Place part of their order
2️⃣ Push price away
3️⃣ Wait for retracement
4️⃣ Fill the rest at the same zone
That zone = the Order Block.
Price returning to an OB is not random — it’s smart money completing their business. 💼✨
📌 How You Trade Order Blocks 🧘♂️📈
✔️ Identify the strong move
Big displacement = institutional interest. 🚀
✔️ Mark the Order Block candle
The last opposite candle before the move. 🔍
✔️ Wait for price to return
Smart money loves to rebalance orders. 🔁
✔️ Enter with confirmation
Candles + structure + reaction = high probability. 🎯
Order Blocks are not predictions — they are reaction zones with a smart-money edge.
📌 Why Order Blocks Work So Well 🌟
Because they are built on:
💧 Liquidity
🧠 Smart Money Behavior
📊 Market Structure
⚡ Supply & Demand
🔥 Institutional Order Flow
This is why OBs outperform classic support/resistance.
They show institutional reality, not retail imagination.
✨ Final Thoughts: The Power of Order Blocks 🚀
Once you learn Order Blocks, everything becomes clearer:
✔️ You know where big money enters
✔️ You know where to wait for price
✔️ You stop chasing bad trades
✔️ You trade WITH smart money
✔️ You catch cleaner, stronger moves
Order Blocks are the foundation of modern price action — simple, powerful, and deeply effective. 🔥📈