BITCOIN TECHNICAL ANALYSIS ( 18th Oct 2023 )Price Analysis
Current Price: $28739.02
24-Hour Change: 1.88%
Circulation Supply: 19.52M
Trend Analysis
Technical Indicator : Strong Buy (On Daily Basis)
Moving Average : Strong Buy (On Daily Basis)
Overall Trend : Strong Buy (On Daily Basis)
Key Support and Resistance Levels:
Support Level 1: 28125.4
Support Level 2: 27850.3
Resistance Level 1: 28639.0
Resistance Level 2: 23378.7
Moving Averages:
50-Day Simple Moving Average (SMA): 26790.70 ( Buy)
200-Day Simple Moving Average (SMA): 27772.0 ( Buy )
Relative Strength Index (RSI)
Current RSI: 67.237
RSI Interpretation: Buy Zone
Volume Analysis
Trading Volume: $14,616,751,761
Volume Trends: Increasing in Nature
Candlestick Patterns
BULLISH DOJI STAR : Bullish Reversal ( Indication ), Medium ( Reliabilty ), During a downtrend, the market strengthens the bears with a long black candlestick and gaps open on the second one. However, the second candlestick trades within a small range and closes at or near its open. This scenario generally shows the potential for a rally, as many positions have been changed. Confirmation of the trend reversal would be a higher open on the next candlestick ( Description ).
HANGING MAN : Bearish Revesal ( Indication ), Low ( Reliabilty ),
During an uptrend, there is a sharp sell off after a gap to the upside. However, the candlestick closes at or near its high. This signifies the potential for further sell-offs. Since the certainty for a Hanging Man indicator is low, the trend reversal can be confirmed by a black candlestick or a large down gap on the next candlestick accompanied by a lower close ( Description ).
Conclusion
The live price of Bitcoin is $ 28,739.15 per (BTC / USD) with a current market cap of $ 560.90B USD. 24-hour trading volume is $ 14.61B USD. BTC to USD price is updated in real-time. Bitcoin is +1.83% in the last 24 hours with a circulating supply of 19.52M.
It's essential to exercise caution and apply risk management strategies in your trading decisions.
Smartmoney

Gold sell after right shoulder formGold is about to form head and shoulder pattern so all buyers will came
Firstly they trap sellers who enter at breakdown after breakdown it rally and make head and shoulder otherwise they trap her nor they trap head and shoulder buyers

GSFC Lamba Race Ka GhodaGSFC the moves are impulsive we have first 9 Waves up it could further subdivide in 13 waves will have to wait but any pullback to 155-147 will be good add zone for long term investment.
I am not a SEBI Registered Analyst please consult your advisor before investing charts shared for education purpose only.

USD/CAD BREAKDOWN As Per Smart Money Concepts ..
Usd/cad Currency Pair Its Important Support Zone And Sustain Below .
We Can See Good Down Movement In This pair..
Stop loss Also Mention In Chart.
Disclaimer:- This Post Is Only Educational Purpose . Trade With Your Risk Management.

NIFTY 17000 mark ,coming soon !!As we can see, in the past NIFTY has taken support from that same Ascending Trend Line multiple times,
taking support and moving up at least 10%, we can see that from S1, S2, and S3.
The Risk is minimum.
Stop loss(below Trend Line{TL}- a strong close of candle below TD) and the reward is 17000 mark.
Our key principles:-
> We will only enter a trade when we are 100 % confident.
> We will only enter those set-ups where risk is very low.
> We will wait patiently for the price to come under our radar, until then we will just wait and watch.

DRREDDY short tradeDRREDDY showing weakness after taking out short side stoploss so looking to short around 4518. Looking forward expecting price moving down towards 4444 and 4380 with trade invalidation on close above 4565. Bear put spread is my preferred way to enter short as the overnight risk is defined.

unichem labs expecting big moveThis stock has failed to make new lower low waiting for trend change and look for trade


EURUSD 4H analysisEURUSD 4H analysis
EURUSD is Bullish on 4h
price respecting recent Demand zone
you can look for longs on small timeframe

EURUSD D1 analysisEURUSD D1 analysis
EURUSD is Bullish on Daily Timeframe
you can look for longs on smaller timeframe

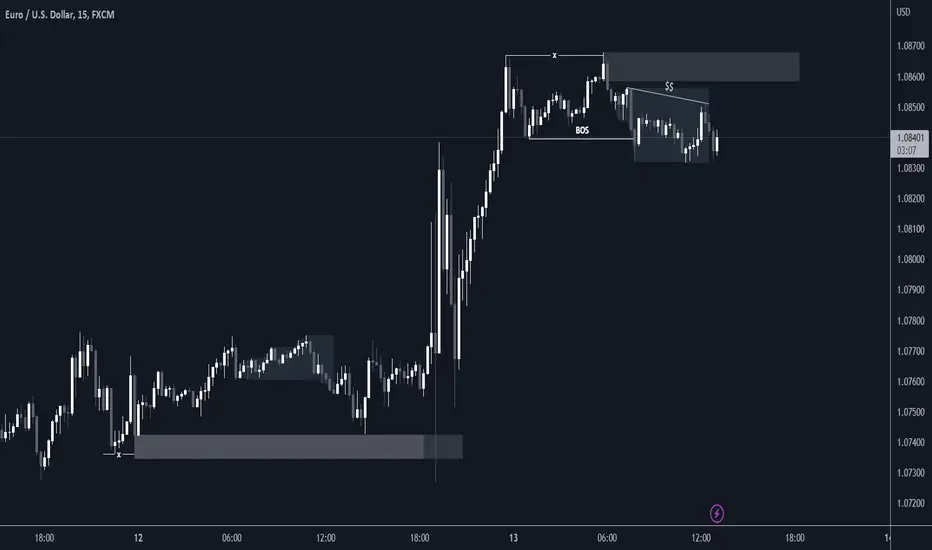

EURUSD Observation: -
In the chart, we can see recent low is broken. so, it is the change of character on 1HR chart.
Probability: -
We can think that there's probability of the price is going to meet its 4-hour POI. so, we can enter in the short position after touching poi of 1hr in 5 min chart with change of character with the target of 1.05640 and we can set target for partial profit booking to its recent low (which is made after the Choch in 1 hr chart).
Need help: -
suggest a good broker to trade forex in India.
Thanks!!!


EURUSD 4H analysisEURUSD 4H analysis
4H is bullish but tapping into previous daily supply, might see a pullback from supply


EURUSD 4H analysis for upcoming weekEURUSD 4H analysis for the upcoming week
Price is stuck in 4H range but its bullish


EURUSD weekly analysisEURUSD weekly analysis
Price tapping into monthly supply, still I think the price will sweep liquidity as marked

gj analysis monday hey guys ready for GJ on monday here we go with a supply based on
momemtum and high volume profile
as i always say that enter on LTF Confirmations
