How to Trade News Events Without Getting Stopped Out!Hello Traders!
We’ve all been there—price spikes wildly during a news event, and before you know it, your stop-loss gets hit! Trading during high-impact news releases can be risky, but if done right, it can also present huge opportunities! Today, let's explore how to trade news events smartly without getting stopped out!
1. Why Do Markets React So Violently to News?
Liquidity Drops: When news hits, market makers pull orders, leading to sharp price swings.
Algorithmic Trading Kicks In: High-frequency trading (HFT) bots react within milliseconds, pushing price up and down quickly.
Stop-Loss Hunts: Big players often trigger retail traders’ stops before taking the real move in their direction.
Emotions Run High: Fear and greed cause overreactions, making the first move after news unreliable.
2. How to Avoid Getting Stopped Out?
Use a Wider Stop-Loss: During news events, spreads widen and price fluctuates rapidly. A tight stop-loss is an easy target!
Wait for the First Move to Fade: The first price movement after news is usually a liquidity grab —don’t chase it!
Check the Spread Before Entering: Brokers increase spreads during high-impact events. If spreads are too wide, wait!
Trade the Retest, Not the Initial Spike: After the first reaction, price often retests key levels before the actual move.
Use Pending Orders Strategically: Instead of market execution, place limit orders near support/resistance levels.
Monitor Market Sentiment: News impact isn’t just about the numbers—it’s about how traders interpret them.
3. Best Trading Strategies for News Events
The Straddle Strategy: Place buy-stop and sell-stop orders above and below key levels. When price breaks out, one order gets triggered. Cancel the other order immediately.
The Retest Entry: Let price spike, wait for a pullback to a strong support/resistance level, and enter the trade with confirmation.
The Fading Strategy: If price spikes too much in one direction, look for signs of exhaustion and trade in the opposite direction.
Avoid Trading Right at the News Release: Instead, wait for 5-10 minutes for market noise to settle.
Use Economic Calendars: Always know when news is coming! Sites like Forex Factory, Investing.com, and TradingView provide schedules of upcoming events.
4. Risk Management During News Trading
Trade Small Positions: News events are risky— reduce your lot size to manage volatility.
Use a Trailing Stop-Loss: This allows your trade to capture big moves while locking in profits.
Avoid Holding Overnight Before Major News: Gaps in price can wipe out stop-losses before the market even opens!
Watch for Fake Breakouts: Price might break a level, trap traders, and then reverse. Wait for confirmation before entering.
Conclusion
Trading news events can be highly profitable if you manage risk properly and don’t chase price movements! Instead of getting stopped out, use wider stops, enter after the first move settles, and follow a structured plan.
How do you trade news events? Share your experience in the comments!
Smartmoney

Nicholas Darvas: The Dancer Who Became a Trading Legend!Hello Traders! Imagine going from being a professional dancer to one of the most successful traders of all time! That’s the story of Nicholas Darvas , a self-taught trader who turned $25,000 into $2.25 million in just a few years using his famous Darvas Box Trading Strategy . His journey proves that you don’t need to be a Wall Street expert to make it big in trading! Let’s dive into his trading principles and strategy.
1. Who Was Nicholas Darvas?
Darvas was a professional dancer who stumbled into the stock market while touring the world.
He developed a technical approach to trading , known as the Darvas Box Theory , which helped him ride strong trends and avoid noise.
Without any insider knowledge, he used chart patterns, price momentum, and volume breakouts to make millions in the market.
2. Darvas’ Key Trading Principles
Follow the Trend: Darvas only bought stocks in strong uptrends. He believed in riding momentum rather than predicting reversals.
Ignore Market Noise: He didn’t listen to news, tips, or opinions —only price action and volume mattered to him.
Let Winners Run, Cut Losers Quickly: He never sold his winning stocks early and immediately exited losing trades without hesitation.
Use Stop-Losses & Protect Capital: Darvas always set stop-losses below key levels to avoid deep losses.
Only Trade High-Volume Stocks: He focused on stocks that showed strong volume spikes, as these indicated institutional interest.
3. The Darvas Box Trading Strategy
Identify a Stock in a Strong Uptrend: Darvas looked for stocks that were consistently making new highs with rising volume.
Draw a "Box": He identified support and resistance levels , creating a box around price action.
Buy on Breakout: He entered only when price broke above the box’s resistance level, signaling a continuation of the uptrend.
Set a Stop-Loss: His stop-loss was placed just below the support level of the box.
Sell When the Trend Weakens: If price broke below the lower boundary of the box, he exited immediately.
4. What Traders Can Learn from Darvas
Price Action is King: You don’t need complex indicators— price and volume are enough.
Stick to Strong Stocks: Focus on high-momentum stocks rather than chasing random trades.
Discipline Beats Emotion: Trade with a clear system , don’t rely on market opinions.
Have a Risk Management Plan: Always use stop-losses and protect your capital.
Trend Trading Works: The best profits come from riding big trends—not predicting tops and bottoms.
Conclusion
Nicholas Darvas’ journey from a dancer to a millionaire trader proves that anyone can succeed in the stock market with the right strategy, discipline, and risk management. His box trading strategy is still used by traders today, helping them ride trends and maximize profits while minimizing risk.
Have you tried the Darvas Box strategy? Let’s discuss in the comments!

Holi Special: The Colors of Trading – Lessons from the Markets!
Hello Traders! Wishing you all a very Happy Holi! 🎉 Just like Holi brings a burst of colors , the stock market is also full of different shades of opportunities, risks, and rewards! Every trade we take paints a story—sometimes green (profits), sometimes red (losses), but always a lesson!
Lessons Traders Can Learn from Holi!
Green & Red – The Colors of Trading!
• Just like Holi is incomplete without colors, trading is incomplete without ups and downs.
• Green candles bring profits, but even red candles bring valuable lessons.
Patience Creates the Best Picture!
• In Holi, you don’t throw all colors at once—you take your time to enjoy the festival.
• Similarly, in trading, patience and discipline lead to the best results.
Don't Chase the Color – Plan Your Moves!
• Just as you plan your Holi celebrations, plan your trades.
• Avoid impulsive entries, wait for the right setup, and trade with a strategy!
Protect Yourself – Just Like You Do in Holi!
• In Holi, we apply oil to protect our skin. In trading, we use stop-losses to protect our capital!
• Risk management is key to long-term success!
Enjoy the Process – Every Trade Adds to Experience!
• Some colors take time to settle, just like profits in long-term trades.
• Every trade—win or lose—adds to your experience.
Conclusion
Just like Holi fills life with colors, the market fills our journey with experiences, emotions, and opportunities! Keep your risk in control, enjoy the process, and let your trades create a masterpiece!
What’s your favorite Holi & Trading lesson? Let’s celebrate in the comments! 🎉

Mastering Fractals: The Secret Weapon of Smart Traders!Hello Traders! Have you ever noticed that market patterns repeat across different timeframes? That’s where Fractal Theory comes in! Fractals are self-repeating patterns that occur at both micro and macro levels, helping traders spot trend reversals, breakouts, and entry points. Today, let's explore how to use fractals in price action trading to refine our strategy and improve accuracy!
1. What Are Fractals in Trading?
Fractals are recurring price patterns that signal potential reversals in the market.
These patterns consist of five or more candlesticks , where the middle candle is either the highest (bearish fractal) or lowest (bullish fractal) in a sequence.
Fractals help traders identify support, resistance, and trend shifts with better precision.
2. How to Identify a Fractal in Price Action?
Bullish Fractal: A price formation where the middle candle has the lowest low , surrounded by two higher lows on both sides.
Bearish Fractal: A price formation where the middle candle has the highest high , with two lower highs on both sides.
Multiple Timeframe Analysis: Fractals appear on all timeframes (from 1-minute to weekly charts), making them useful for scalpers, swing traders, and long-term investors.
3. How to Trade Using Fractal Theory?
Trend Confirmation: Combine fractals with indicators like Moving Averages, RSI, or Fibonacci levels to confirm trend direction.
Entry & Exit Signals: A bullish fractal near support may signal a buying opportunity , while a bearish fractal near resistance may indicate a potential sell signal .
Breakout Trading: Use fractals to spot breakout zones —when price breaks a previous fractal high (bullish) or low (bearish), it can confirm a new trend direction.
Stop-Loss Placement: Set stop-losses below bullish fractals (for buy trades) and above bearish fractals (for sell trades) to manage risk effectively.
Combine with Smart Money Concepts (SMC): Fractals align well with liquidity grabs, order blocks, and institutional moves , making them even more powerful when used with smart money trading techniques.
4. Limitations & Risk Management
Fractals are lagging indicators —they only confirm after the pattern has completed.
False signals can occur , so always confirm with volume, trend structure, or additional indicators.
Use risk-reward ratios wisely —never rely solely on fractals without a solid trading plan and stop-loss strategy.
Conclusion
Fractal Theory helps traders identify high-probability setups , confirm trend reversals , and improve trade entries & exits. By combining fractals with other technical analysis tools , traders can increase their accuracy and reduce market noise.
Have you ever used fractals in your trading? Let’s discuss in the comments!

Market Structure Shift: How to Spot Trend Reversals EarlyHello Traders! Spotting trend reversals early can be a game-changer in trading. A Market Structure Shift (MSS) occurs when price action transitions from an uptrend to a downtrend (or vice versa), giving traders a heads-up before major moves happen. Learning how to identify these shifts early can help you avoid traps and catch high-probability setups. Let’s break it down!
1. What is a Market Structure Shift (MSS)?
A Market Structure Shift (MSS) is when price transitions from a clear trend into a potential reversal.
It usually occurs when the price breaks a key level of support or resistance and fails to continue in the original trend.
MSS is often confirmed when price action starts forming lower highs & lower lows (bearish shift) or higher highs & higher lows (bullish shift).
2. How to Identify a Trend Reversal Early?
Break of Market Structure (BMS): When price breaks a recent swing high (in a downtrend) or a swing low (in an uptrend), it signals a shift in market sentiment.
Liquidity Grab & Stop Hunts: Smart money often pushes price beyond key levels to trigger stop-losses before reversing the trend.
Volume Confirmation: A real market structure shift is supported by increased volume , confirming strong buying or selling interest.
Failure to Make New Highs/Lows: If a trend starts struggling to create fresh highs in an uptrend (or fresh lows in a downtrend ), it indicates a weakening trend.
Moving Average Crossovers: When short-term moving averages (like 9 EMA or 21 EMA) cross below long-term ones (like 50 EMA), it can indicate a structural shift.
Divergence in RSI or MACD: If price makes a higher high , but RSI/MACD makes a lower high , it suggests momentum is weakening , hinting at a potential reversal.
3. How to Trade a Market Structure Shift?
Wait for Confirmation: Don’t enter immediately—wait for price retest or rejection at key levels.
Use Stop-Loss Wisely: Place stop-loss above the previous high (for short trades) or below the previous low (for long trades) to manage risk effectively.
Combine with Other Indicators: MSS is more powerful when used alongside support/resistance, volume analysis, and Fibonacci levels.
Look for Retests: Often, price will retest the broken structure level before continuing in the new trend. This gives a better risk-to-reward entry.
Trade with the New Trend: Once MSS is confirmed , look for pullbacks and enter in the direction of the new trend.
Conclusion
Understanding Market Structure Shifts helps traders stay ahead of trend reversals and avoid getting caught in bad trades. By combining price action, volume, and technical indicators , you can spot reversals early and execute high-probability setups.
Have you ever used market structure shifts in your trading? Let me know in the comments! 👇

Looking for sellside in USDJPY...Hello traders!
Yen gave the draw targets as I had previously outlined on X and TradingView & now we're looking for sellside.
As long as price is held below the daily ifvg, I'm bearish.
Already executed a scalp today on the 15 seconds chart in alignment with the said draw.
Not financial advice.
GLGT.

USDJPY running for buystops... Hello traders!
One of the models I use got triggered on the 1h timeframe once the breaker failed. Expected draw and everything else mentioned on the chart pretty clearly.
I expect the market to reach the buystops resting at 150.739 , and expect the market to tap into the daily ifvg and the daily sibi .
For the daily -ifvg to act as proper inversion, I don't expect teh market to trade above the CE of the gap and hence the expected target of 150.810 .
Not financial advice.
GLGT.

Sit STILL today! Let the GAMBLERS sacrifice themselves to LUCK.Hello traders!
Hope you find this video analysis helpful.
Not financial advice.
GLGT.

Learn Peter Lynch’s Proven Investment Strategies! Hello everyone, i hope you all will be doing good in your life and your trading as well. Today again i have brought an educational post on Peter Lynch's Golden Rules for Smart Investing, So let's Start and apply this in your Trading and Investing to achieve Success.
Invest in What You Know: Stick to businesses whose products and services you understand. Pay attention to companies you regularly interact with.
Do Your Homework: After identifying a good company, analyze its financials thoroughly. Look at sales growth, earnings, and the balance sheet.
Avoid the Hype: Don’t follow the crowd or invest in hot stocks based on market trends. Stick to your analysis and logic.
Look for Growth: Invest in companies with strong long-term growth potential, especially in expanding industries.
Know What You Own: Always understand why you are investing in a particular stock. Learn about its business model, competitive advantages, and risks.
Be Patient: Successful investing takes time. Don’t expect instant results; focus on the long-term potential of your investments.
The Stock Market is Not a Lottery: Investing requires research and knowledge, not random guesses.
Ignore Short-Term Fluctuations: Avoid reacting to daily price movements; focus on a company's fundamentals.
What This Means for Investors:
Following these principles will help you build a strong investment strategy based on knowledge, patience, and discipline.
Outcome:
By applying Peter Lynch’s principles, you can develop a systematic and confident approach to investing.

NIFTY 50: Comprehensive Analysis, Key Drivers,and FutureOutlooK?Chart Analysis: NIFTY 50
Key Levels of Interest
Support Zone (Highlighted in Green):
Range: 23,200–23,500
The chart shows a strong demand zone where buyers have historically stepped in. This area has acted as a reliable support, preventing further downside in the past.
Resistance Levels:
Immediate Resistance: 24,200–24,400 (Purple line)
Price has been struggling to break above this level, indicating a significant selling pressure.
Major Resistance: 25,550
Represented as a key level for a potential bullish breakout.
Trendline Analysis
The blue descending trendline highlights the pattern of lower highs, confirming a downward trend.
Unless price breaks above the trendline, the overall sentiment remains bearish.
Moving Averages
50-Day SMA (Purple Line): The price is trading below this level, signaling short-term weakness.
200-Day SMA (Yellow Line): The long-term moving average suggests bearish momentum as prices are below this too.
Candlestick Patterns
Recent candles show long lower wicks, which suggest some buying interest near the support zone.
Lack of large green candles indicates weak follow-through on buying attempts.
Volume Analysis
The volume bars are tapering off, showing a lack of strong participation in the current consolidation phase.
An uptick in volume near either resistance or support could signal the next significant move.
Indicators on Chart
RSI (Relative Strength Index): Though not displayed directly on the chart, you can infer it from the general price action. The price is likely near an oversold level, hinting at a potential bounce.
SuperTrend Indicator:
Currently bearish, indicating selling pressure dominates.
Short-Term Bias
Neutral to Bearish: While the price is consolidating in a range, it leans toward bearish due to:
Rejection near resistance.
Trading below both moving averages.
A downward-sloping trendline.
Scenarios Based on the Chart
Bullish Scenario
Breakout Above 24,400:
This resistance must be broken with strong volumes to indicate bullish momentum.
The next target would be 25,550, followed by potential higher highs.
Watch for large green candles and high volumes to confirm strength.
Bearish Scenario
Breakdown Below 23,200:
A fall below the support zone could accelerate selling, bringing prices to 22,800 or even lower.
This would signal continuation of the prevailing bearish trend.
Neutral Range
As long as prices remain between 23,200 and 24,400, the NIFTY 50 is likely to consolidate without a clear direction.
Short-term traders can exploit this range for quick trades, while long-term players might wait for a decisive move.
Next Steps for Traders Based on Chart
Aggressive Traders:
Look for breakouts or breakdowns near the trendline and support/resistance zones.
Conservative Traders:
Wait for confirmation (volume and candlestick patterns) before taking positions.
Use of Stop Loss:
For bullish trades, stop loss should be placed below 23,200.
For bearish trades, stop loss should be above 24,400.
What is NIFTY 50?
The NIFTY 50 is India’s flagship stock market index, representing the top 50 companies listed on the National Stock Exchange (NSE). It serves as a benchmark for the performance of the Indian stock market. These 50 companies are selected based on market capitalization and liquidity, spanning 13 sectors, including financials, IT, energy, and FMCG.
Growth of NIFTY 50
Historical Growth:
The NIFTY 50 started in 1996 with a base value of 1,000.
Over the years, it has become a barometer of India's economic progress, reflecting the performance of top blue-chip companies.
Long-Term Drivers of Growth:
Economic Expansion: India’s GDP growth has been a key factor.
Reforms and Policies: Initiatives like GST, Make in India, and privatization of PSUs have boosted the market.
Foreign Investments: FII/FDI inflows, due to India being a high-growth emerging market, have supported the index’s growth.
Sectoral Growth: IT, banking, and consumer goods have consistently driven the index higher.
Key Milestones:
2008: Crash during the global financial crisis.
2014: Bull run after stable government formation.
2020-2021: Sharp recovery post-COVID-19, driven by tech and healthcare sectors.
Factors Affecting NIFTY 50
Economic Factors
GDP Growth: Positive GDP growth supports the index as companies earn more.
Inflation: High inflation can reduce consumer purchasing power and hurt corporate profits.
Interest Rates: Higher interest rates discourage borrowing and investing, pressuring the index.
Global Events
US Federal Reserve Policies: Fed rate hikes impact global liquidity and foreign investments in Indian markets.
Geopolitical Tensions: Events like the Russia-Ukraine conflict can increase uncertainty, leading to volatility.
Commodity Prices: Rising oil and commodity prices hurt India due to its reliance on imports, especially crude oil.
Domestic News
Earnings Reports: Quarterly performance of heavyweight companies impacts the index.
Budget Announcements: Policies favoring infrastructure, manufacturing, or tax cuts can uplift sentiment.
Rupee Movement: A weak rupee can impact sectors like IT positively but hurt import-heavy sectors.
Sectoral Performance
Banking and IT have the highest weightage, making them critical to the index’s movement.
A strong rally in FMCG or Energy sectors can also significantly push the index.
Comprehensive News Analysis
Bullish News
Lower Crude Oil Prices: Reduces import bills and benefits the economy.
Strong FII Inflows: Sign of growing foreign investor confidence.
Favorable Budget Policies: Tax cuts, incentives for sectors like manufacturing, EVs, and infrastructure can push the index higher.
Bearish News
Recession Fears: Global recession concerns can lead to foreign outflows.
High Inflation: Persistently high inflation can weigh on corporate profits and valuations.
Rate Hikes: Further rate hikes by the RBI or US Fed may trigger selling pressure.
Future Outlook: Scenarios
Bullish Case
Support Zone Holds: If the price stays above 23,200 and breaks above the resistance at 24,400, it would signal bullish momentum.
Catalysts:
Stabilizing global macroeconomics.
Strong earnings by large-cap companies.
Infrastructure and manufacturing-led growth supported by government spending.
Targets:
Immediate Target: 25,550.
Long-Term Target: 27,000 (new highs, provided favorable conditions persist).
Bearish Case
Support Breaks at 23,200: A breakdown would open the door to further selling, with targets around 22,800 or lower.
Catalysts:
Weak global cues, like rising bond yields or geopolitical tensions.
Negative earnings surprises or downgrades of key constituents.
Targets:
Immediate Target: 22,500.
Long-Term Target: Below 22,000 (in case of broader market corrections).
Key Takeaways for Traders
Monitor Key Levels:
Support: 23,200.
Resistance: 24,400.
Follow the Trendline: Watch for breaks or bounces off the descending trendline for clarity.
Watch Sectoral Trends: Banking and IT are crucial due to their high weightage.
News Catalysts: Follow FII data, crude oil prices, and quarterly earnings for short-term moves.
Actionable Trading Strategies
Bullish Strategy
Buy Entry: Above 24,400 with strong volumes.
Target: 25,550 and higher.
Stop Loss: Below 24,000 to minimize risk.
Bearish Strategy
Sell Entry: Below 23,200 with volume confirmation.
Target: 22,500 or lower.
Stop Loss: Above 23,600 to protect against reversals.
Comprehensive Analysis of NIFTY 50
What is NIFTY 50?
The NIFTY 50 is India’s flagship stock market index, representing the top 50 companies listed on the National Stock Exchange (NSE). It serves as a benchmark for the performance of the Indian stock market. These 50 companies are selected based on market capitalization and liquidity, spanning 13 sectors, including financials, IT, energy, and FMCG.
Growth of NIFTY 50
Historical Growth:
The NIFTY 50 started in 1996 with a base value of 1,000.
Over the years, it has become a barometer of India's economic progress, reflecting the performance of top blue-chip companies.
Long-Term Drivers of Growth:
Economic Expansion: India’s GDP growth has been a key factor.
Reforms and Policies: Initiatives like GST, Make in India, and privatization of PSUs have boosted the market.
Foreign Investments: FII/FDI inflows, due to India being a high-growth emerging market, have supported the index’s growth.
Sectoral Growth: IT, banking, and consumer goods have consistently driven the index higher.
Key Milestones:
2008: Crash during the global financial crisis.
2014: Bull run after stable government formation.
2020-2021: Sharp recovery post-COVID-19, driven by tech and healthcare sectors.
Factors Affecting NIFTY 50
Economic Factors
GDP Growth: Positive GDP growth supports the index as companies earn more.
Inflation: High inflation can reduce consumer purchasing power and hurt corporate profits.
Interest Rates: Higher interest rates discourage borrowing and investing, pressuring the index.
Global Events
US Federal Reserve Policies: Fed rate hikes impact global liquidity and foreign investments in Indian markets.
Geopolitical Tensions: Events like the Russia-Ukraine conflict can increase uncertainty, leading to volatility.
Commodity Prices: Rising oil and commodity prices hurt India due to its reliance on imports, especially crude oil.
Domestic News
Earnings Reports: Quarterly performance of heavyweight companies impacts the index.
Budget Announcements: Policies favoring infrastructure, manufacturing, or tax cuts can uplift sentiment.
Rupee Movement: A weak rupee can impact sectors like IT positively but hurt import-heavy sectors.
Sectoral Performance
Banking and IT have the highest weightage, making them critical to the index’s movement.
A strong rally in FMCG or Energy sectors can also significantly push the index.
Technical Chart Analysis
The NIFTY 50 is currently in a descending triangle pattern, with key support levels and resistance zones as follows:
Support Levels:
Immediate support: 23,200 (green demand zone).
A break below this level could lead to further downside to 22,500 or lower.
Resistance Levels:
Immediate resistance: 24,400 (upper trendline of descending triangle).
A breakout above this could signal a bullish trend reversal.
Trendlines and Moving Averages:
The 200-day moving average (yellow line) provides long-term support around 23,700.
The 50-day moving average (purple line) acts as a short-term resistance.
Volume Analysis:
Higher volumes near support zones indicate potential accumulation.
Declining volumes near resistance suggest indecision.
Comprehensive News Analysis
Bullish News
Lower Crude Oil Prices: Reduces import bills and benefits the economy.
Strong FII Inflows: Sign of growing foreign investor confidence.
Favorable Budget Policies: Tax cuts, incentives for sectors like manufacturing, EVs, and infrastructure can push the index higher.
Bearish News
Recession Fears: Global recession concerns can lead to foreign outflows.
High Inflation: Persistently high inflation can weigh on corporate profits and valuations.
Rate Hikes: Further rate hikes by the RBI or US Fed may trigger selling pressure.
Future Outlook: Scenarios
Bullish Case
Support Zone Holds: If the price stays above 23,200 and breaks above the resistance at 24,400, it would signal bullish momentum.
Catalysts:
Stabilizing global macroeconomics.
Strong earnings by large-cap companies.
Infrastructure and manufacturing-led growth supported by government spending.
Targets:
Immediate Target: 25,550.
Long-Term Target: 27,000 (new highs, provided favorable conditions persist).
Bearish Case
Support Breaks at 23,200: A breakdown would open the door to further selling, with targets around 22,800 or lower.
Catalysts:
Weak global cues, like rising bond yields or geopolitical tensions.
Negative earnings surprises or downgrades of key constituents.
Targets:
Immediate Target: 22,500.
Long-Term Target: Below 22,000 (in case of broader market corrections).
Actionable Trading Strategies
Bullish Strategy
Buy Entry: Above 24,400 with strong volumes.
Target: 25,550 and higher.
Stop Loss: Below 24,000 to minimize risk.
Bearish Strategy
Sell Entry: Below 23,200 with volume confirmation.
Target: 22,500 or lower.
Stop Loss: Above 23,600 to protect against reversals.
Disclaimer
This analysis is for educational and informational purposes only and should not be considered as financial or investment advice. Trading and investing in the stock market carry risks, and past performance is not indicative of future results. Always conduct your own research or consult with a certified financial advisor before making any investment decisions.

BITCOIN TECHNICAL ANALYSIS ( 18th Oct 2023 )Price Analysis
Current Price: $28739.02
24-Hour Change: 1.88%
Circulation Supply: 19.52M
Trend Analysis
Technical Indicator : Strong Buy (On Daily Basis)
Moving Average : Strong Buy (On Daily Basis)
Overall Trend : Strong Buy (On Daily Basis)
Key Support and Resistance Levels:
Support Level 1: 28125.4
Support Level 2: 27850.3
Resistance Level 1: 28639.0
Resistance Level 2: 23378.7
Moving Averages:
50-Day Simple Moving Average (SMA): 26790.70 ( Buy)
200-Day Simple Moving Average (SMA): 27772.0 ( Buy )
Relative Strength Index (RSI)
Current RSI: 67.237
RSI Interpretation: Buy Zone
Volume Analysis
Trading Volume: $14,616,751,761
Volume Trends: Increasing in Nature
Candlestick Patterns
BULLISH DOJI STAR : Bullish Reversal ( Indication ), Medium ( Reliabilty ), During a downtrend, the market strengthens the bears with a long black candlestick and gaps open on the second one. However, the second candlestick trades within a small range and closes at or near its open. This scenario generally shows the potential for a rally, as many positions have been changed. Confirmation of the trend reversal would be a higher open on the next candlestick ( Description ).
HANGING MAN : Bearish Revesal ( Indication ), Low ( Reliabilty ),
During an uptrend, there is a sharp sell off after a gap to the upside. However, the candlestick closes at or near its high. This signifies the potential for further sell-offs. Since the certainty for a Hanging Man indicator is low, the trend reversal can be confirmed by a black candlestick or a large down gap on the next candlestick accompanied by a lower close ( Description ).
Conclusion
The live price of Bitcoin is $ 28,739.15 per (BTC / USD) with a current market cap of $ 560.90B USD. 24-hour trading volume is $ 14.61B USD. BTC to USD price is updated in real-time. Bitcoin is +1.83% in the last 24 hours with a circulating supply of 19.52M.
It's essential to exercise caution and apply risk management strategies in your trading decisions.

Gold sell after right shoulder formGold is about to form head and shoulder pattern so all buyers will came
Firstly they trap sellers who enter at breakdown after breakdown it rally and make head and shoulder otherwise they trap her nor they trap head and shoulder buyers

GSFC Lamba Race Ka GhodaGSFC the moves are impulsive we have first 9 Waves up it could further subdivide in 13 waves will have to wait but any pullback to 155-147 will be good add zone for long term investment.
I am not a SEBI Registered Analyst please consult your advisor before investing charts shared for education purpose only.

USD/CAD BREAKDOWN As Per Smart Money Concepts ..
Usd/cad Currency Pair Its Important Support Zone And Sustain Below .
We Can See Good Down Movement In This pair..
Stop loss Also Mention In Chart.
Disclaimer:- This Post Is Only Educational Purpose . Trade With Your Risk Management.

NIFTY 17000 mark ,coming soon !!As we can see, in the past NIFTY has taken support from that same Ascending Trend Line multiple times,
taking support and moving up at least 10%, we can see that from S1, S2, and S3.
The Risk is minimum.
Stop loss(below Trend Line{TL}- a strong close of candle below TD) and the reward is 17000 mark.
Our key principles:-
> We will only enter a trade when we are 100 % confident.
> We will only enter those set-ups where risk is very low.
> We will wait patiently for the price to come under our radar, until then we will just wait and watch.

DRREDDY short tradeDRREDDY showing weakness after taking out short side stoploss so looking to short around 4518. Looking forward expecting price moving down towards 4444 and 4380 with trade invalidation on close above 4565. Bear put spread is my preferred way to enter short as the overnight risk is defined.

unichem labs expecting big moveThis stock has failed to make new lower low waiting for trend change and look for trade


EURUSD 4H analysisEURUSD 4H analysis
EURUSD is Bullish on 4h
price respecting recent Demand zone
you can look for longs on small timeframe

EURUSD D1 analysisEURUSD D1 analysis
EURUSD is Bullish on Daily Timeframe
you can look for longs on smaller timeframe

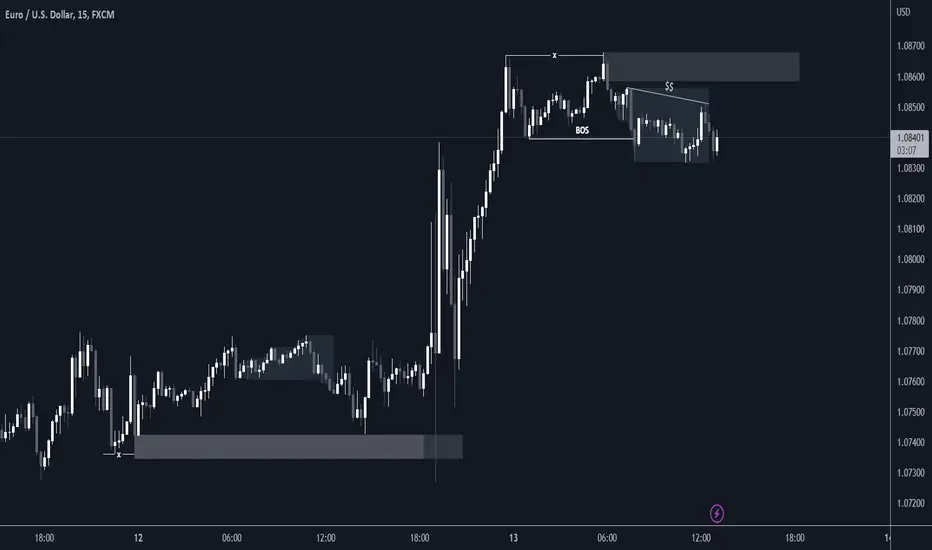

EURUSD Observation: -
In the chart, we can see recent low is broken. so, it is the change of character on 1HR chart.
Probability: -
We can think that there's probability of the price is going to meet its 4-hour POI. so, we can enter in the short position after touching poi of 1hr in 5 min chart with change of character with the target of 1.05640 and we can set target for partial profit booking to its recent low (which is made after the Choch in 1 hr chart).
Need help: -
suggest a good broker to trade forex in India.
Thanks!!!
