EURUSD Weekly Outlook - 10/11/205 to 14/11/2025Wassup Lads!
So this week we can see that EU closed sharply into the week rejecting the lows, there's a strong rejection candle on the weekly time frame and price has displaced higher forming a daily swing point and a daily fair value gap as well, so what I would be looking for price is to do this -
1. Price range on Monday
2. Manipulte into the daily fair value gap.
3. Look for smt divergence during key times
4. Would look for longs
This is my plan for EU this coming week.
Do your own research, manga risk and stay disciplined bois.
Let's win this week!
SMC

My Journal Trade 2 - ETHUSDT LONGThis was a counter trade in a downtrend, low probability and also weekend, however it looked super clean and I took it. Coming to the trade
1. SMT between PDLs b/w ETH and BTC
2. Price tapped into H4 FVG
3. Smt with BTC in the H4 FVG
4. Target a basic 1 to 2 Risk to Reward
So this was a success. A risky one in a downtrend though, took it because it has all the elements of a good trade setup barring the time.

CRYPTO WEEKLY OUTLOOK 10/11/25 - 17/11/25Wassup Lads! So crypto is clearly in a downtrend as of now targeting pending daily sell side liquidity but it's also in a monthly key level that is a fair value gap, so what I am expecting price to do now is take out the pending lows on the daily timeframe on BTCUSDT and inverse the daily fair value gap, this would also cause an SMT Divergence with ETHUSDT signalling a shift in orderflow. So right now it's headed lower.
This is my plan,
1. Sell to the lows
2. Wait for an inversion of the daily bearish fair value gap on BTCUSDT, to confirm a reversal for buys.
Remember to -
1. Manage Risk
2. Do your own research
3. Stay Disciplined

Weekly analysis BTC with 4R trade ideaLast weeks’ trade has performed well and already moved ~15K points and still going on. Further to this week analysis, we expect good reversal trade from the zone of 89700 to 90385. Still we have ~11k points movement pending to reach to this level. Price would be showing weakness in sell side and reversal pattern. We should patiently wait for entry model and confirmation as price is in sell side.
1. 1D FVG and wick is creating strong cluster of their relevant CE levels.
2. We would see exaction in sell side movement and reversal pattern.
3. RSI will also show oversold or bearish divergence on HTF.
4. Most probably price will take liquidity of FVG and create MSS/CISD/TS/iFVG in LTF.
5. Price should show rejection/reversal in respective LTF (1H/15m) at FVG zone.
6. Take the trade only once clear entry model i.e. turtle soup. iFVG break, CDS or MSS happens on LTF
All these combinations are signalling a high probability and ~4R trade scenario.
Note – if you liked this analysis, please boost the idea so that other can also get benefit of it.
Also follow me for notification for incoming ideas.
Also Feel free to comment if you have any input to share.
Disclaimer – This analysis is just for education purpose not any trading suggestion. Please take the trade at your own risk and with the discussion with your financial advisor.
,
GOLD RANGE PLAY — CLEAN SUPPLY & DEMAND REACTIONS AHEAD🧭 DAILY TRADING PLAN — GOLD (XAU/USD)
Date: Nov 3, 2025
Main Timeframe: M30 – H1
Strategy: SMC + Trendline Structure + Supply/Demand Zones
🌐 MARKET CONTEXT
Gold continues to consolidate inside a symmetrical triangle, forming clear supply and demand zones within a tightening range.
Current structure shows a bearish bias below 4039 but still holding a bullish base above 3970–3980.
Both buyers and sellers have clear liquidity zones to play from — ideal for short-term reactions and fade setups.
📈 TECHNICAL OUTLOOK
🔹 BUY SCENARIO 1 (Main Setup)
BUY 3980 – 3978
→ SL: 3973 (6 pips)
→ TP1: 4010 | TP2: 4038
Structure support + local BOS. Wait for bullish rejection or engulfing confirmation.
R:R ≈ 5–9 depending on TP target.
🔹 BUY SCENARIO 2 (Aggressive Entry)
BUY 3970 – 3968
→ SL: 3963
→ TP1: 4000 | TP2: 4038
Deep retest into lower trendline + demand imbalance zone.
Only valid if market respects structure and holds above 3960.
🔸 SELL SCENARIO 1
SELL 4027 – 4029
→ SL: 4034
→ TP1: 4000 | TP2: 3970
Short from supply zone with bearish CHoCH confirmation on lower timeframe.
Rejection at this level can target liquidity below 3980.
🔸 SELL SCENARIO 2 (Higher Supply)
SELL 4037 – 4039
→ SL: 4044
→ TP1: 4010 | TP2: 3970
This is the weak high area — potential sweep zone before reversal.
Look for liquidity grab + bearish candle confirmation before entry.
🧩 STRUCTURE RECAP
Bias: Range-bound → Bearish within triangle
BOS / CHoCH: Confirmed on M30 around 4029 zone
Weak High: 4039
Strong Support: 3970–3980
Major Resistance: 4045–4128
⚙️ TRADE MANAGEMENT
Risk per setup ≤ 1–2%
Move SL → BE after TP1
Avoid entries during high-impact news
Wait for confirmation (no blind limits)
🧠 SUMMARY
Gold is ranging within a compressed structure, where shorts from supply and buys from demand both align with liquidity targets.
The cleanest play remains:
→ Buy near 3978 / Sell near 4038, trade between zones until a breakout occurs.
If price breaks and holds above 4045, expect bullish continuation to 4128.
If breaks below 3960, bearish expansion likely resumes toward 3920.

XAU/USD – SELL SETUP AT 3999–4001 | REJECTION FROM DOWNTREND ZON🪙 XAU/USD — SELL SETUP AT 3999–4001 | REJECTION FROM DOWNTREND ZONE
📊 Market Context:
Gold is still respecting the descending trendline structure, showing multiple rejections at the resistance zone near 4000–4005. The recent rally seems corrective within a broader bearish framework. Liquidity has been swept above previous highs, followed by a clear CHoCH back to bearish order flow.
📉 Technical Breakdown:
Structure: BOS confirmed on H1, CHoCH on M30 aligns with bearish continuation.
Key Levels:
Sell Zone: 3999–4001 (previous supply + trendline retest)
Buy Zone: 3939–3937 (retest of demand + equal lows area)
Momentum: RSI is failing to sustain above 50 and showing lower highs — confirming potential weakness.
Bias: Bearish until price closes decisively above 4005.
🎯 Trade Idea:
Entry: SELL 3999–4001
Stop Loss: 4007 (≈6 pts above entry)
Take Profit:
TP1: 3950
TP2: 3939
TP3: 3910 (extended target if momentum continues)
📈 Alternative Plan (if pullback deepens):
If price reclaims 4005, wait for liquidity sweep above 4010 and look for bearish confirmation again — otherwise, invalidation of the short bias.
🧠 Summary:
Gold remains capped under major resistance. Short positions around 4000 align with both multi-timeframe structure and momentum divergence. Bulls need a strong breakout above 4005 to shift bias back to bullish.

GOLD PULLBACK BEFORE FINAL LEG DOWN🧭 DAILY TRADING PLAN – GOLD (XAU/USD)
📅 Date: Nov 04, 2025
📊 Main timeframe: H2 confirmation + M30 execution
🎯 Strategy: SMC + Liquidity Grab + OB Rejection
MARKET CONTEXT
Gold is currently trading around the 3970 zone after a clear Break of Structure (BOS) on the M30 timeframe, confirming short-term bearish pressure. On the H2 chart, price remains in a descending channel, forming lower highs since 4128 → 4006, aligning with overall bearish sentiment.
Recent CHoCH signals on M30 indicate that buyers tried to defend the 3980–3970 area twice but failed to sustain momentum. Liquidity was swept below minor lows, suggesting a potential continuation toward deeper liquidity pools near 3960–3955.
KEY LEVELS
SELL ZONE 1: 4025–4027
SELL ZONE 2: 4011–4013
BUY ZONE 1: 3980–3978
BUY ZONE 2: 3970–3968
TRADING IDEA
Current bias: Bearish, expecting a pullback before continuation.
If price retraces to 4011–4027, watch for rejection and BOS on M5/M15 to enter short.
TP1: 3978, TP2: 3960
SL: above 4027 (≈6 points)
Alternatively, if price sweeps liquidity below 3968 and shows strong CHoCH upward, consider scalp long back to 3980–3990, with SL below 3962 (≈6 points).
CONFIRMATION
M30: BOS down confirmed after CHoCH
H2: Resistance zone rejection aligning with trendline + EMA confluence
RSI showing mild bearish momentum, not yet oversold → room for downside continuation
OUTLOOK
As long as price remains below 4027, the bearish structure holds. Watch for liquidity grabs at support zone 3960–3970 before a potential short-term retracement. A clean break above 4030 would invalidate this plan and flip bias to neutral.
📌 Plan Summary
🎯 Sell the pullback at 4011–4027
🎯 TP: 3978 / 3960
🛑 SL: 4027 (6 points)

Weekly & Daily BTC analysis of 10R Opportunity........On HTF weekly and daily BTC is forming good scenarios for bearish trade. Price is consolidating at higher levels for last couple of weeks and showing value adjustment in BTC. Price already shot up a lot and we may see a short term pull back.
1. BTC has created CISD after taking liquidity at weekly level and tested weekly iFVG.
2. It has also created 1D FVG and 4H FVG and iFVG over lapping. creating cluster of CEs. Which might be a Good POI for sell side opportunity.
3. Technically we are already into a weekly down side scenario. Further price is approaching Daily and 4 Hourly FVGs for possible re-entry opportunities.
4. RSI has also already shown a bearish divergence on weekly level.
5. Most probably price will take liquidity of FVG and create MSS/CISD/TS/iFVG in LTF.
6. Price should show rejection/reversal in respective LTF (1H/15m) at FVG zone.
7. Take the trade only once clear entry model i.e. turtle soup. iFVG break, CDS or MSS happens on LTF
All these combinations are signalling a high probability and ~10R trade scenario.
Note – if you liked this analysis, please boost the idea so that other can also get benefit of it. Also follow me for notification for incoming ideas.
Also Feel free to comment if you have any input to share.
Disclaimer – This analysis is just for education purpose not any trading suggestion. Please take the trade at your own risk and with the discussion with your financial advisor.

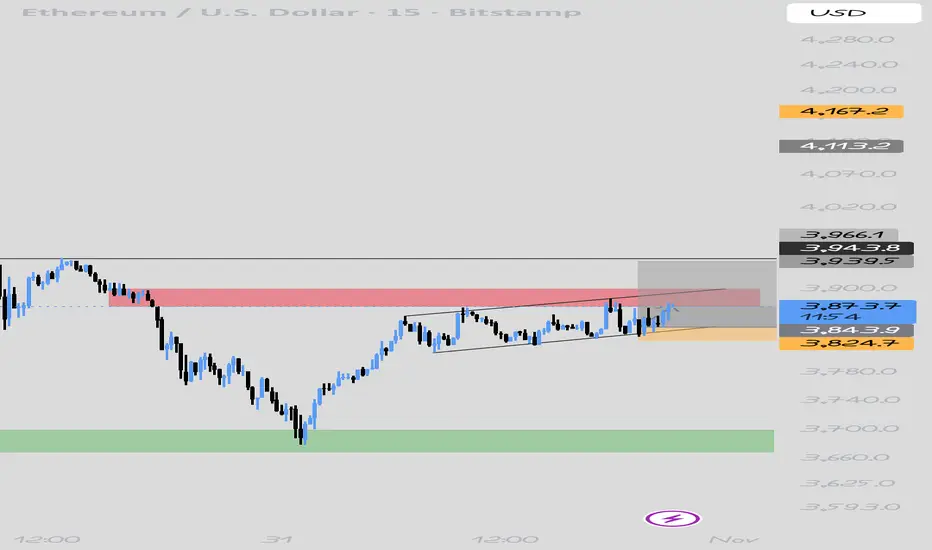
Ethereum on 15 min time frame Ethereum in 15 min TF under in choppy zone 3820 to 3880
If it's break above side at 3900
Then i look for previous resistance zone
At
1. 3950
2 3400
Stop lose
I place my Stop below this zone area at
3790. 3800
GOLD TRAPPED BETWEEN LIQUIDITY ZONES – WAITING FOR SMART MONEY M🧭 DAILY TRADING PLAN – GOLD (XAU/USD)
Date: Oct 31, 2025
Main timeframe: M30 – H1
Strategy: SMC + Liquidity Grab + BOS/CHOCH Confirmation
🎯 Hook:
Gold is currently ranging between two key liquidity zones after a bullish BOS. Will price hunt the weak high or sweep the buy-side liquidity before the next leg?
🌐 MARKET CONTEXT
After a strong recovery from 3960 → 4040, price created a weak high with no significant displacement. The recent rejection from 4037–4039 suggests short-term supply pressure, but overall market structure remains bullish with multiple BOS confirmations.
Current structure shows a liquidity grab → retracement phase before continuation.
📈 TRADING PLAN
Scenario 1 – BUY setup (preferable)
Entry zone: 3996 – 3994
Confirmation: Bullish reaction / CHoCH on lower timeframe (M5–M15)
TP1: 4030
TP2: 4038 (liquidity above weak high)
SL: 3988 (≈ 6$ risk range)
Bias: Continuation bullish leg after mitigation
Alternative BUY zone (deep retracement):
Entry: 3960 – 3958
TP: 4030
SL: 3952
Use only if price sweeps lower liquidity.
Scenario 2 – SELL setup (counter-trade)
Entry zone: 4037 – 4039
Confirmation: M15 bearish CHoCH / rejection candle
TP1: 4010
TP2: 3995
SL: 4045 (≈ 6$ risk range)
Bias: Short-term sell before retest demand
🧩 SUMMARY
Market still shows bullish structure, so buy setups at demand zones are higher probability.
Sell setups should be quick scalps around the weak high, targeting intraday retracement.

GOLD READY FOR A BULLISH REBIRTH | Pullback Buy Setup Inside🧭 DAILY TRADING PLAN — GOLD (XAU/USD)
Date: Oct 30, 2025
Main timeframe: H1 – M30
Strategy: SMC + EMA Confluence + Trendline Reversal
🧩 MARKET CONTEXT
Gold has just completed a liquidity sweep below 3920 and is forming a bullish corrective structure along the rising trendline.
The short-term structure shows CHoCH → BOS confirmation around 3950–3970, signaling a potential reversal phase.
Price is currently testing the EMA zone (H1) and approaching the key supply at 4026–4028, where short-term profit-taking might appear.
Overall, market sentiment remains bullish toward 4020–4030, but a short retracement could occur before the next leg up.
🎯 TRADE PLAN
BUY SETUP #1
Entry: 3950 – 3948
SL: 3943
TP: 4018 → 4026
(R:R ≈ 1:3)
If price fails to hold above 3948, wait for a deeper liquidity grab:
BUY SETUP #2
Entry: 3921 – 3919
SL: 3913
TP: 3980 → 4020
(Liquidity sweep + trendline confluence)
SELL SETUP (Counter-trade)
Entry: 4026 – 4028 (rejection zone)
SL: 4033
TP: 3970 – 3950
(Only valid if bearish BOS appears on M15)
🔍 TECHNICAL INSIGHT
Structure flipped bullish after CHoCH & BOS on M30
Trendline support remains intact
EMA 34 crossing upward on H1 – confirming short-term momentum
Main liquidity pools sit around 3919 (below) and 4028 (above)
Expect pullback → bullish continuation as long as price stays above 3948

DAILY TRADING PLAN — GOLD (XAU/USD) | Pullback Buy Zones 🧭 DAILY TRADING PLAN – GOLD (XAU/USD)
Date: Oct 29, 2025
Main timeframe: M15 – M30
Strategy: SMC + Trendline + Fibo confluence
🧩 MARKET CONTEXT
Price created a BOS at 3983, indicating short-term bullish momentum within an ascending channel. The current structure supports pullback buys from demand / OB zones before targeting key resistance levels 4018 → 4085–4102 (Fibo reaction zone).
🎯 TRADE SETUPS
1️⃣ BUY #1 (Preferred – Retest Trendline / CP)
Entry: 3961
SL: 3955 (6 pts)
TP1: 3983
TP2: 4018
Structure-based retest at 50% trendline + CP zone
2️⃣ BUY #2 (OBS / OB Zone)
Entry: 3934 – 3932
SL: 3928 (6 pts)
TP1: 3983
TP2: 4018
TP3: 4085 – 4102 (extension target)
3️⃣ SELL (Counter-trend only)
Entry: 3992 – 3994
SL: 4000 (6 pts)
TP1: 3934
TP2: 3910
Use only if there is a clear rejection candle around the 3990s zone.
📈 BIAS
Short-term bullish while above 3930–3910.
Watch 3961 / 3932 zones for buy reactions.
Shorts valid only if strong rejection occurs at 3990s.

GOLD RETESTING SUPPLY BEFORE NEXT LEG DOWN🧭 DAILY TRADING PLAN – GOLD (XAU/USD)
Date: Oct 28, 2025
Main timeframe: M30 – H1
Strategy: SMC + Market Structure + Supply Zone
1. MARKET CONTEXT
Gold continues its bearish momentum after multiple CHoCH and BOS confirmations on lower timeframes.
Price is currently trading around 3935, after rejecting from several supply zones (4045–4047, 4011–4013, and 3975–3977).
Higher timeframe structure (H1–H4) remains bearish, with resistance forming between 4010–4050 and potential liquidity resting below 3928.
2. INTRADAY BIAS
Bias: Bearish
Expectation: Short retracement into supply → continuation down to support zone.
3. TRADING SETUP
Sell Zone #1: 3975 – 3977
Sell Confirmation: Price forms bearish CHoCH on M15–M30 near supply zone.
Entry: 3976
Stop Loss: 3982 (6 USD range)
Take Profit 1: 3940
Take Profit 2: 3928
R:R ≈ 1:4 — targeting liquidity below the previous swing low.
Avoid buying until clear BOS above 4013 is confirmed.
4. NOTES
If price closes above 4013, invalidates short bias and shifts to neutral — wait for fresh structure before entering again.
Monitor volume + reaction near Support Zone (3928–3940) for potential profit-taking.

Nifty 50 – Key Levels & Trade Setups | 27 Oct 2025Overview
The NIFTY 50 index concluded the previous week with an indecisive candle, reflecting ongoing market uncertainty. Notably, the price action has successfully filled the gap that was left open on October 20, 2025. As we approach the market open on October 27, 2025, I will be closely monitoring the initial price behavior to gauge directional bias.
Current Technical Scenario
The market is currently positioned within the 25,830–25,800 range coinciding with a 3-minute FVG, which could serve as a pivotal zone for short-term movements. From current levels, there is potential for a downside extension toward the 25,670.
Key Levels to Watch
Resistance : Monitor for breakout above the 25,875 level.
Support : 25,700, followed by 25,670 (major).
I will closely monitor market reactions at these levels during the trading session on October 27, 2025, and, if possible, provide real-time updates post-market open at 9:15 AM IST based on live price developments. This analysis is for educational purposes only and not financial advice—always conduct your own due diligence and manage risk appropriately.

GOLD RETRACEMENT BEFORE NEXT LEG DOWN GOLD RETRACEMENT BEFORE NEXT LEG DOWN
Body: 🧭 DAILY TRADING PLAN – GOLD (XAU/USD)
Date: Oct 27, 2025
Main timeframe: M30 – H1
Strategy: SMC + Fibo Zone Reaction + OB/Trendline Confluence
1️⃣ MARKET CONTEXT
Price is consolidating after a sharp drop from 4186 → 4058.
Currently, price is trading inside a support trendline + OB BUY ZONE (4058 - 4061), showing signs of demand reaction.
Above, multiple supply zones are stacked (4093 - 4095 / 4114 - 4116 / 4135 - 4137), creating strong short-term resistance layers.
Structure remains bearish, but a corrective leg toward premium zones is likely before any continuation down.
2️⃣ BIAS
Short-term bullish retracement, then sell continuation from premium supply zones.
3️⃣ SCENARIO 1 — BUY SETUP (Short-term retracement)
Entry: 4061 – 4059
SL: 4055
TP1: 4093
TP2: 4114
RR: ≈ 1:4
Note: Only buy if price forms bullish BOS / engulf on M15 from this OB zone (confluence with Fibo 0.786).
4️⃣ SCENARIO 2 — SELL SETUP (Main setup)
Option 1:
Entry: 4093 – 4095
SL: 4100
TP1: 4061
TP2: 4002
RR: ≈ 1:5
Option 2:
Entry: 4114 – 4116
SL: 4120
TP1: 4061
TP2: 4002
RR: ≈ 1:5
If price reaches 4135 – 4137, this is an extreme premium zone (reactive Fibo + previous double top). Expect strong reaction and liquidity sweep before a larger sell-off.
5️⃣ KEY LEVELS
OB BUY ZONE: 4058 – 4061
SELL ZONE 1: 4093 – 4095
SELL ZONE 2: 4114 – 4116
SELL ZONE 3: 4135 – 4137
Liquidity Target: 4002 – 3930
6️⃣ SUMMARY
Wait for reaction at 4058 zone for short-term buy retracement.
Main idea: Sell from premium → Target liquidity below 4000.

Gold sweeps SL, wait for BUY LIMIT at Demand Zone 4,223-4,225Timeframe analysis: H4/30M
Logic: Trend Continuation after liquidity sweep.
MARKET STRUCTURE ANALYSIS (SMC Analysis)
Main Trend: Bullish (Price is moving within a parallel channel).
Structure Confirmation (BOS): The chart has confirmed an upward Break of Structure (BOS), indicating that buyers are controlling the market.
Liquidity Sweep/Fake: The strong bearish candle (marked as "Fake") is a move to sweep Stop Losses of early buyers and gather liquidity before Smart Money pushes the price in the main direction. This is an Inducement action.
Key Demand Zone (POI/Demand Zone/Order Block): The TIMING BUY area (4,223.154 - 4,225.000) is a potential Demand Zone/Order Block identified by Smart Money. The price is expected to retest this area before continuing to rise.
MAIN TRADING SCENARIO (LONG SETUP)
SCENARIO: Wait for the price to Pullback to the POI area to enter a buy order, continuing the main bullish trend.
Parameter
Value
SMC Description
Action
BUY LIMIT
Place a pending buy order
Entry Zone (POI)
4,225.000 - 4,223.150
Demand Zone/Order Block after liquidity sweep.
Stop Loss (SL)
4,214.390
Place below the low of the liquidity sweep candle ("Fake Low"), ensuring safety.
Take Profit 1 (TP1)
4,240.000
Target the nearest Swing High.
Take Profit 2 (TP2)
4,250.000
Target psychological resistance and mid-channel.
Take Profit 3 (TP3)
4,260.000+
Target the upper boundary of the parallel channel.
R:R Ratio
Approximately 1:2.5 to 1:3.5 (Depending on TP)
Good R:R ratio for a trend-following trade.
RISK MANAGEMENT
Risk: Only risk a maximum of 1-2% of the account for this trade.
Breakeven: When the price hits TP1, move SL to the Entry point (Breakeven) to protect capital.
Invalidation: If the price closes the D1/H4 candle below the SL level (4,214.390), the buy plan will be invalidated.

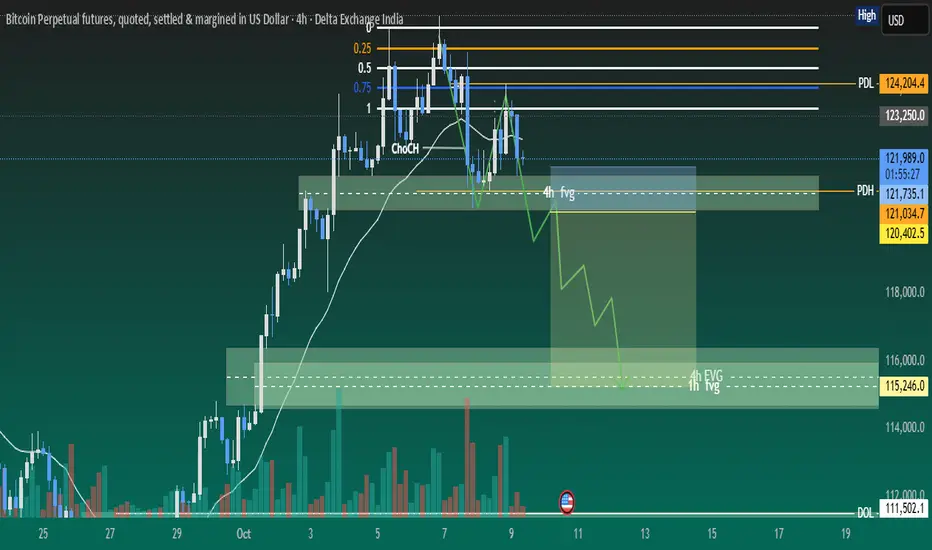
BTC forming wonderful scenarioBTC is forming good scenarios for bullish and subsequently bearish trade. It has created ABC pattern and retracing back to bullish FVG. We need to wait for price getting into right zones. We may also see a sell side trade once reaches to bearish FVG.
1. Currently price has broken ABC pattern neckline and retracing towards 1h FVG.
2. We may also see a sell side trade once price tap into bearish FVG and shows reversal pattern.
3. Most probably price will take liquidity of FVG and create MSS/CISD/TS/iFVG in LTF.
4. Price should show rejection/reversal in LTF (5m,1m) at FVG zone.
5. Take the trade only once clear entry model i.e. turtle soup. iFVG break, CDS or MSS happens on LTF
All these combinations are signalling a high probability and ~4R trade scenario.
Note – if you liked this analysis, please boost the idea so that other can also get benefit of it. Also follow me for notification for incoming ideas.
Also Feel free to comment if you have any input to share.
Disclaimer – This analysis is just for education purpose not any trading suggestion. Please take the trade at your own risk and with the discussion with your financial advisor.

BTC is developing ~4R down side tradeBTC has done MSS on 4h time frame and showing rejection at 4H FVG after displacement. We can see a good downside trade once below FVG is mitigated and changed to iFVG. We need to wait for price getting into right zones.
1. Currently price is moving inside 4H FVG after displacement and showing rejection as well.
2. Price should break below FVG and retest.
3. There are several SIBIs which may be target for it and further buy side reversal trade.
4. RSI has already shown bearish divergence. Which support coming down move.
5. Most probably price will take liquidity of FVG and create MSS/CISD/TS/iFVG in LTF.
6. Price should show rejection/reversal in LTF (5m,1m) at FVG zone.
7. Take the trade only once clear any of the entry model i.e. turtle soup. iFVG break, CDS or MSS happens on LTF
All these combinations are signalling a high probability and ~4R trade scenario.
Note – if you liked this analysis, please boost the idea so that other can also get benefit of it. Also follow me for notification for incoming ideas.
Also Feel free to comment if you have any input to share.
Disclaimer – This analysis is just for education purpose not any trading suggestion. Please take the trade at your own risk and with the discussion with your financial advisor.
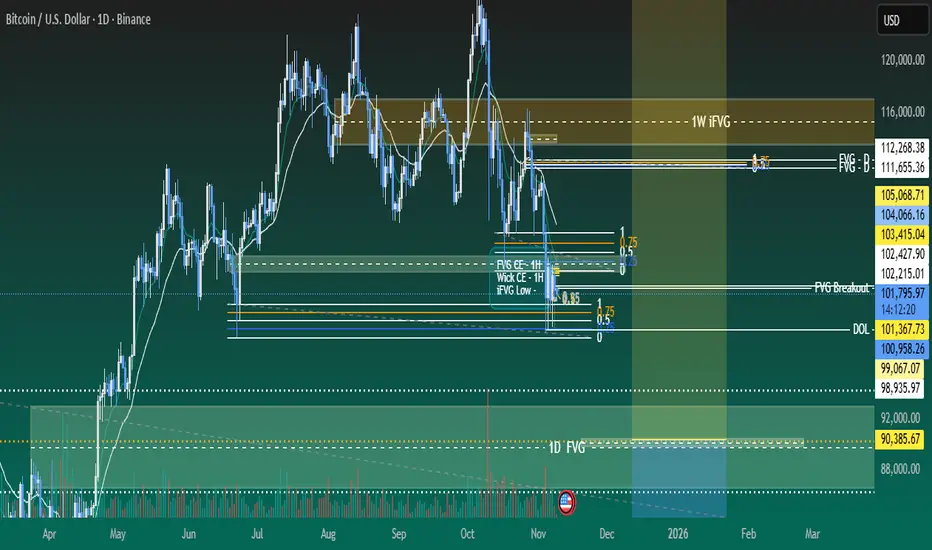
Beautiful 6R BTC trade scenariosBTC is forming both buy and sell side trades as the price is in critical zone. BTC will possibly give us both side good trades. We need to wait for price getting into right zones.
1. Currently price is moving around daily and 4H gradient levels.
2. 125275 level is creating a gradient cluster of both 1d and 4h time frame. Which may give us a good sell side trade if price show clear reversal signals.
3. There is an 1hour iFVG if price takes liquidity of it, most probably it will touch gradient cluster level and good sell scenario may be confirmed.
4. There are several SIBIs which may be target for it and further buy side reversal trade.
5. Buy side reversal trade may be good trade as overall BTC order flow is upside.
6. Most probably price will take liquidity of FVGs and create MSS/CISD/TS/iFVG in LTF.
7. Price should show rejection/reversal in LTF (5m,1m) at FVG zone.
All these combinations are signalling a high probability and 5.5R trade scenario.
Note – if you liked this analysis, please boost the idea so that other can also get benefit of it. Also follow me for notification for incoming ideas.
Also Feel free to comment if you have any input to share.
Disclaimer – This analysis is just for education purpose not any trading suggestion. Please take the trade at your own risk and with the discussion with your financial advisor.

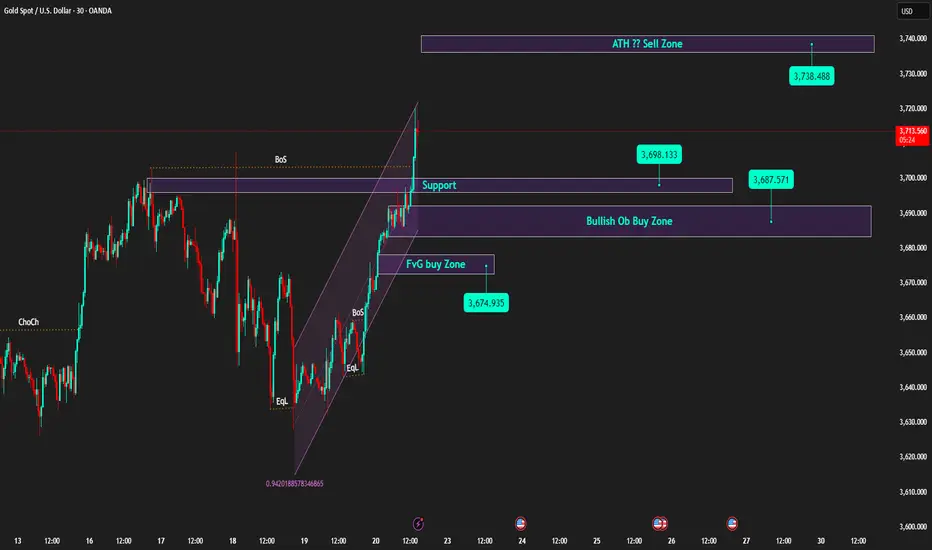
Weekly Candle Closes High | Prioritise Buying on Pullback to Sup🟡 XAU/USD – 22/09 | Captain Vincent ⚓
🔎 Captain’s Log – Quick Overview
Last week, gold closed around 3,685, paving the way for further advancement and a new ATH.
After the FED cut 25bps, Powell's 'brake' remarks slowed the rise, but the larger trend remains bullish.
This morning, prices surged to 3,697.xx, now slightly adjusting around 3,692 – 3,690 → a sensible strategy: wait for a pullback to continue Buying.
⏩ Captain’s Summary: The gold voyage still heads North, Buying remains the main choice, but wait for a pullback to board.
📈 Captain’s Chart – Technical Analysis
Golden Harbor (Support / Buy Zone):
Thin support: ~3,698 (recently broken old range top).
OB Dock: 3,687 – 3,690.
FVG Dock: 3,672 – 3,676 (liquidity check on deep pullback).
Storm Breaker (Resistance / Sell Zone):
3,714 – 3,720 (supply cluster / old ATH – likely to react).
Price Structure:
Continuous BoS series, price breaks short-term up channel and creates higher highs → bullish remains the main trend.
🎯 Captain’s Map – Trading Plan (before US session)
✅ Buy (trend priority)
Buy Zone 1
Entry: 3,698 – 3,701
SL: 3,688
TP: 3,706 – 3,714 – 3,720+
Buy Zone 2 (OB)
Entry: 3,687 – 3,690
SL: 3,680
TP: 3,698 – 3,706 – 3,714 – 3,72x
Buy Zone 3 (FVG)
Entry: 3,672 – 3,676
SL: 3,664
TP: 3,687 – 3,706 – 3,714
⚡ Sell (only scalp when overbought)
Sell Zone (ATH test)
Entry: 3,740 – 3,738
SL: 3,750
TP: 3,730 – 3,690 – 3,695
Captain’s Note ⚓
“The new week kicks off with a high-closing candle, the gold vessel continues its bullish course. Golden Harbor 🏝️ (3,690 – 3,672) is a safe anchorage for the crew to watch for Buys. Storm Breaker 🌊 (3,714 – 3,720) is the wave crest where winds may rise, suitable for Quick Boarding 🚤 short scalps. Before the US session, the seas might get choppy – hold the helm tight and manage volume wisely.”
ETHUSD 2.5R sell side trade scenarioETHUSD is forming sell side trades as current bias and draw on liquidity both are at down side. Price has also left SIBIs to attract price upside for a while and then return back to target. In weekend price may have low volatility and trade possibly generate on Monday or later.
1. There is a daily time frame bearish FVG.
2. There is bearish FVG in 4H TF. Now price is approaching it slowly.
3. These FVGs are forming inside OTE zone.
4. Order flow is bearish. And draw on liquidity is also at downside.
5. Most probably price will take liquidity of FVGs and create MSS/CISD/TS/iFVG in LTF.
6. Price should show rejection/reversal in LTF (5m,1m) at FVG zone.
7. BTC is also forming similar scenario.
All these combinations are signalling a high probability and 2.5R trade scenario.
Note – if you liked this analysis, please boost the idea so that other can also get benefit of it. Also follow me for notification for incoming ideas.
Also Feel free to comment if you have any input to share.
Disclaimer – This analysis is just for education purpose not any trading suggestion. Please take the trade at your own risk and with the discussion with your financial advisor.

BTCUSD 3R Sell side trade BTCUSD is forming sell side trade as current bias and draw on liquidity both are at down side. Price has also left SIBIs to attract price upside for a while and then return back to target. In weekend price may have low volatility and trade possibly generate on Monday or later.
1. There is a 4H time frame bearish FVG.
2. There is bearish FVG in 1H and 30m overlapping with 4H FVG. Now price is approaching it slowly.
3. These FVGs are forming inside Fib golden zone.
4. Order flow is bearish. And draw on liquidity is also at downside.
5. Most probably price will take liquidity of FVGs and create MSS/CISD/TS/iFVG in LTF.
6. Price should show rejection/reversal in LTF (5m,1m) at FVG zone.
All these combinations are signalling a high probability and 3R trade scenario.
Note – if you liked this analysis, please boost the idea so that other can also get benefit of it. Also follow me for notification for incoming ideas.
Also Feel free to comment if you have any input to share.
Disclaimer – This analysis is just for education purpose not any trading suggestion. Please take the trade at your own risk and with the discussion with your financial advisor.

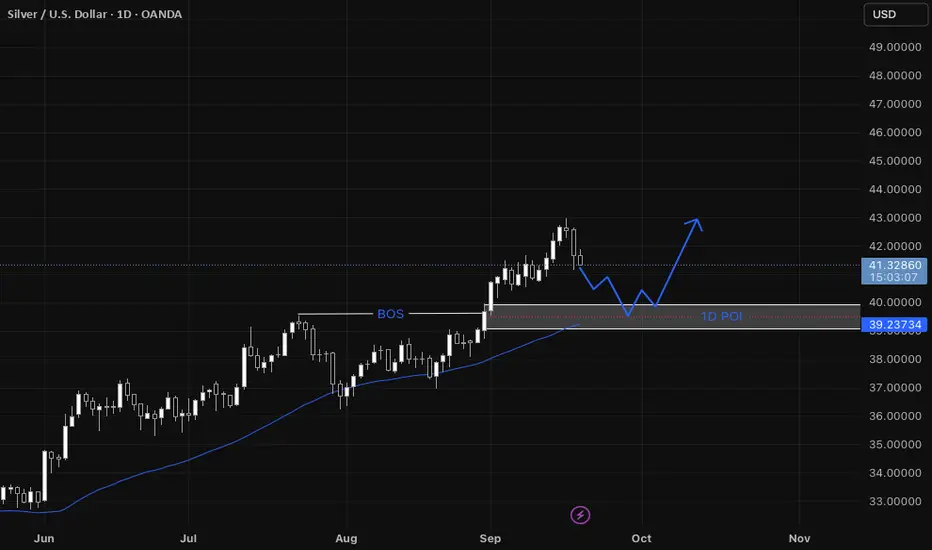
XAGUSD Step-by-step entry plan for XAGUSD
1. We have our Daily Point of Interest (POI)
- On the daily a zone that contains:
* a fair value gap (FVG),
* a break of structure (BOS) that previously acted as resistance and is now expected to act as support, and
* support from the 44 SMA.
2. Wait for price to return to the Daily POI
- Only consider the setup if price actually comes back into that daily POI zone.
3. Switch to the 1-hour timeframe to refine the entry
- Look for a shift in structure on the 1-hour (i.e., evidence that momentum is shifting bullish: BOS to the upside, higher highs/higher lows).
4. Confirm a 1-hour fair value gap forms
- The structure shift on 1-hour should create a 1-hour FVG (a short intraday imbalance).
5. Wait for the 1-hour FVG to be filled
- Let price fill that 1-hour FVG (price moves into/through the gap).
6. Look for a bullish confirmation on the filled 1-hour FVG
- After the fill, require a clear bullish formation on 1-hour (examples: bullish engulfing candle, strong demand candle, a higher-low + rejection wick).
7. Enter on the 1-hour bullish confirmation
- Enter when price breaks the confirmation level (e.g., breaks above the local 1-hour high formed by the bullish setup) or on a confirmed bullish candle close per your entry rules.