EURUSD ORDER BLOCK | LONG TRADEHi Trader
Eurusd taken previous 1hr and 4hr liqduity so Buying expected
according to SMC.
5 min CHoCH is best to take Long trade
1:7 Trade
Note - Only for education purpose
GIVE LIKE IF YOU LIKE MY ANALYSIS..
Smctrading

USOIL ORDER BLOCK | LONG TRADE [SWING TRADE]Hi Traders,
This is Usoil 1hr + 4Hr Order block trade we can see Buying from
this level..
At this level we can see some Liquidty pool.
Here we can take trade with 5 min CHoCH.
5 min CHoCH is best to take Long Trade
Note - Only for education Purpose
Follow for Daily Forex Update

XAUUSD ORDER BLOCK | BUYING TRADEHi Traders
This Area is 4Hr Order block according to SMC.
2316 to 2305 This is Liquidity Pool we can see
upside movement after taking this liquidity.
Best time to take trade is 5 min CHoCH but after Rejection.
Note - Only for education Purpose

EURUSD 1HR ORDER BLOCK | SHORT TRADEHi Trader
Eurusd taken previous 1hr and 4hr liqduity so selling expected
according to SMC.
5 min CHoCH is best to take short trade
Note - Only for education purpose

NZDUSD ORDER BLOCK | 1 HR POINZDUSD ORDER BLOCK | 1 HR POI
Hi traders..,
This is Nzdusd 1hr POI Liqudity taken now
we will see selling from 0.60170 level this best selling setup.
5 min choch best to take trade..
Note - Only for education purpose

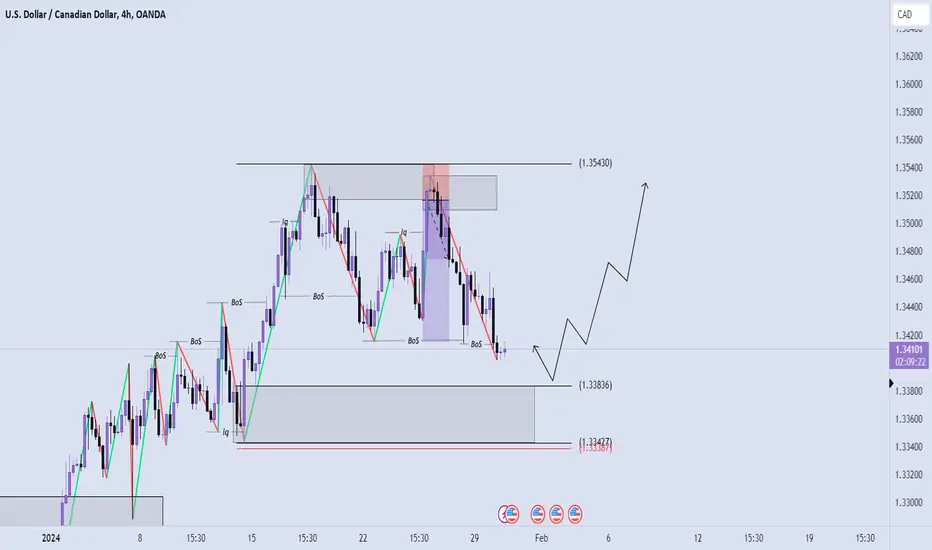
USDCAD 1hr Bearish Order Block | 1:10 Trade Almost Hi Traders
This Usdcad 1hr Bearish Order Block at this level we can see some Liquidity
Then Cad goes down. This is best trade because it's 1:10 trade.
Note - only for education Purpose..💯
Give like share and follow

USDJPY ORDER BLOCK | BUYING TRADEHi traders,
This USDJPY 4 hr Order block.
According to smc concept we can see Buying from this level.
if you see 15 min CHoCH is best for entry.
Note - Only for education purpose
If you like my anaylsis then you should like and follow me.

Usoil 1hr POI | Forex Best TradeHi trader
This 1hr POI USOIL Taken Previous day liquidity (16/04/2024).
I expect Buying from this level
Note - Only for education purpose.

NIFTY 50 VIEW FOR 9th APRIL 2024Nifty has been showing some strength now. Expecting it to continue moving up and create new ATH and make a new one. It can test the marked Demand zone 1 ( 22530 - 22459 )or Demand zone 2 ( 22193-22088) and then move up to take the ATH too.
THIS IS MY PERSONAL ANALYSIS FOR MY PERSONAL TRADING.

MIDCAP 150, 8th APRIL 2024Midcap Index is again approaching towards the ATH.
No major Demand zones have formed recently, so we can expect the price to take some support from the EMA's or the Demand zone marked ( 17821- 17677) and move up higher.
THIS IS MY PERSONAL ANALYSIS FOR MY PERSONAL TRADING NOT A TIP OR ANY TRADE RECOMMENDATION.

FIN NIFTY 8th APRILFin Nifty has a bullish bias. We can expect the price to move up and target the ATH. We can see a pullback to the demand zone(20856 - 20738) too before it starts showing it's strength.
It may not test the demand zone and make a new ATH too since momentum is there.
THIS IS MY PERSONAL ANALYSIS FOR MY PERSONAL TRADING, NOT ANY TRADING TIP OR RECOMMENDATION.

Bank Nifty 5th AprilBank Nifty has a bullish bias. We can expect the price to move up and target the ATH. We can see a pullback to the demand zone(47181 - 46997 ) too before it starts showing it's strength.
Im Not SEBI Registered
This Is My personal analysis for my personal trading

NIFTY MIDCAP 150 VIEW FOR 26.MARCH.2024Midcap Index is facing heavy Sell offs.
Expecting the price to show a small pullback and continue moving down.
It is testing the FVG (17180 - 17620) before making further LL's.
THIS IS MY PERSONAL ANALYSIS, FOR MY PERSONAL TRADING.
IM NOT SEBI REGISTERED.

NIFTY FIN VIEW FOR 26.MARCH.2024Fin Nifty has covered the Imbalance. It also tested Demand zone ( 20485 - 20235 ) and then trying move up higher to fill the Gap area .But looking at the market conditions, it looks like it can break the Demand zone and move down lower.
THIS IS MY PERSONAL ANALYSIS, FOR MY PERSONAL TRADING.
IM NOT SEBI REGISTERED

BANK NIFTY VIEW FOR 26 MARCH 2024Bank Nifty has covered the Imbalance (46345 - 46981 ) on the down side. It has also spend some time inside the Demand zone marked and now slowly slowly move up towards the high.
THIS IS MY PERSONAL ANALYSIS, FOR MY PERSONAL TRADING.
IM NOT SEBI REGISTERED.

NIFTY 50 VIEW FOR 26 MARCH 2024Nifty making simple LL,LH structure . Expecting it to continue moving down by testing the Supply zone ( 22134 - 22197 ) marked on the picture. If the Protected Swing high get's taken out, we'll change our bias to bullish again.
This is my personal analysis, for my personal trading
Im not SEBI Registered.

FIN NIFTY Analysis For Today 19th March 2024Fin Nifty is showing a pullback now. Expecting the market test the Demand zone ( 20485 - 20235 ) and then move up higher to fill the Gap area .But looking at the market conditions, it looks like it can break the Demand zone and move down lower.
Im Not SEBI Registered.
This Is My Personal Analysis For My Personal Trading.
Im Sharing It Here On Behalf Of Experience.

Bank Nifty Analysis For 19th March 2024Bank Nifty has made a lot of Imbalance (46345 - 46981 ) to be filled on the down side. spend some time inside the Demand zone marked and then slowly move up towards the high. But looking at the market conditions, it looks like it can break the Demand zone and move down lower.
This is my personal Analysis for my personal trading.
Im Not SEBI Registered.

NIFTY 50 Analysis For Today 19th March 2024Nifty made a simple LL . It has also tested the FVG ( 22129 - 22222) marked on the picture and next expectation will be that it shall take out the LL (21903) liquidity next.
This Is My Personal Analysis For My Personal Trading.
Im Not Sebi Registered.

NFL - OB GAMEIn the current market scenario it will be difficult to find Volume Dry up or Squeeze Setup Daily.
Will be posting mainly the OB Setups for a few days.

NIFTY SmallCap 250 | Index To WatchSmall cap Index is facing heavy Sell offs.
Expecting the price to show a small pullback and continue moving down.
It might test the FVG (14278 - 14495) before making further LL's.

Gold Order Block in 1HR | Look BulishIn gold form order block in 1hr time frame and also long 4hr order block is there.
if you are trading in gold so Look for Buy
LIKE,SHARE,FOLLOW
( mentor of your mentor)

USDCAD TRADE IDEApossible USDCAD trade scenario enter with ltf confirmation if taken direct entry manage your risk properly 1:2-3 RR as this week is full of HIGH IMPACT NEWS enter at your own risk
indicator based SMC approach. follow and like for more such setups