$PUMP MACRO SETUP | 1,000%+ UPSIDE IF HTF BASE HOLDSNYSE:PUMP MACRO SETUP | 1,000%+ UPSIDE IF HTF BASE HOLDS
#PUMP Is Trading Inside A HTF Accumulation Zone After Completing A Long-Term Descending Wedge, Signaling A Potential Macro Trend Reversal.
Technical Structure:
✅ Multi-Month Descending Wedge Breakout Confirmed
✅ Clean Breakout + Retest Of HTF Neckline
✅ Inverse H&S Pattern NeckLine Very Close to Breakout
✅ Strong Demand Holding Inside $0.0025 – $0.0022
✅ Structure Invalidate Below $0.00168 (HTF Close)
✅ Sustained Acceptance Above Accumulation Signals Continuation
CryptoPatel Expansion Targets: $0.00504 → $0.00867 → $0.01500 → $0.02297+
High R:R Setup If HTF Demand Holds And Expansion From The Base Continues.
❌ Invalidation: HTF Close Below $0.00168 Opens Downside Risk And Invalidates The Reversal Structure.
TA Only. Not Financial Advice. ALWAYS DYOR.
SOL

$PUMP PRICE OUTLOOK | 500%–1000% POTENTIAL? #PUMP Is Trading In A Bullish Expansion Zone After Breaking Long-Term Descending Resistance On The Daily Chart.
Price Has Completed A Prolonged Distribution → Correction Phase And Is Now Showing Early Reversal Signals.
Current Technical Structure:
✅ Long-Term Descending Trendline Break Confirmed
✅ Descending Wedge Breakout Structure
✅ Strong HTF Demand Zone Holding (0.0023–0.0021)
✅ Multiple Support Reclaims Indicate Accumulation
✅ Strength Signal: Bullish Above $0.0021
CryptoPatel Targets: $0.00449 / $0.00644 / $0.00872 / $0.015 / $0.026
As Long As PUMP/USDT Holds Above $0.0021, The Bullish Bias Remains Intact.
This Is A High-Risk, High-Reward Accumulation Setup With Asymmetric Upside Potential.
Invalidation: Daily Close Below $0.0021
TA Only. Not Financial Advice. DYOR.

$ONDO PRICE FORECAST | IS $7.65+ POSSIBLE? | CRYPTOPATEL TALSE:ONDO Is Trading At A High-Timeframe Fibonacci Demand Zone, Holding The 0.618 Retracement (~$0.45) After A Deep Corrective Move — A Textbook Accumulation Structure.
Technical Structure
Accumulation Zone: $0.40–$0.45
Bullish Order Block / Deeper Demand: $0.25–$0.30 (0.786 Fib)
HTF Structure Remains Valid Above $0.25
Structural Flip Can Trigger Impulsive Expansion
Price Targets: $0.82 → $1.20 → $2.15 → $7.65+
As Long As Demand Holds, ONDO Remains Positioned For A Multi-Leg Cycle Expansion With 2000%+ Upside Potential.
Accumulation Phase In Progress — Patience Is Key.
Technical Analysis Only | Not Financial Advice

Will SOLANA potentila to $1000?Many people are emotionally attached to Solana and the $1,000 target and that may be possible long term.
But markets never move straight up.
Corrections are part of every cycle, and CRYPTOCAP:SOL is currently in a correction phase.
If the $120 support breaks, I’m expecting SOL to drop below $100.
A move under $100 could offer a strong long-term accumulation opportunity.
My accumulation zone: $98 – $50
Long-term outlook: $500 – $1,000
Crypto is highly volatile and risky.
Always DYOR, manage risk properly, and this is not financial advice (NFA).

BTC Dominance Crashes Below EMA50: Altseason Countdown StartedBTC Dominance Crashes Below EMA50: Altseason Countdown Officially Started.
Bitcoin Dominance is set to close another weekly candle below the EMA50, confirming the trend shift we’ve been tracking since April–May 2025. The rejection happened exactly at the same technical point highlighted months ago and once again, BTC.D has broken its support trendline and failed the bearish retest.
This structure is:
Weekly close below EMA50 → structural weakness
Bearish retest rejection → continuation signal
Trendline breakdown → momentum shift away from BTC
If Bitcoin simply stops dumping, the setup for alts becomes explosive. The liquidity rotation is already visible under the surface and historically, this is where altcoins begin their strongest multi-month expansions.
I’ll repeat what I’ve been saying:
A massive Altseason is around the corner.
Based on the technical roadmap, Bitcoin Dominance sliding into the 48%–40% zone would mark the final leg of a full-scale altcoin cycle and likely our ideal exit region for major alt positions.
Stay ready. The next 12 months could be the biggest window for altcoin outperformance in years.
NFA & DYOR

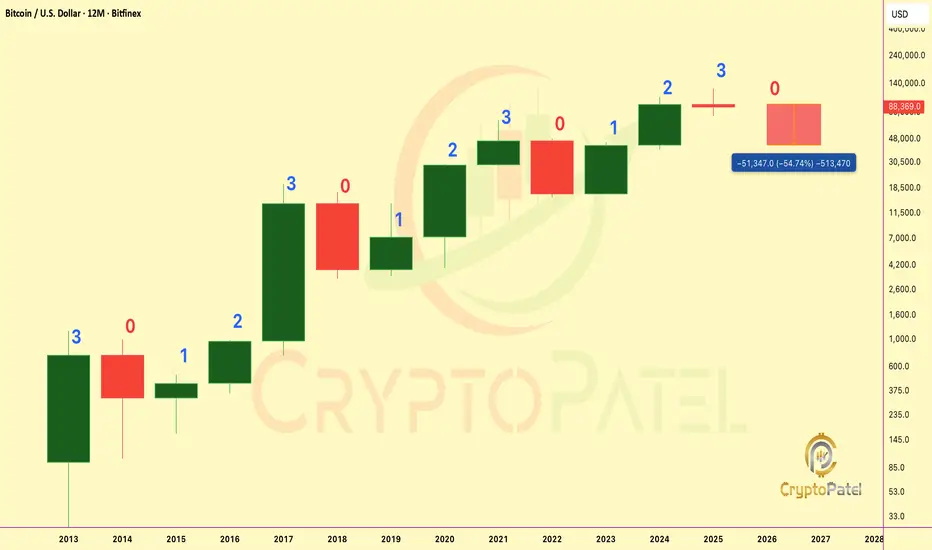
Bitcoin Most Critical 40 Days of the Entire Cycle🚨 Bitcoin Most Critical 40 Days of the Entire Cycle 🚨
CRYPTOCAP:BTC Yearly Fractal is clear: RED → 3 GREEN → BIG RED.
2025 = Candle 3, historically the strongest and always breaks ATH.
Bitcoin can hit a new ATH ONLY this year.
If BTC does not break ATH in the next 40 days, history shows it never breaks the 3rd candle high the following year: Meaning 2025 becomes the cycle top, and 2026 turns into a 50–70% retracement year ($30k–$40k).
✔ Break ATH → $150k–$180k
❌ No ATH → Biggest Correction of the Cycle in 2026
NFA & DYOR
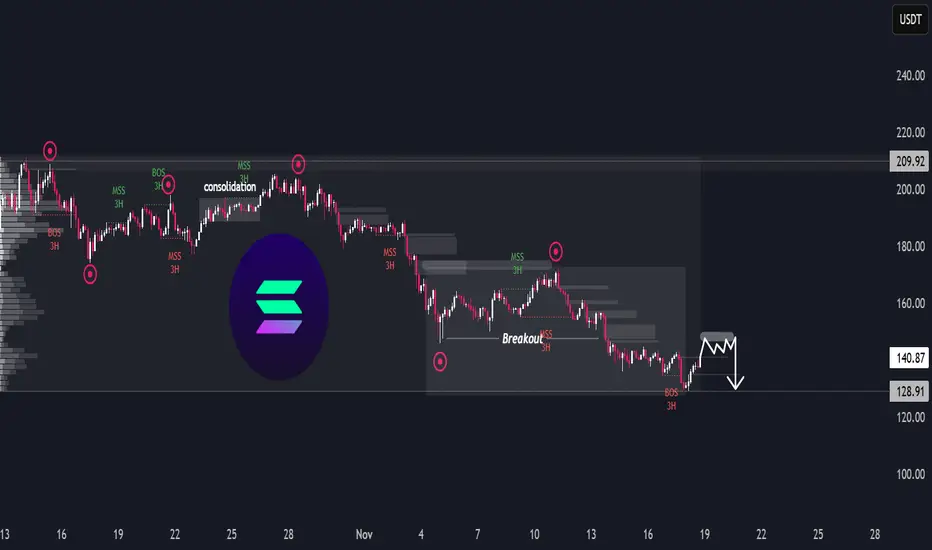
SOL/USDT – Downside LoadingSOL/USDT – Downside Loading
The chart shows a prolonged distribution phase followed by a steady macro decline, with multiple structure breaks confirming a persistent bearish flow. After the earlier consolidation in the upper range, each attempt to reclaim previous highs has been met with a shift in momentum, leading to progressive downside sequences.
The recent breakout from the lower range transitioned into continued weakness, indicating sellers remain in firm control. Despite short-term rebounds, the overall behaviour reflects a market that is unwinding previous demand zones rather than building new ones.
At the current level, SOL is forming a tight corrective pattern, suggesting price is building liquidity before the next directional move. Given the broader trend context, this type of compression typically precedes continuation rather than full reversal. The chart’s projection implies a potential liquidity sweep on the minor rally, followed by renewed downside pressure once short-term buyers are exhausted.
Overall, the environment still favours the bearish continuation scenario unless the market shows a decisive shift in character backed by sustained strength — something not yet present.
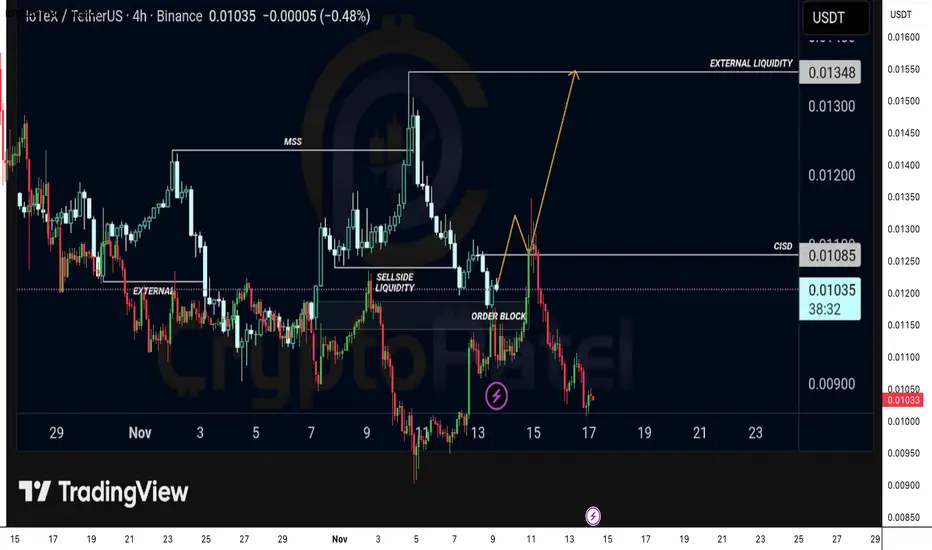
$IOTX / USDT – High Conviction Long SetupCRYPTOCAP:IOTX / USDT – High Conviction Long Setup
Price has already swept sell side liquidity and tapped directly into a fresh bullish Order Block. A decisive candle close above the CISD level at 0.01085 signals strong bullish intent and opens the path toward external liquidity sitting at 0.01348.
Entry 0.01085 | SL 0.00915 | Targets 0.01180 /0.01280 / 0.01348
This setup offers a clean draw on liquidity with an attractive risk to reward profile. If price reclaims CISD with momentum, the upside expansion can be rapid.
Trigger Wait for confirmation above CISD
Note: NFA & DYOR
BITCOIN CME Gap Alert: CME GAP around $91000BITCOIN CME Gap Alert:
As per CME chart, Bitcoin still has an unfilled gap between $91,970 – $92,730.
In my opinion, BTC must revisit around $91,970 to fully close this gap.
Price usually returns to CME gaps because they act as liquidity zones and market inefficiencies, the market tends to fill them before continuing the main trend.
NFa & DYOR

#BITCOIN TECH UPDATE: BEARISH IN CONTROL#BITCOIN TECH UPDATE: BEARISH IN CONTROL
CRYPTOCAP:BTC is down 14% from $115K retest, clean rejection.
Trend remains bearish, structure forming lower highs & lower lows.
Key Zones:
Relief zone: $105K–$108K (short setup area).
Major support: $94K → break below = $76K next.
Momentum:
Selling pressure dominates; no bullish divergence yet.
Invalidation:
Only a close above $111.5K flips bias bullish toward $150K. ( Super Bullish Above $116.5K)
Plan:
Sell rallies. Manage risk. Avoid FOMO longs.
NFA & DYOR

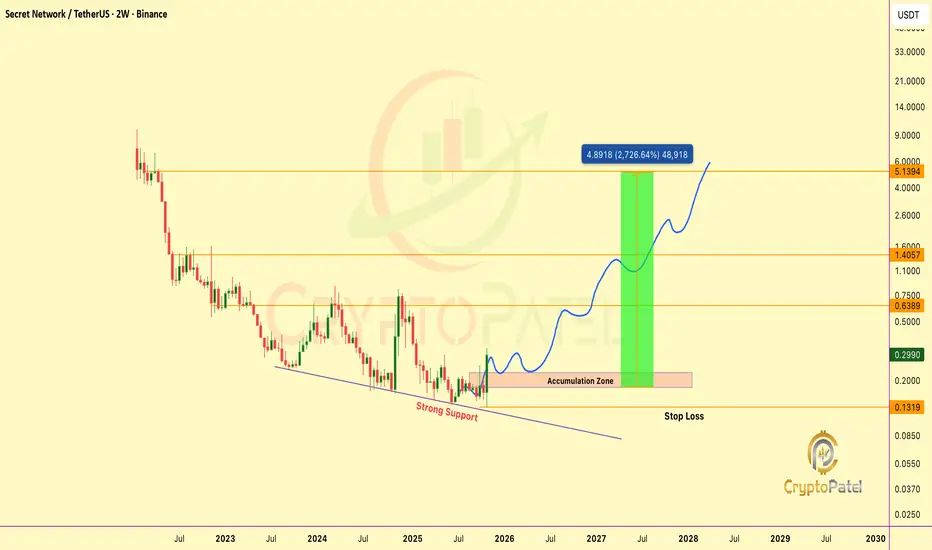
The calm before the storm… $SCRT is getting ready to flyThe calm before the storm… $SCRT is getting ready to fly
#SCRT is showing a strong technical reversal from its multi-year support, forming a clean accumulation base that signals smart money loading up.
Best Accumulation Zone (IMO): $0.24 – $0.18
Once this range holds, we could see a massive breakout kicking off a new macro bull cycle.
Targets:
$0.64 → $1.40 → $5.13+ 🚀
If momentum builds and the team keeps delivering, $5–$10 is possible in the future. This setup is low-risk, high-reward, but always manage your risk, charts show probability, not guarantees.
Smart accumulation today could turn into huge gains tomorrow.
⚠️ Not financial advice. Always DYOR & manage your risk.
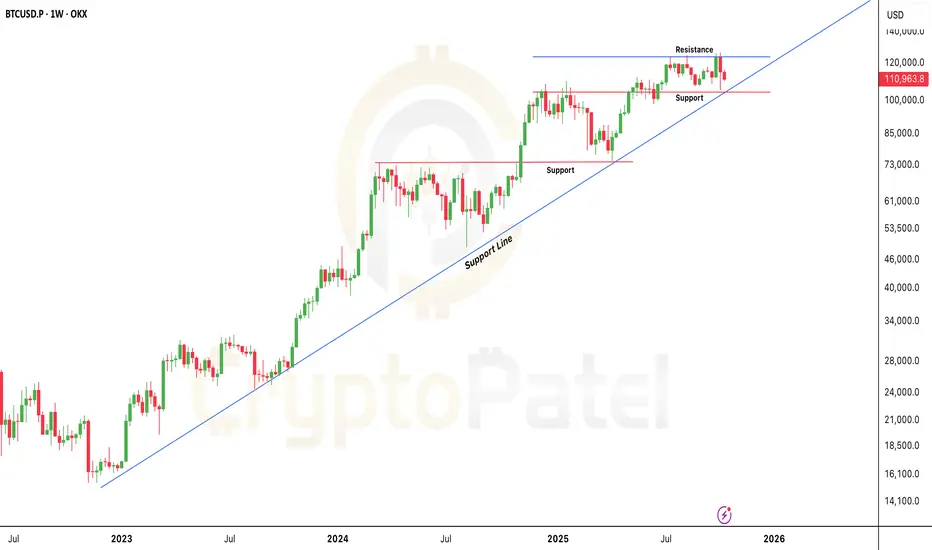
BTC First Weekly BB Break Since March: This Changes EverythingFirst Weekly BB Break Since March: This Changes Everything!
Bitcoin is currently testing a key support zone around $104K, forming what appears to be the 5th major support retest in this ongoing bullish cycle.
Historical Pattern Insight:
Each of the previous four support retests (1–4) led to substantial rallies ranging from +70% to +200%, as shown in the green zones.
If the pattern repeats, the next potential upside move (Wave 5) could project CRYPTOCAP:BTC toward the $200K region, marking a ~100% upside from current levels.
New Technical Development:
This week marks Bitcoin’s first breach of the lower Bollinger Band (BB) on the weekly timeframe since March, signaling heightened volatility and potential exhaustion of the current corrective phase.
Bearish Scenario:
A confirmed breakdown below this critical support could trigger a deeper correction toward the $50K area (–55%), similar to previous cycle corrections highlighted in red.
Key Levels to Watch:
🔹 Support: $103K–$100K
🔹 Resistance: $110K, then $135K
🔹 Upside Target: $200K
🔹 Downside Risk: $50K
Indicators:
Bollinger Bands remain squeezed, indicating volatility expansion is near. The weekly mid-band continues to act as dynamic support, but a sustained close below it could shift the bias short-term.
🟩 Bullish Bias remains valid above $100K, invalidated only on a weekly close below support.
🟩 Pattern repetition or deviation here will define Bitcoin’s next macro leg.
NFA & DYOR

THE ENTIRE MARKET IS ABOUT TO HARD DUMPTHE ENTIRE MARKET IS ABOUT TO HARD DUMP
If #Bitcoin holds the $107K–$104K support: next stop $150K 🚀
But if it fails… prepare for a hard dump toward the $80K zone 😳
This is the make-or-break level.
NFA & DYOR

SOLANA 27,560% CYCLE IS ABOUT TO REPEAT - $9,200 TARGET BY 2029 SOLANA 27,560% CYCLE IS ABOUT TO REPEAT - $9,200 TARGET BY 2029
Previous Bull Cycle Metrics:
1️⃣ Duration: 1,492 days
2️⃣ % Gain: 27,560%
3️⃣ Price: $1 → $295
Now here's where it gets CRAZY...
IF we get a healthy retracement to the golden pocket ($60-$35), and IF the fractal repeats:
1️⃣ Bottom: $60-$35
2️⃣ Same % gain: 27,560%
3️⃣ Same timeframe: 1492 days (Feb 2029)
This is Wyckoff accumulation into parabolic expansion.
The risk/reward is GENERATIONAL
Bookmark this. Screenshot this. Thank me in 2029.
This is just my math based on past fractals & returns. Not financial advice - DYOR

Bitcoin Is Flashing a Major Warning Signal Right NowBitcoin Is Flashing a Major Warning Signal Right Now ⚠️
KEY LEVELS:
Resistance: $123K (triple top) & $115.9K barrier
Support: $106K - CRITICAL level
BEARISH PATH (if $106K breaks):
→ Target 1: $91K (-18%)
→ Target 2: $79K (-28%)
BULLISH SCENARIO:
Reclaim $115.9K & break $123K to invalidate bearish structure
STRUCTURE ANALYSIS:
▶️ Lower highs forming = Reversal signal
▶️ Weakening momentum post- New ATH
▶️ Distribution pattern visible at resistance
STRATEGY:
✅ SHORT: Below $106K | Targets: $91K-$79K
✅ LONG: Above $115.9K | Stop: $106K
The chart doesn't lie. $106K is the line in the sand.
Risk management > predictions.
Trade smart. Adapt fast. Survive longer.
CRYPTOCAP:BTC #Bitcoin
NFa & DYOR

If Bitcoin Loses This Level: Expect the Biggest Correction YetIf Bitcoin Loses This Level: Expect the Biggest Correction Yet
Current Market Overview:
Bitcoin is trading above $110,000, maintaining a bullish stance for now. However, short-term momentum looks weak as the market tests crucial support levels.
Key Support Zone:
The most critical area to watch is $104,000 – $105,000.
This zone aligns with the long-term bullish trendline, which has held firm through multiple market corrections.
As long as price stays above this trendline, the broader trend remains bullish.
Bullish Scenario:
If Bitcoin holds above the $104,000 support level, it signals strength and potential continuation of the uptrend.
In that case, the next upside target remains around $150,000 in the coming months.
Bearish Scenario:
If the $104,000 trendline breaks decisively, Bitcoin may enter a deeper correction phase.
Downside targets could extend to below $100,000, and in a worst-case scenario, even toward $80,000.
Technical Summary:
🔹 Immediate Resistance: $110,000 – $112,500
🔹 Major Support Zone: $104,000 – $105,000
🔹 Trend Bias: Bullish above $104,000 | Bearish below $104,000
🔹 Long-Term Target: $150,000 (if support holds)
Trading Insight:
This is a decisive zone for Bitcoin. Bulls must defend $104k to maintain structure.
Below it, expect volatility and potential trend reversal signals.
NFA & DYOR
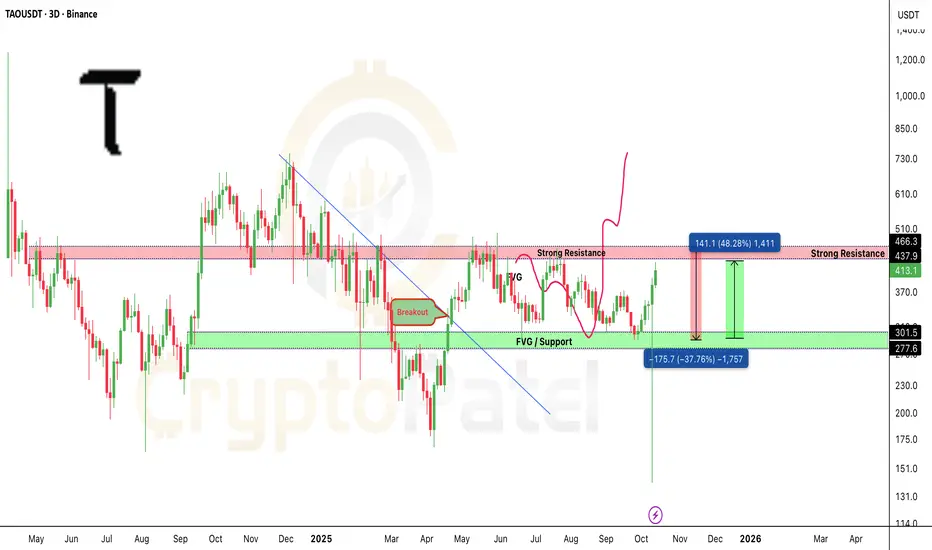
TAO/USDT did as I Mentioned and Now ready to $1000?GETTEX:TAO Update 🚀
Our $300–$250 entry got filled perfectly during the retracement, just as planned.
Now GETTEX:TAO is up 48% from our accumulation zone and momentum looks strong.
Technically, structure is still bullish:
✅ Strong Bounced Back
✅ Volume expansion
✅ FVG confirmation
I’m eyeing $1000 as my first major target in this bull run.
Smart Money bought the dip. Now the trend does the talking.
NFa & DYOR
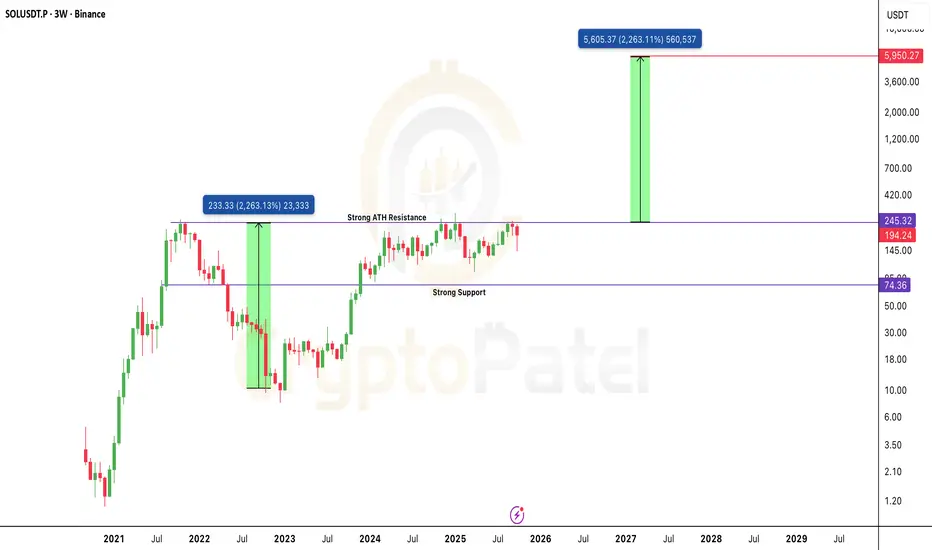
The Chart That Could Send $SOL to $6,000: Cup & Handle on 3W TFThe Chart That Could Send CRYPTOCAP:SOL to $6,000: Cup & Handle on 3W Timeframe
Solana is shaping one of the cleanest Cup & Handle patterns on the 3-Week chart, a formation that often signals the start of a massive long-term rally.
Technical Structure
🔹 Cup formed: $260 → $8 → back to $245 — a perfect rounded recovery base.
🔹 Handle forming: Price consolidating between $140–$245, building pressure before breakout.
🔹 Breakout trigger: Clean close above $245 (ATH zone) will confirm the move.
🔹 Targets:
– First target: $480–$500
– Extended target: $2,000–$6,000 if momentum mirrors the last 2200% run.
🔹 Major Support: $74–$90 zone.
What this really means: Solana is quietly preparing for its next macro expansion phase.
A confirmed breakout above ATH could kickstart one of the strongest alt rallies of this cycle.
Bias: Bullish on breakout confirmation
Timeframe: 3W / Long-Term Swing Setup
Plan: Watch $245 zone closely, breakout with volume = game on.
Note: NFA & DYOR
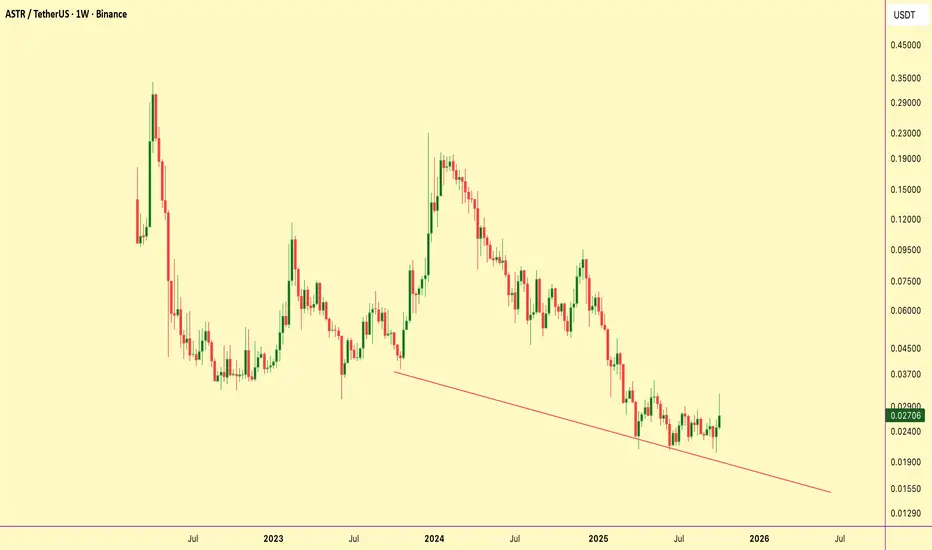
$ASTR gearing up for a breakout from key Order Block!RUS:ASTR showing strong bullish continuation signs on the 4H chart.
Entry Zone: 0.02567 (Bullish Order Block)
Stop Loss: 0.02406
Target: 0.03177 (Liquidity Pool Above)
Technical Breakdown:
🔹 Price broke out with clear bullish displacement after a period of consolidation.
🔹 Now retracing back into a key order block, offering a potential re-entry zone for continuation.
🔹 Liquidity resting above 0.03177 acts as a magnet for price — expect draw-on-liquidity play.
🔹 Market structure is still printing higher highs and higher lows, confirming bullish bias.
Bias: Bullish
Strategy: Order Block Re-entry (4H)
Plan: Wait for confirmation at OB zone before executing longs for continuation toward liquidity target.
Smart Money traders, keep this setup on radar. DYOR, NFA.
BNB 400% up from our Entry People laughed when I said CRYPTOCAP:BNB will hit $2000–$3000.
but people still doubt my $2000–$3000 targets? 🤔
From 1st Entry of this bull run: +400% ( TP1 ✅ )
From $500 re-entry: +120%
You can doubt targets, but not momentum.
Just don’t forget — book profits.
Because trading without a safe zone = casino mode.
Not Financial Advice

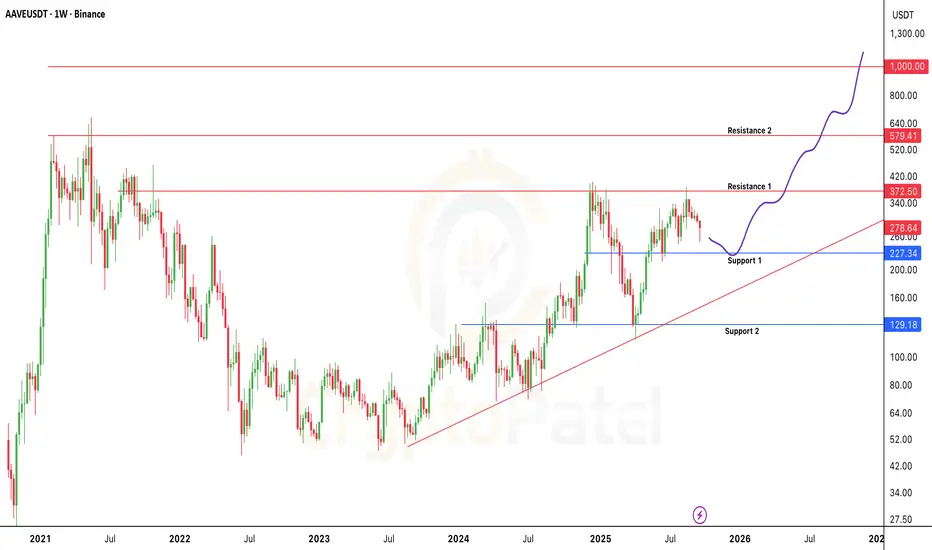
AAVE/USDT Potential to hit $1000Why CRYPTOCAP:AAVE could hit $1000 🚀
V4 launch: Major upgrade boosting fees, TVL & adoption
GHO stablecoin grows, adding revenue
Buybacks + more liquidity driving value
Bear Case:
If Market crash then We can see $200-$150
AAVE has the potential to explode, but watch these risks.
NFA & DYOR
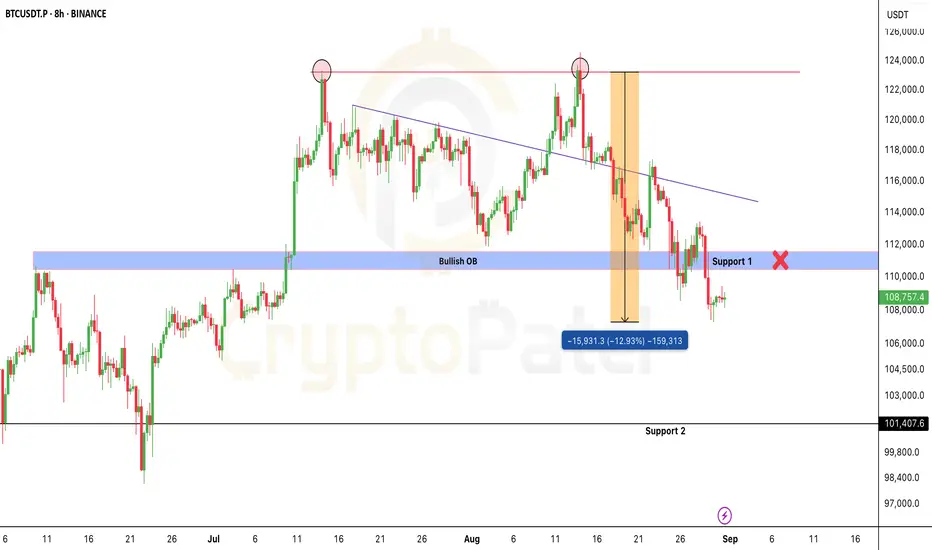
Bitcoin Chart Analysis And Bearish overview #BTC Bearish Outlook
Bitcoin stays bearish below $113,400.
No H4 close above = downtrend intact, targeting the $100K psychological level.
Break $100K support, and liquidity near $90K becomes the next magnet.
Key levels:
$113,400 → HTF resistance
$100,000 → Psychological support
$90,000 → Demand zone
Already 13% down from our short entry, hope you caught the move. 🫡
NFA & DYOR
Solana: The Scam or the Breakthrough? | PipGuardSolana: The Scam or the Breakthrough?
Hello there, my colleagues, welcome back!
Article published by PipGuard™ on the TradingView® platform – to continue this free publication, LEAVE A BOOST and a COMMENT, hit the notification bell, and never miss ANOTHER ANALYSIS.
ANALYSIS
Hello everyone,
I know many of you appreciate my analyses, and I thank you for the support. As you know, I spend most of my time on the charts, looking for the best trading opportunities. To avoid missing updates, I recommend you turn on notifications!
Solana, with its ambiguous name, raises a question. Is it the “scam” that will ruin you or the “breakthrough” that will make you take the great leap? Regardless of preferences, what matters is the profit potential.
The Trend to Watch
Solana's dominant trend is clearly bullish. Our focus must remain on growth, but without underestimating possible downside scenarios.
Currently, the price is going through a bullish accumulation phase. There's liquidity to be filled, and we need to keep an eye on two critical levels very close to $210 . This is our support and resistance zone.
Below $210, the risk of a downward correction increases.
Above $210, the bullish trend strengthens.
A possible retracement could push the price into the $175-$160 zone. Here, the market will decide whether to continue falling or resume its upward run.
If Solana breaks above $210 without a retracement, the bullish target remains the $260 zone.
In short, the key levels:
Bullish target: $260
Bearish target: $175-$160
Support/Resistance zone: $210
NEWS
✅ Galaxy Digital, Multicoin, and Jump Crypto are aiming for a $1 billion treasury in Solana, the largest ever seen in the sector.
✅ Sharps Technology soars 70% after raising $400 million for a treasury entirely in Solana, featuring giants like Pantera and ParaFi.
SECRETS
🔓 The return of the Coinbase hacker: a wallet linked to the $300M mega-heist on Coinbase is back in action, buying 38,126 SOL ($8M) around $209.
🔓 The dark side of meme-tokens: on the Solana network, the Kanye West token burned $75M in a week, crashing by 80%. Those who believed in it are now left with worthless paper.
GREETINGS
Remember to leave a GREETING 🚀 or a COMMENT — not because I really need it, but because it's cool to support the one who brings you these bombshells while you're having your coffee.
Talk to you soon,
PipGuard
Article published by PipGuard™ on the TradingView® platform
