Will $ONDO Potential to hit $5?#ONDO Has Been In A Brutal ~90% Drawdown From Its ATH ($2.15) Over The Last 14 Months But This Is Where Generational Entries Are Made.
Price Is Sitting At A HTF Fibonacci Demand Zone With Strong Accumulation Structure Forming 👇
✅ ATH: $2.15 (14 Months Ago) & Current ~90% From ATH
✅ Price Sitting Inside Strong Bullish OB: $0.19–$0.24
✅ Deeper Demand / 0 Fib Retracement: $0.171
✅ HTF Market Structure Valid Above $0.170
✅ Turn Fully Bullish Above $0.47 (Structure Flip Zone)
✅ Classic Wyckoff Accumulation Phase In Play
⚠️ Breakdown Below $0.171 = Final Support Invalidated
Upside Targets (If Structure Flips Bullish): $1.00 (5x) ➔ $2.15 (ATH 10x) ➔ $5.00+ Full Cycle Expansion (2500%+)
Pro Positive Point:
Do You Know Trump’s World Liberty Financial (WLFI) Bought LSE:ONDO At $1.374 And You’re Getting It Around $0.20, Which Is ~85% Down From Trump’s Entry.
WLFI Holdings: $470,000 Invested For ~342,000 ONDO Tokens.
Thesis:
RWA Narrative Leader Trading At A High-Confluence Demand Zone – Fibonacci + Bullish OB + HTF Support All Stacking.
If Structure Flips Above $0.47, This Sets Up For A Multi-Leg Parabolic Move.
IMO: LSE:ONDO Is Currently On Sale With A ~90% Discount.
TA Only | NFA | Always DYOR
💬 Your LSE:ONDO Target? 👇
❤️ Like + RT + Bookmark
Solana

$ADA ALTSEASON SETUP | 4,500%+ EXPANSION IF SUPPORT HOLDSCRYPTOCAP:ADA ALTSEASON SETUP | 4,500%+ EXPANSION IF SUPPORT HOLDS
#ADA Is Trading Inside A HTF Bullish OB After A ~93% Corrective Move From Its Local Macro High, Positioning Price At A Critical Accumulation Vs Invalidation Zone.
Technical Structure
✅ Previous Cycle ATH At $3.1 (+1,300% Expansion)
✅ BIG Correction PHASE: −78% From $1 Local High Within Last 6 Months
✅ Multi-Year Strong Support Holding Above $0.24 Level
✅ HTF Bullish OB Active At $0.18–$0.13
✅ Structure Remains Bullish As Long As $0.13 Holds (HTF Close)
✅ Strict STOP LOSS For High Risky Trader: $0.0755 (HTF Close)
Historical Context:
2021 Bull Run: +3,400% Expansion To $3.10
2021-2026 Correction: -92.89% Decline Into Accumulation Phase
HTF Demand Zone: $0.18–$0.13 (Accumulation & Liquidity Absorption)
Reclaim Zone: $0.4374 (Trend Confirmation Area)
Bull Market Expansion Targets: $1.20 → $3 → $5 → $10+ (Full Cycle Expansion Projection)
This $0.18–$0.13 Zone May Be The Last Accumulation Opportunity For ADA Bulls Before The Next Parabolic Phase.
Invalidation: Weekly Close Below $0.13
Disclaimer: This Is TA Only. Not Financial Advice. Always Do Your Own Research And Manage Risk.

$HYPE MASTERCLASS: 60% DOWN, 86% UP From My AnalysisGETTEX:HYPE MASTERCLASS: 60% DOWN, 86% UP - THIS IS WHY YOU FOLLOW THE CHARTS
Remember My Analysis? Let me Break Down the FULL Trade:
WHAT I CALLED ON 23 OCTOBER 2025:
➜ SHORT Setup Signal at $50
➜ Predicted Dump to $20
➜ Marked $20-$15 as PRIME Accumulation Zone
WHAT HAPPENED:
✅ Price dumped EXACTLY to $20
✅ 60% profit on SHORT from $50 to $20
✅ Strong Bounce from Predicted Accumulation Level
Now Trading at $35-$38 Which is 86% Profit on LONG From $20 Entry.
THE RESULTS:
If You Followed the Complete Plan:
✅ Booked 60% SHORT Profits
✅ Flipped to LONG at $20
✅ Now Sitting on 86% SPOT Gains (No Leverage!)
THE LESSON: This is What SMART Trading Looks Like:
Don't Buy Tops
Don't Sell Bottoms
NO FOMO
LONG TERM POTENTIAL: $50 / $100 / $200 / $500
Did You Catch BOTH Moves?
Not financial advice. ALWAYS DYOR.

CALLED ETH CRASH AT $3,700. NOW 65% DOWN. CALLED ETH CRASH AT $3,700. NOW 65% DOWN. ACCUMULATION ZONE ACTIVATED
REMEMBER MY WARNING?
When ETH Broke $3,700-$3,600 Support, I told you: "Major Breakdown Incoming"
THE RESULT:
✅ Entry Warning: $3,700
✅ Current Price: ~$1,700
✅ Total Drop From Our Entry: -54% (65% from Peak in Last 6 months)
ACCUMULATION ZONES:
✅ Zone 1: $2,000-$1,800 - FILLED (First Bids Triggered)
🎯 Zone 2: $1,400-$1,270 (0.786 Fib) - BIDS PLACED
→ This is maximum Pain Zone
→ Historical Bounce Level
→ Best Long-Term Entry
WHY I’M LONg-TERM BULLISH ON CRYPTOCAP:ETH :
→ U.S. ETH ETFs Have Accumulated 6M ETH ($55B) in ~18 months
→ Bitmine Continues aggressive Accumulation, Now Holding 4.28M ETH (~$13B+)
→ Combined with Other ETH-Strategy Firms, Institutions Now Control ~13M ETH
This Level of Structural, Long-Term Demand is Extremely Bullish for Ethereum’s Next Cycle.
Long-Term Targets: $10,000-$20,000 (5-10x Potential)
MY APPROACH:
1️⃣ Scale in Slowly (Not All-In)
2️⃣ Place Bids at Key Technical Levels
3️⃣ Let Market Come to Me
4️⃣ Think in Years, Not Weeks
THE MINDSET (THE REALITY):
❌ Most Bought at $3,700 (Greed)
✅ I'm Buying at $1,800 (Fear)
This is how generational wealth is built in crypto.
IMPORTANT:
This is NOT Short-term Trading, This is LONG-TERM Accumulation
65-80%% Corrections = Normal in Crypto
Next Bull Run = 500-1000% Moves
THE FIBONACCI PROOF:
0.618 Fib ($1,700) = Current Support Test
0.786 Fib ($1,270) = Maximum Opportunity
More Downside Possible Before Reversal.
But When $10K-$20K Hits, You'll Remember this Post.
NFA. ALWAYS DYOR. Scale in Smart.

$ETH UPDATE: NOW 48% DOWN FROM MY WARNINGCRYPTOCAP:ETH UPDATE: NOW 48% DOWN FROM MY WARNING
When #ETHEREUM Broke $3,700-$3,600 Support, I warned you about a major breakdown.
✅ From $3,700 → $1,928 (48%) in Just 3 Months
✅ Previous Entry at $2,200-$2000 FILLED
NEW ACCUMULATION ZONE:
🔹 $2,000 - $1,500 (Start Building Positions)
🔹 $1,700 (0.618 Fib - Strong Support, Bid Placed)
🔹 $1,300 (0.786 Fib - Worst Case Scenario Bid)
Why I'm Still Confident:
→ $10K Target (5x from current levels)
→ $15K Target (Extended cycle target)
This is NOT for short-term trades.
This is LONG-TERM spot accumulation.
The best opportunities come when everyone else is fearful.
Fibonacci levels don't lie:
0.618 at $1,700 = Historical bounce zone
0.786 at $1,300 = Maximum pain / Maximum opportunity
My Approach:
Scale in. Don't all-in.
Place bids at key levels.
Let the market come to you.
Remember: In crypto, 500-1000% moves happen every cycle. But only for those who accumulate during fear, not FOMO.
NFA. ALWAYS DYOR.

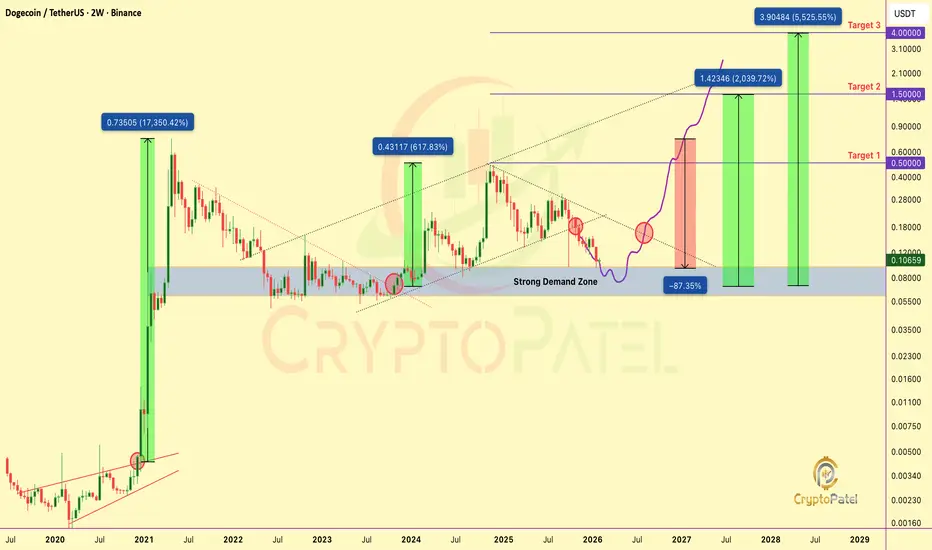
$DOGE at the EXACT Level That Triggered 17,000% Pump - Repeat?CRYPTOCAP:DOGE at the EXACT Level That Triggered 17,000% Pump - History About to Repeat? 🚀
They Laughed at $0.003
They Sold at $0.10
They’ll FOMO above $1.00+
This Weekly / 2W Chart is Screaming Accumulation:
✅ Macro Demand Zone Holding at $0.10–$0.06
✅ Price Respects a Multi-Year Strong Support (Since 2021)
✅ -87% Down From ATH - Classic Cycle Reset
✅ Every Previous Touch of This Zone Led to a Parabolic Expansion
Historical Proof:
2021 Rally: +17,000%
2024 Rally: +600%
Current Phase: Re-Accumulation Before Expansion
CryptoPatel CRYPTOCAP:DOGE Targets: $0.50 → $1.50 → $4.00 (Full Cycle Extension ~5,500%)
❌ Invalidation: Weekly Close Below $0.06
Smart Money Accumulates When Sentiment Is Dead.
Retail Buys When Price Is Vertical.
LONG-TERM FUNDAMENTAL CATALYST (DON’T IGNORE THIS) 🚀
Elon Musk has Confirmed that SpaceX Plans to Send a Literal Dogecoin to the Moon 🐕
How Many #DOGE Believers See $1+ This Cycle? 👇
❤️ LIKE if You’re Bullish
🔁 SHARE if You’re Holding
💬 COMMENT “DOGE” if You’re Not Selling 🚀
ALWAYS DYOR, This is Not Financial Advice
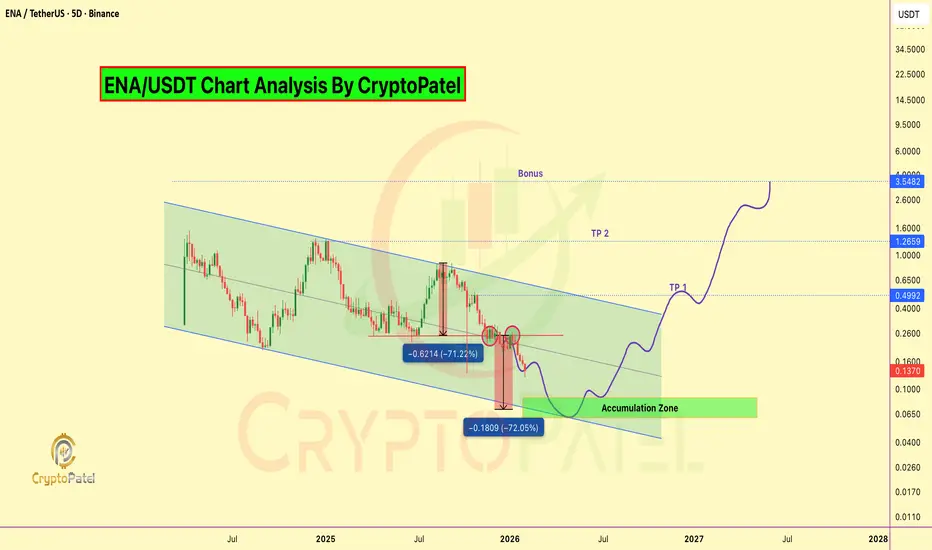
$100M Private Sale at $0.40... Now CMP Trading at $0.135$100M Private Sale at $0.40... Now Retail Can Buy at $0.135. First Time Retail Gets Better Entry Than VC
#ENA Is Trading Inside A Long-Term Descending Channel On The HTF Chart Since 2024.
Price Has Completed A Deep Multi-Leg Correction And Is Now Testing A Major Demand Zone At Channel Support.
Current Technical Structure:
✅ Descending Channel Intact
✅ ~92% Down From ATH
✅ Price Near Lower Channel Support
✅ Strong Accumulation Zone: $0.08–$0.06
✅ H&S Bearish Target For Long Term Accumulation is $0.07
✅ ~66% Below Private Investor Price (VC Discount Zone)
✅ Trump's World Liberty Financial Bought ~$5.15M ENA At ~$0.891 (Now ~$0.135 → ~85% Drawdown / ~$4.37M Unrealized Loss)
CryptoPatel Targets: $0.50 / $1.26 / Bonus $3+
As Long As ENA/USDT Holds Above The Accumulation Zone, A Relief Rally And Trend Reversal Remain Probable.
Why It Could Pump
✅ EURONEXT:USDE is now 3rd Largest Stablecoin ($5.8B)
✅ Fee Switch Coming Q1 2026 - stakers Get Protocol Revenue
✅ Building Own Blockchain
✅ Institutional Product (iUSDe) Launching Soon
✅ Major TradFi Backing
⚠️ Risks to Watch
❌ Heavy token unlocks until 2028
❌ Down 85% from ATH
❌ Similar model concerns to Terra/Luna
❌ Depends on positive funding rates
Invalidation & Risk Note: This is a high-risk, high-reward setup with elevated volatility. Strict risk management is essential.
TA Only. Not Financial Advice. ALWAYS DYOR.
UPDATE: $BTC Breakdown Playing OutUPDATE: CRYPTOCAP:BTC Breakdown Playing Out
Bitcoin dumped below $85k, now trading near $84.4k.
We called shorts at $95k–$98k, and price rejected from ~$98k, delivering nearly 12% downside already.
The bear flag breakdown remains active, downside continuation favored.
Targets: $75k → $70k
Invalidation: HTF close above $90,600
Until then: sell rallies, respect the trend.
Not financial advice. DYOR.

$RIVER Turned $1K Into $52K In 41 Days But Here’s Why I’m Not BuCRYPTOCAP:RIVER Turned $1K Into $52K In 41 Days But Here’s Why I’m Not Buying
CRYPTOCAP:RIVER Pumped 5,221% In 41 Days. From $1.616 (Dec 17) → $86 (Yesterday)
What Caused This Pump?
🔹 Arthur Hayes + Justin Sun ($8M) Backed It
🔹 $12M Funding Round With Big Investors
🔹 Sui Network Partnership
🔹 Listed On Binance, OKX, Bybit, Coinone
🔹 Only 20% Tokens In Circulation
🔹 One Whale Bought 50% Supply At $4
⚠️ My Warning:
👉 Don’t Try To Catch This Knife Now
👉 Strong Support Is At $8–$12 - High Chance Price Revisits $10–$15
👉 Fresh Longs At ATH = Very Risky
Key Risks:
🔴 Whale Controls 50% Supply: Dump Risk Anytime
🔴 Pump Driven By Leverage, Not Organic Demand
🔴 80% Tokens Still Locked
Conclusion:
Wait For A Proper Pullback
Don’t Become Exit Liquidity
DYOR
My Take:
Good Project, Very Risky Price Right Now
Wait For Cooldown Or Proper Structure
FOMO Is Not A Strategy

BTC Confirms Bearish Structure After Neckline RejectionBTC Confirms Bearish Structure After Neckline Rejection
#Bitcoin has rejected the 94k–98k neckline resistance, confirming a bearish market structure.
➡️ Resistance: 94k–98k
➡️ Supports: 80k → 75k → 70k
Structure shows a confirmed Head & Shoulders Pattern Failed, Followed by a bear flag breakdown, trend remains decisively bearish.
Outlook:
Below 90k, downside continuation is favored.
Measured move points to 75k–70k (~22% downside).
Bullish bias only returns on a strong reclaim and acceptance above 92k.
Until then: sell the rallies, respect the trend.
Not financial advice. DYOR.

$ONDO ALTSEASON SETUP | 5,000%+ EXPANSION IF MACRO DEMAND HOLDSONDO is currently trading at a major weekly demand zone after an ~85% drawdown from ATH. While price action remains weak, on-chain data suggests silent accumulation, indicating potential smart money positioning ahead of the next cycle.
Market Structure (Weekly)
Bearish divergence confirmed at $2.14, marking the macro top
Breakdown + retest of the $0.73–$0.80 support zone → now acting as resistance
Price has entered a high-timeframe demand zone between $0.30–$0.20
A final retracement into bullish order flow ($0.32–$0.20) remains possible
Bullish bias remains valid above $0.20 (weekly close)
On-Chain Context (Jan 18, 2026 – 1.94B ONDO Unlock):
Whale spot orders dominating market activity
$0.35–$0.40 acting as an accumulation range
90D CVD trending higher → buy pressure outweighs sell pressure
Taker-buy dominance → aggressive smart money absorption
This behavior suggests unlock supply is being absorbed, not distributed.
Upside Projections (HTF Expansion)
Targets: $0.70 → $1.00 → $2.00 → $5.00–$10.00
Structure supports a potential RWA-led expansion into 2026 if demand holds
Key Level to Watch
Invalidation: Weekly close below $0.20
This $0.32–$0.20 zone may be the final bullish base for ONDO ahead of the next alt-season cycle
TA Only. Not Financial Advice. DYOR.

$DYDX PRICE OUTLOOK | 3000%+ POTENTIAL FROM MACRO SUPPORT?DYDX/USDT PRICE OUTLOOK | Macro Support & High R:R Setup
DYDX is currently trading at a major higher-timeframe demand zone on the 2-week chart, following an extreme ~99.45% drawdown from its all-time high. Historically, such deep retracements often precede long-term re-accumulation phases, especially when aligned with structural support.
Market Structure Overview
Price remains within a multi-year descending channel active since 2022. The current price action is testing the lower boundary of this channel, which aligns with a clearly defined horizontal accumulation zone ($0.15–$0.20). This creates a strong confluence-based support region.
Technical Confluence
Descending channel support respected on HTF
Strong historical demand at $0.15–$0.20
~99% retracement from ATH completed
Compression near support suggests potential volatility expansion
Bias remains bullish as long as HTF structure holds
Upside Levels (If Breakout Confirms)
Resistance 1: $0.84
Resistance 2: $2.19
Resistance 3: $4.39
ATH Supply Zone: $27.85
A confirmed HTF close above descending trendline resistance would validate a structural trend reversal. The measured move from this base projects toward $3.85, representing a potential ~3200% upside from current levels.
Invalidation
Any 2-week candle close below $0.15 invalidates the accumulation thesis and requires reassessment.
Conclusion
This setup reflects a classic falling-wedge / descending-channel structure meeting historical demand. While risk remains elevated, the risk-to-reward profile is asymmetric at this level. Patience, confirmation, and position sizing are essential.
Analysis Type: Technical Analysis
Timeframe: Long-Term / Positional
Bias: Accumulation → Trend Reversal (Conditional)
TA only. Not financial advice. Always manage risk.

$XRP PRICE PREDICTION | MULTI-YEAR BREAKOUT TOWARD $10+?CRYPTOCAP:XRP is trading above a confirmed multi-year breakout zone on the higher timeframe after completing a long accumulation phase.
Price has already delivered a strong expansion move and is now building structure for the next leg higher.
TECHNICAL OVERVIEW (HTF):
✔ Descending Wedge Breakout (2020–2024)
✔ 600%+ Expansion From $0.60 Breakout
✔ Fair Value Gap / Accumulation Zone: $1.30 – $1.90
✔ Higher-Timeframe Bullish Structure Intact
✔ Bullish Bias While Price Holds Above $1.30
TARGETS (CryptoPatel): $3.50 / $5.00 / $8.70 / $10+
INVALIDATION:
❌ HTF Close Below $1.30
Technical analysis only. Not financial advice. DYOR.

$FET Price Prediction | 5000% Potential From Macro Support?Market Context
NYSE:FET is currently trading at a major Higher Timeframe (HTF) support zone after a deep corrective move from cycle highs.
Price has retraced ~97% from ATH, a level historically associated with long-term re-accumulation phases.
Technical Overview (HTF)
✔ Macro ascending channel support intact (since 2020)
✔ Strong HTF demand zone at $0.20 – $0.19
✔ 97%+ retracement from ATH completed
✔ Channel support + demand confluence holding
✔ Bullish structure as long as price holds above $0.19
This area represents a high-risk / high-reward macro support with asymmetric upside potential.
Upside Targets (CryptoPatel Levels) $0.60 / $1.00 / $2.80 / $5.00 / $10.00
➡️ This implies a potential ~50x (5000%) move if the macro structure plays out.
⚠️ Invalidation Level
❌ HTF close below $0.19
A breakdown below this level would invalidate the macro bullish thesis.
Conclusion
As long as FET/USDT holds above $0.19, the macro bullish bias remains valid.
This zone could act as a long-term accumulation base before the next expansion phase.
TA Only | Not Financial Advice
Always manage risk and DYOR.

$TON BREAKOUT SETUP | MACRO CHANNEL TARGET $30 | CRYPTOPATELLSE:TON / USDT: Weekly Price Forecast | CryptoPatel
TON is trading at a major HTF support confluence on the weekly timeframe after a prolonged corrective move from the 2024 highs.
Technical Structure:
Price continues to respect a macro ascending channel in play since 2022. Within this structure, TON has been correcting inside a descending channel from the ~$8 high, indicating a controlled correction rather than trend failure.
The current price is reacting from the lower boundary of the descending channel, which also aligns with long-term ascending trendline support — a key accumulation zone historically.
Key Levels & Confirmation:
• Weekly close above $2.70 = descending channel breakout
• Reclaim of $3.50 = bullish trend resumption
• Measured move projects toward $28–$30 zone (upper macro channel)
Targets: $3.50 → $7 → $15 → $30+
Invalidation: Weekly close below $1.20
This is a high time-frame accumulation setup with asymmetric risk-reward, best suited for spot and long-term positioning.
TA Only. Not Financial Advice. Always Manage Risk.

BTC | 8H Technical Structure UpdateBTC | 8H Technical Structure Update
Price Is Printing A Clear Ascending Triangle With Consistent Higher Lows Pressing Into A Well-Defined Horizontal Supply Zone At $94,500
Key Technical Levels:
🔹 Range High / Supply: $94,500 → $107,000
🔹 Ascending Trendline (Dynamic Demand): ~$88,000
🔹 HTF Demand / Structural Support: $78,000
Market Structure Read:
🔹 Compression Phase Ongoing
🔹 Volatility Expansion Imminent
🔹 Trendline Continues To Act As Acceptance Support
🔹 Liquidity Resting Above Range High
Scenarios:
✔️ 8H Close Above $94500 → Range Expansion Toward $106K+
❌ Loss Of Ascending Trendline → Structural Rotation To $78K
Market Is At Decision Point. Wait For Acceptance, Not Anticipation.

$TRX PRICE FORECAST | IS $5 POSSIBLE? | ANALYSIS BY CRYPTOPATELCRYPTOCAP:TRX PRICE FORECAST | IS $5 POSSIBLE? | ANALYSIS BY CRYPTOPATEL
#TRX Is Quietly Building A Massive Multi-Year Base On The 2W Chart.
Price Has Respected The Same Rising HTF Trendline Since 2020 — A Clear Sign Of Long-Term Strength.
Technical Highlights:
✅ Clean Higher Highs & Higher Lows
✅ Multi-Year Ascending HTF Trendline Holding
✅ Strong HTF Demand Zone Holding At ~$0.25
✅ Extended Consolidation → Expansion Setup
✅ Macro Trend Bias Remains Bullish
CryptoPatel Targets: $1 → $2 → $5+
Invalidation: ❌ Weekly Close Below ~$0.20
As Long As TRX/USDT Holds Above $0.25, The Bullish Structure Remains Intact.
A Loss Of This Level Would Break The Macro Thesis.
Cycle Outlook:
2025 = Compression Phase
2026–2027 = Potential Parabolic Expansion
TA Only | DYOR | Not Financial Advice

$LINK Price Outlook | Is $100+ On The Table? | CryptoPatelBIST:LINK Price Outlook | Is $100+ On The Table? | CryptoPatel
BIST:LINK Is Showing Strong Signs Of A Macro Bullish Reversal After Holding A Multi-Year Support Zone On The 2W Timeframe. The Current Structure Suggests A High-Timeframe Trend Shift That’s Been Building Since The 2021 Top.
Technical Breakdown (HTF):
✅ Breakout And Retest Confirmed
✅ Strong Accumulation Zone: $9 – $12
✅ Holding Above The 0.618 Fibonacci Level ($9.88)
✅ Higher Lows Forming → Macro Trend Turning Bullish
✅ Major Resistance Zone: $25 – $31 (Expansion Trigger)
Upside Targets (CryptoPatel): $31/$52/$90 – $100 (~780% Potential Cycle Move)
Bullish Thesis:
As Long As BIST:LINK Holds Above $7, The Macro Bullish Structure Remains Valid. This Is A Patience-Based, High-Timeframe Setup With A Strong Risk-To-Reward Profile For Spot Positions.
Invalidation:
❌ Weekly Close Below $7
Disclaimer:
Technical Analysis Only. Not Financial Advice. Markets Are Probabilistic—Always Do Your Own Research.

$ONDO PRICE FORECAST | IS $7.65+ POSSIBLE? | CRYPTOPATEL TALSE:ONDO Is Trading At A High-Timeframe Fibonacci Demand Zone, Holding The 0.618 Retracement (~$0.45) After A Deep Corrective Move — A Textbook Accumulation Structure.
Technical Structure
Accumulation Zone: $0.40–$0.45
Bullish Order Block / Deeper Demand: $0.25–$0.30 (0.786 Fib)
HTF Structure Remains Valid Above $0.25
Structural Flip Can Trigger Impulsive Expansion
Price Targets: $0.82 → $1.20 → $2.15 → $7.65+
As Long As Demand Holds, ONDO Remains Positioned For A Multi-Leg Cycle Expansion With 2000%+ Upside Potential.
Accumulation Phase In Progress — Patience Is Key.
Technical Analysis Only | Not Financial Advice

$XRP Price Forecast | Is $10 Possible?CRYPTOCAP:XRP Is Currently Retesting A Breakout That Took Nearly 8 Years To Form — A Rare, High-Timeframe, Cycle-Level Structure That Typically Precedes Major Market Expansions.
The Last Time This Exact Structure Appeared (2017), XRP Delivered An Extraordinary 40,000% (400x) Move Following The Breakout.
Current High-Timeframe Technical Structure:
✅ Multi-Year Descending Structure Broken
✅ ~57% Corrective Pullback From Recent ATH
✅ Price Holding Within The $2–$1.50 Demand Zone
✅ Strong Macro Support Identified At $1–$0.80
As Long As Price Respects This Support Region, The Primary Technical Projection Remains $8–$10 XRP Over The Cycle, Based On Measured Move And Historical Structure Behavior.
Why Expect Only 5x–10x From Here?
The Previous Multi-Year XRP Breakout Resulted In A 400x (40,000%) Expansion.
Historically, Large Bases Lead To Large Moves — Not Modest Returns.
From A Purely Structural Perspective, A Move Toward $10–$20 Cannot Be Ruled Out In The Next Market Cycle If The Breakout Holds And Momentum Confirms.
Disclaimer:
This Analysis Is For Educational Purposes Only And Does Not Constitute Financial Advice. Technical Analysis Is Probabilistic, Not Predictive. Always Apply Proper Risk Management And Conduct Your Own Research.

BNB Price Forecast 2026 | Is $10K/BNB Possible? | Analysis By CPBNB has shown strong price action recently. After bouncing from the $500 support zone, price moved higher, broke the previous all-time high, and successfully cleared the $700 resistance, which is now acting as a strong support area.
Currently, BNB is consolidating around the $800 level, suggesting the market is digesting the recent move.
Technical Overview
Multi-year ascending trendline: Still intact, indicating long-term bullish structure.
Major support zone: $500–$800
This range has acted as an accumulation area during previous pullbacks.
Current structure: Sideways consolidation near $800 after a strong breakout.
Possible Scenarios
Bullish continuation:
If BNB holds above $800 and breaks higher with volume, continuation toward higher levels is possible.
Pullback scenario:
If price drops below $800, a retest of $700–$500 could occur. Historically, this zone has provided strong demand and may attract long-term buyers.
Long-Term Perspective (Cycle-Based)
Bull market target (speculative): Around $3,000
Macro cycle projections (high risk & speculative): $10,000–$20,000
These levels are not predictions, but potential zones based on historical cycles, trend strength, and broader market conditions.
Key Takeaway
The overall structure remains bullish as long as price stays above major support levels. Consolidations and pullbacks within an uptrend are normal and often help reset the market before the next move.
This is an educational analysis only. Not financial advice.
Always manage risk and do your own research (DYOR).

ETHEREUM 2026 ATH Price Forecast | Bitcoin Halving Cycle AnalysiThis study observes Ethereum’s historical behavior relative to Bitcoin halving events. The purpose is to highlight recurring market structure patterns, not to provide financial or investment advice.
Observed Historical Cycles
2016 Bitcoin Halving
~70% drawdown in ETH
~546 days of sideways accumulation
Followed by a multi-year expansion phase (~22,800% peak move)
2020 Bitcoin Halving
~75% drawdown in ETH
~546 days of consolidation
Subsequent expansion to ~$4,693 (+2,600% approx.)
2024 Bitcoin Halving (Current Cycle)
~66% drawdown observed
~609 days of consolidation (ongoing)
Market structure remains comparable to prior accumulation phases
Key Observation
ETH trading within the $2,600–$3,000 range aligns with previous long-term accumulation zones seen before historical expansion phases.
Forward-Looking Scenario (Cycle-Based Projection)
If historical rhythm continues, the next expansion window may extend into 2026, with hypothetical price zones often discussed by market participants between:
$10,000
$15,000
$18,500+
These levels represent cycle-based projections, not price guarantees.
Conclusion
Ethereum has historically followed a pattern of deep drawdowns, prolonged consolidation, and later expansion after Bitcoin halving events. Whether this cycle continues to rhyme remains to be confirmed by future market behavior.
This analysis is for educational and informational purposes only. Always conduct independent research and risk assessment.

Will Bitcoin Hit $50,000 or $500K In Next Cycle ?Most People Still Don’t Understand What This #Bitcoin Chart Is Saying.
This Is The 12-Month CRYPTOCAP:BTC Structure.
It Has Been Respected For 15 Years.
Every Cycle:
Excess → Reset → Higher Floor → Expansion.
All Called “The End.”
All Were Structural Resets.
Here’s The Part Retail Misses:
Bitcoin Is Now Holding Above Its Previous Cycle High, Historically The Most Bullish Phase Of The Cycle.
That’s Not Optimism.
That’s Market Memory.
No Price Targets.
No Narratives.
Just Structure Doing What It Always Does.
If You’re Waiting For Certainty, You’ll Buy Late.
If You Understand Cycles, You Already Know What Comes Next.
🟠 Bitcoin Doesn’t Need Belief. It Needs Time.
IMO:
2026 For Bitcoin Will Likely Be Bearish, And We Could See Bitcoin Under $50K Based On Previous Fractals And Cycle Analysis.
However, 2027–2028 Could Be Massive For Bitcoin, And We May See $500K Within The Next 4 Years, In My Opinion.
This Is Just My Personal View, Not Financial Advice.
Always DYOR Before Any Investment Decisions.
