Bearish Setup Loading on Solana? Bearish Setup Loading on Solana? Watch This Key Level Closely
Solana just retested the breakdown zone after losing key support — currently sitting in a danger zone.
Short Interest Zone: $180 – $190
If this area holds as resistance, we could see another move below $150 soon.
Bearish Setup Invalidation: Break above $200 will flip this bias.
Long-Term View? I’m still super bullish on SOLANA in the bigger picture — my long-term target remains $1000 🚀
Risk Management is Key
Never trade without a STOP LOSS — protect your capital.
This is NOT financial advice — DYOR before investing.
Let the chart guide you, not emotions. Stay sharp.
Solana
$SEI to $2? Trump-backed + Institutional Buys = Next Altcoin NYSE:SEI to $2? Trump-backed + Institutional Buys = Next Altcoin Rocket!
#SEI already pumped +100% from our entry! Hope you enjoyed the ride.
But I’m still massively bullish on this setup.
▶️ Price is consolidating near strong support at $0.20–$0.14
▶️ This is a golden accumulation zone for the next leg up!
▶️ Backed by Trump’s Liberty Financial & multiple institutional buys
▶️ My targets for this bull run: $1 → $2 → $3 → $4
Still early. Still bullish. Still time.
Note: Not Financial Advice so Do your Own Research before investing.
#Altcoins

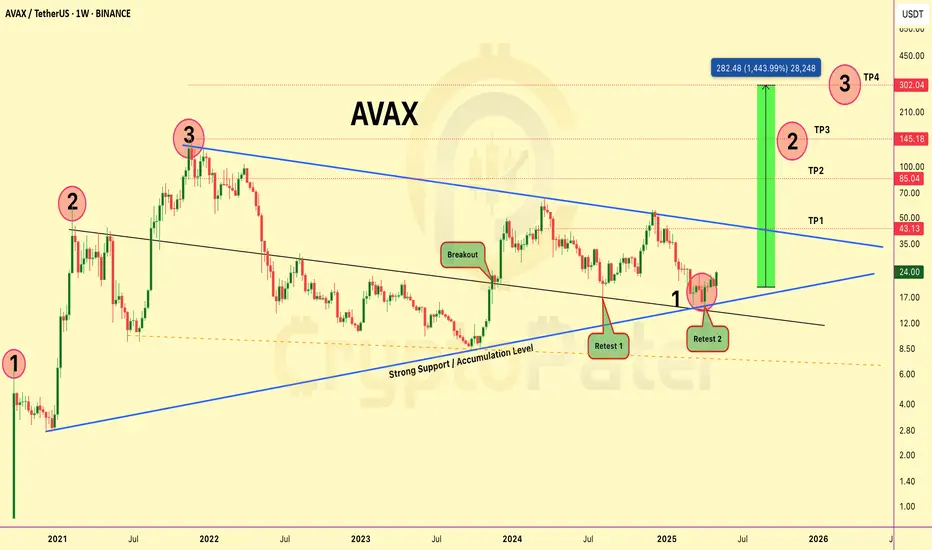
$AVAX Weekly Chart Update – Massive Breakout Brewing!🚨 CRYPTOCAP:AVAX Weekly Chart Update – Massive Breakout Brewing!
#AVAX is showing a textbook falling wedge breakout on the weekly timeframe, and the setup looks 🔥 for a potential 10x+ move!
Here’s what’s happening:
✅ Structure: Multi-year falling wedge since 2021
✅ Breakout: Confirmed in late 2023
✅ Retests: ✅ Retest 1 & ✅ Retest 2 both held perfectly
✅ Support Zone: Strong accumulation by big players
✅ Accumulation Zone: $24-$20 — still in early entry zone!
🔰 Targets: $43/$85/$145/$302+ (Cycle extension target)
▪️ Measured move suggests +1400% upside potential
▪️ This is one of those charts you don’t want to ignore. Accumulation is likely done. Smart money already positioned. Now it’s about patience and trend continuation.
Chart looks ready. Momentum building. Are you riding this AVAX train? 🚀
Solana (SOL) Analysis & Long Trade Plan – May 2025Solana ( CRYPTO:SOLUSD ) has re-emerged as one of the strongest Layer-1 blockchain plays, continuing its impressive recovery and adoption since the FTX fallout. With major ecosystem developments, lower fees, and blazing-fast throughput, SOL is now more than just an "Ethereum killer"—it’s a key pillar of the next wave of decentralized apps.
🔍 Current Technical & Fundamental Snapshot
Price: ~$151 (as of May 1, 2025)
Market Cap: ~$71B
24h Volume: ~$2.1B
Rank: Top 5
TVL: Over $4.2B
NFT & DeFi growth: Rapid expansion on platforms like Jupiter, Drift, and Tensor
Ecosystem Catalysts:
Firedancer validator client nearing launch (scaling & security upgrade)
Breakpoint 2025 announcements expected soon
Ongoing migration of dApps from Ethereum due to gas costs
📈 Chart Overview (Weekly Timeframe)
Trend: Bullish
Support Zones: $147, $145
Resistance Zones: $165, $195
Structure: Forming higher lows and higher highs since 9th April 2024
RSI: 63 – no signs of overbought yet
Volume: Healthy on green candles, strong accumulation
🎯 Long-Term Trade Plan (Q2–Q4 2025)
✅ Entry Zones:
DCA Zone: $150–$155
Aggressive Buy: $145 retest (if market pulls back)
🎯 Targets:
TP1: $165
TP2: $195
TP3: $260 (previous ATH zone)
TP4: $320 (expansion based on 1.618 Fibonacci)
❌ Stop-Loss:
Close daily candle below $138 with volume (invalidates structure)
🧠 Risk-Reward Outlook
R:R from $152 to $195 = 1:3
Macro Bull Scenario to $260 = >1:7.5
Probability Adjusted Expectation: High, due to strong ecosystem use and dev activity
📌 Final Thoughts
Solana has proven its resilience, fixing past outages and seeing revived interest from both developers and institutions. With token unlocks behind us, clean funding rounds, and real user activity, SOL remains a solid long-term crypto play for 2025.
⚠️ Not financial advice. Always DYOR and manage your position size properly.
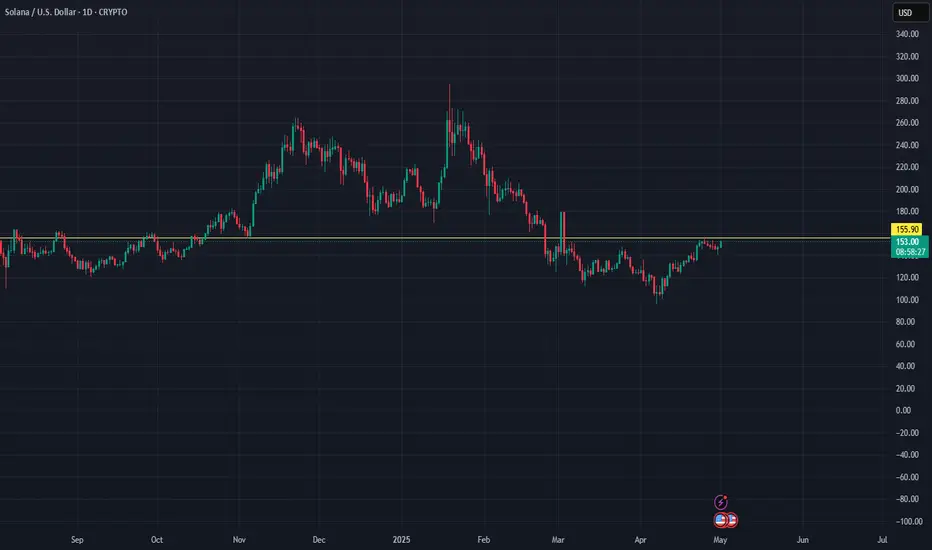
Solana Might Rally Towards $220 Solana is currently forming a classic cup and handle pattern on the daily chart, which, when confirmed, is a strong bullish continuation setup.
The cup formed over several weeks with a rounded bottom and volume decreasing midway through the base, which aligns with traditional pattern behavior.
The current handle is consolidating as a downward-sloping bull flag. Volume is gradually tapering off during the handle — again, a textbook characteristic suggesting sellers are losing steam.
A daily candle close above ~$153.30 on solid volume would confirm the breakout.
That level also aligns with previous local highs, making it a key resistance zone.
Once confirmed, the pattern implies a measured move target near $220, derived from the depth of the cup.
Stop-loss could be a close below the previous local lows.
What do you think of this setup? Would you enter on the breakout or wait for a retest?

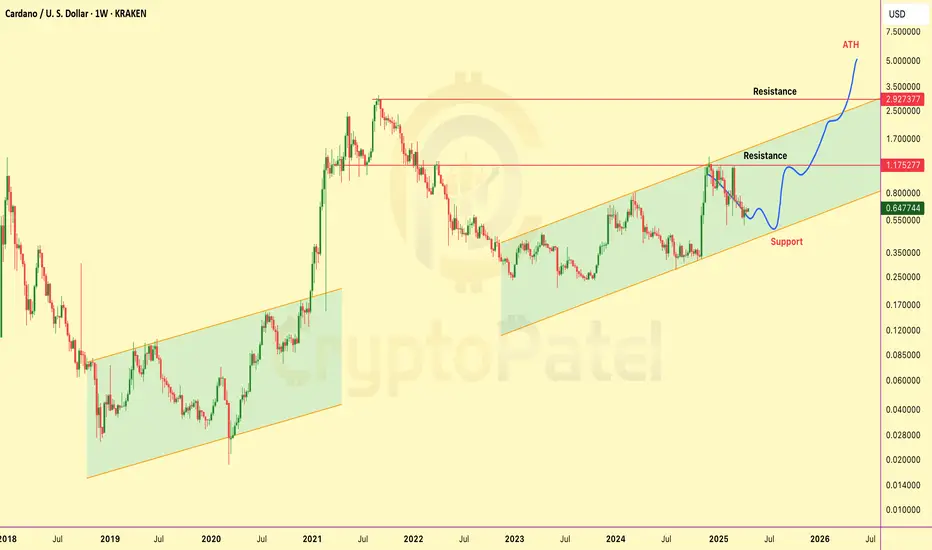
Will ADA hit $5 in bull Market ?CRYPTOCAP:ADA isn’t dead — it’s Loading For $5
The Setup is Clean:
✅ Support at $0.45
✅ Accumulation between $0.65–$0.45
🎯 Targets: $2, $4, $6
Patience here could print fortunes.
Will Bitcoin Hit $1 Million in Future?Everyone’s Scared of #Bitcoin Red Candles... I see Opportunity.
1⃣ This ain’t just a dip — it’s a Discounted future begging to be Grabbed.
2⃣ My Chart will Age like fine wine 🍷
3⃣ Buy fear. Stack smart.
4⃣ In a few years, You'll wish you did.
Let the smart money eat. 🚀
NFA & DYOR

Is ChainGPT 1800% Potentila in Altseason ?🚨 CGPT/USDT Technical Outlook 🚨
ChainGPT just completed a liquidity grab from the bottom of its accumulation zone — and things are heating up!
🔍 Key Highlights:
✅ Strong bounce from the green accumulation zone
✅ Previous structure broken (BOS & CHoCH spotted)
✅ Possible rally projection toward $1.00, if bullish momentum holds
⚠️ Immediate resistance lies between $0.110
The last time CGPT touched this zone, it skyrocketed 1,481% — and this time the setup looks even stronger.
Patience here could reward the smart money.
Keep your eyes on the breakout levels and retest zones.
👉 Not financial advice. DYOR.

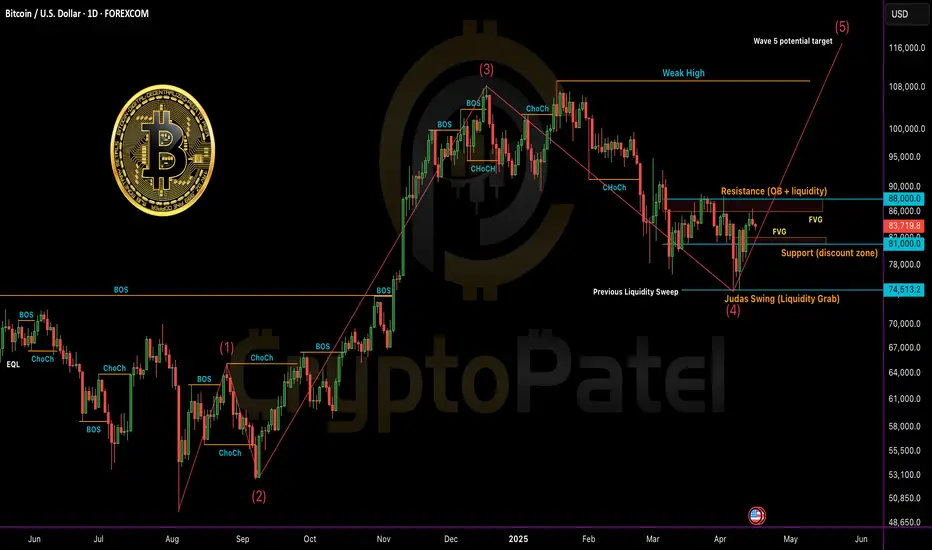
Bitcoin (BTC/USDT) – Full Technical Breakdown - Timeframe: 1DBitcoin (BTC/USDT) – Full Technical Breakdown - Timeframe: 1D
Market Structure & SMC (Smart Money Concepts)
✅ CHoCH (Change of Character) confirmed from $105K top → current lower high around FWB:88K zone.
📉 Break of Structure (BOS) to the downside occurred at $91K.
🟠 Bearish Order Block (OB): $86K– FWB:88K (price currently reacting here).
Liquidity Levels:
Sell-side: Swept at $76K
Buy-side: Sitting above FWB:88K
Fair Value Gap (FVG): Unfilled zone between $81K– GETTEX:82K may act as magnet for price.
ICT Model Alignment
Judas Swing: Sharp liquidity grab below $76K → followed by rebound — classic manipulation before real move.
PD Array Setup:
Resistance: FWB:88K (bearish OB + buy-side liquidity)
Support: $81K (discount zone + FVG)
Elliott Wave Outlook
Wave 1: July–Sept 2024
Wave 3: Nov–Feb rally to $105K (extended wave)
Wave 4: Correction to $76K likely complete
Wave 5 Target: Potential $115K+ if structure holds
Fractal Observation
🔹 Current price structure is mimicking Nov 2023–Jan 2024 pattern
🔹 If history rhymes: consolidation → breakout → retest → parabolic rally
Key Levels to Watch
🔼 Bullish Confirmation: Daily close above FWB:88K → targeting GETTEX:92K –$100K
🔽 Bearish Rejection: Drop below $81K → next support at $74K–$76K
Strategy Summary
🔹 Short-Term Bias: Cautiously Bullish
🔹 Entry Zone: Retest near GETTEX:82K (FVG + OB)
🔹 SL: Below $79.5K
🔹 TP Zones: FWB:88K → GETTEX:92K → GETTEX:98K
📈 R:R = Minimum 1:5 (High confluence)
Keep your eyes on HTF closures and manage risk. Liquidity traps are in play.
Everyone’s yelling “Rugpull!” over $OM because -90%+ But $TRUMP?🚨 Everyone’s yelling “Rugpull!” over CRYPTOCAP:OM because it's down 90%+…
But no one’s talking about the Official Donald Trump token $TRUMP — which also crashed over -90% from its ATH in just 3 months. 🤯
Isn’t that the same thing?
Seriously, what happens to the trader who aped in at $70+?
➡️ Just imagine the bag they're holding now. 😬
➡️ Not every memecoin with a “name tag” is safe.
➡️ Hype isn’t utility. Hype isn’t protection.
Feels scammy or just bad tokenomics?
You tell me. 💬

#Bitcoin 30 Minutes Chart Scalp profit Update:#Bitcoin 30 Minutes Chart Scalp Profit Update:
That quick scalp move delivered a clean +3.60% — just as planned. Scalp trades are meant for small, fast targets, and this one hit perfectly. ✅
But If Still holding?
🔹 Move SL to Break Even to protect capital
🔹 Structure looks fine for now, but don’t get greedy — manage your risk.
Always trade with a plan.
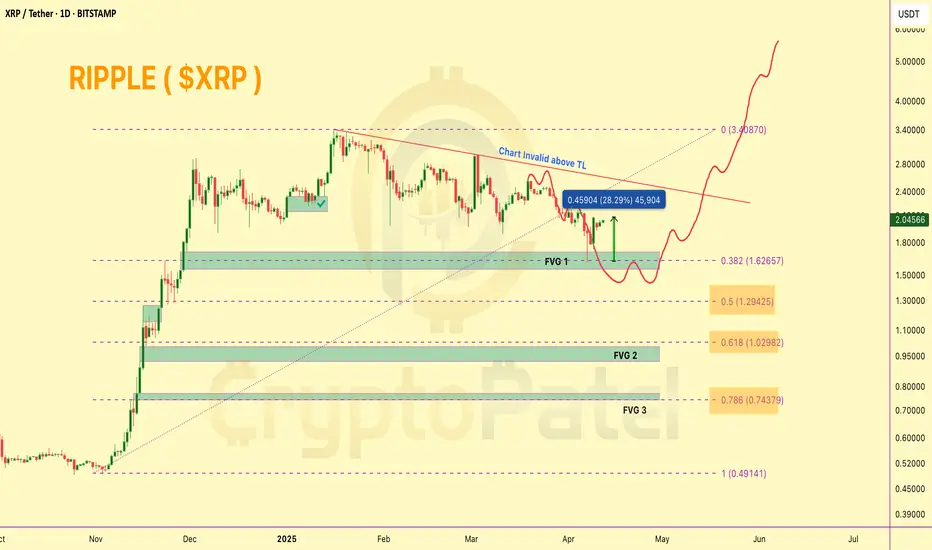
XRP Up 28% From Our Support Call – What’s Next?XRP Up 28% From Our Support Call – What’s Next?
CRYPTOCAP:XRP perfectly respected the FVG 1 zone around $1.60, which we previously marked as a strong support. Since then, price has rebounded over 28% from that level.
Hope you didn’t get caught buying the $2.40–$2.50 zone — as warned, that area showed signs of exhaustion, and price has dropped 30% since.
What’s Next?
If bullish momentum continues, #XRP could revisit the $2.40–$2.50 resistance area. However, this zone may act as a rejection point once again.
From there, we could potentially see a pullback toward $1.30 and $1.00, which aligns with FVG support zones and the 0.5–0.618 Fib retracement levels — key areas where a strong bounce is likely.
🟢 Macro Bias: I remain bullish on XRP/USDT in this cycle and still expect a move toward $7–$10 in the broader bull market. Best entries will likely come during dips into major support zones.
❌ Invalidation Level: This chart setup gets invalidated on an HTF close above $2.50.
Keep it smart — entries on dips, not at tops. 👀
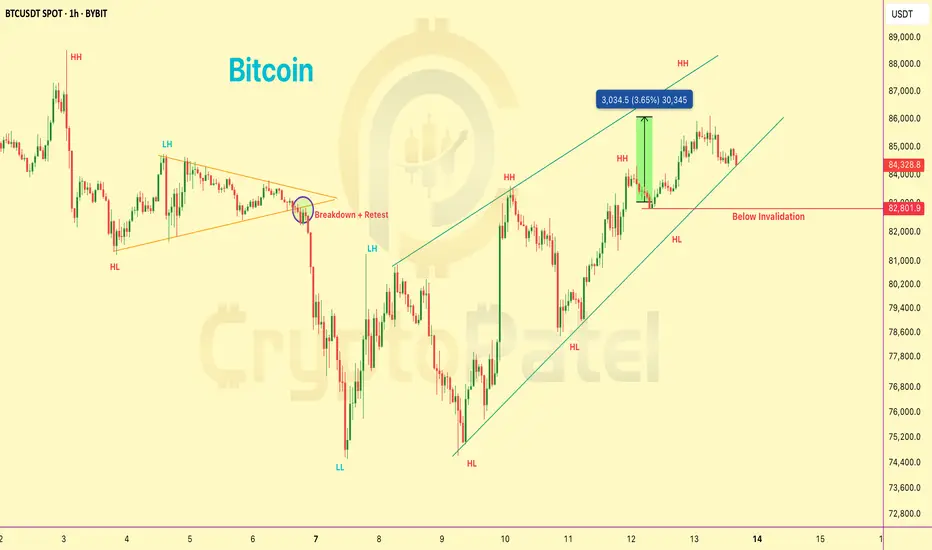
BTC/USDT – 30-Min Chart Technical BreakdownBTC/USDT – 30-Min Chart Technical Breakdown
🔺 Pattern Formation:
Price action is currently developing a rising wedge, generally considered a bearish continuation pattern. However, the ongoing Higher High (HH) and Higher Low (HL) structure suggests short-term bullish momentum is still intact.
Key Resistance Levels:
* $84,700 – Major horizontal resistance
* $83,600 – Local supply zone / recent rejection point
Key Support Levels:
* $81,200 – Trendline + structure support (wedge base)
* $78,400 – Secondary structural support
* $74,900 – High-confluence demand zone
Long Setup (High-Risk Trade – Counter to Pattern Bias):
* Entry Zone: $82,500 – $83,000 (wedge support retest zone)
* TP1: $83,900
* TP2: $85,200
* TP3: $87,000 (upper wedge boundary)
* SL: Below $81,100 (wedge break + structural invalidation)
Confirmation Needed:
Watch for bullish engulfing or a strong bounce from the wedge support (red dashed trendline) with solid volume influx.
Risk Note:
Despite current bullish flow, wedge patterns often resolve bearishly. If price breaches below $81,100, invalidate longs and reassess for possible shorting opportunity.

The Market Looks Brutal Right Now... But Stay With MeThe Market Looks Brutal Right Now... But Stay With Me
It feels like a bloodbath out there… but here’s the truth:
A fast and brutal dump is honestly better than a slow, painful bleed. It shakes out the weak hands quickly—and sets the stage for stronger recoveries.
We've seen this movie before:
▪️ The Covid flash crash
▪️ War shocks like Russia vs Ukraine
▪️ Black swan events like FTX blowing up
▪️ The chaos of the LUNA death spiral
➡️ Each time, fear dominated the feed.
➡️ Each time, the "This time it's different!" crowd got louder.
➡️ And each time, those who stayed calm and DCA’d into real projects walked away with massive wins.
So why should this time—just because of tariffs or macro FUD—be any different?
It’s not.
Zoom out.
The long-term trend is built on strong fundamentals, not headlines.
Stick to the plan: accumulate multi-cycle, high-cap coins. Ride the wave.
The short-term noise fades, but smart strategy compounds.

Ethereum Still down from 2018 ATHIf you had invested in Ethereum exactly 7 years ago (2,646 days),
you would be at a 7.5% loss at today’s lowest price. 😳
Yes, even ETH — one of the biggest and strongest cryptos — is down.
That’s how tough the market is right now. 🩸

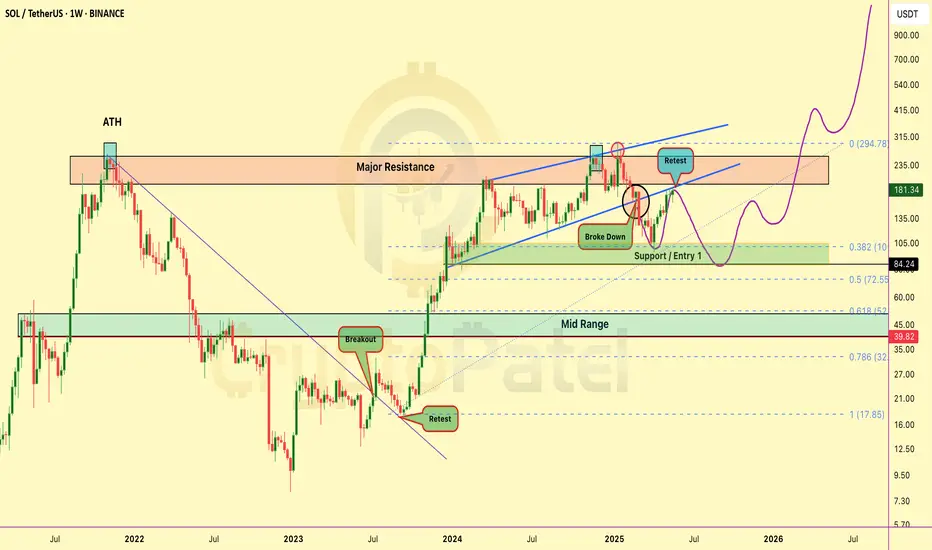
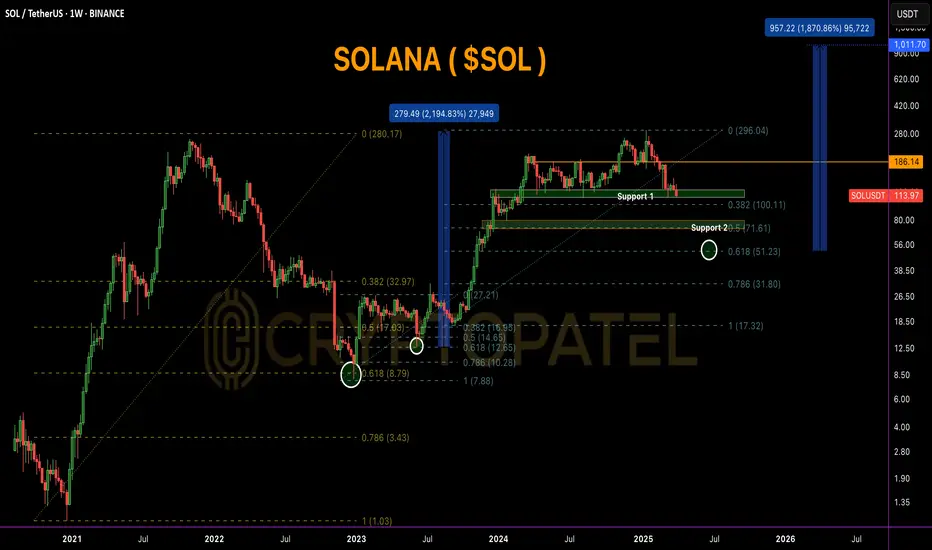
SOLANA Weekly Chart Breakdown–2020 Fractal Signals Massive Bull#SOLANA Weekly Chart Breakdown – 2020 Fractal Signals Massive Rally Ahead!
CRYPTOCAP:SOL is trading at $114.35, currently sitting on a key Fibonacci 0.382 support zone ($100–$115). This area has historically acted as a strong bounce level and is perfect for early accumulation.
If this zone fails, the next major support is the golden pocket ($50–$72) — also marked as Support 2, aligning with the 0.618 Fib retracement.
Historically, this level triggered a 2,100% rally back in 2020-21. If this fractal pattern repeats, we could be looking at a future target near $1,000+.
Breakout level to watch:
▪️ $186 = Bullish confirmation
▪️ $296 = Previous ATH
▪️ $1,011 = Fibonacci-based bull cycle target
Accumulation Plan:
▪️ Zone 1: $100–$115 → Light spot entries
▪️ Zone 2: $50–$72 → Heavy long-term accumulation
✅ Holding above $100 keeps the bullish structure intact.
✅ Break above $186 = start of the next bull wave.
Smart accumulation now can lead to 10x+ returns in the upcoming cycle!
It's All About SO/USDT Overview.
Bitcoin Fresh Update#Bitcoin 4H Chart Update
🔻 Bearish OB: $86,940 – $87,728
🕳️ FVG: $86,750 – $84,800 (Filled)
📌 Key Level: 4H close above OB = bullish continuation
❌ Rejection = prepare for the next leg down

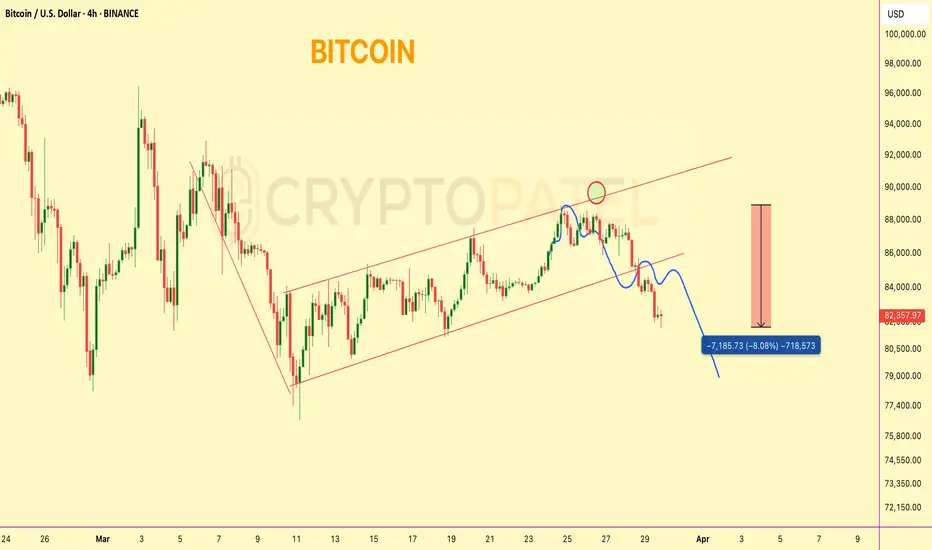
Bitcoin Dumped from our Entry levels and now 8% down#Bitcoin Bearish Flag Update
Price rejected perfectly from $89,000 resistance — our short setup played out with a solid -8% move.
Currently trading around key support at $82,000.
Trend Bias: Bearish below $85,700
Next major support: $75,000–$70,000 zone
Structure still favors further downside unless $85.7K is reclaimed.
Solana 4H Swing Long Entry Setup - Solana is currently trading at 128.8$
- Solana is trying to shift its market structure to bullish, and this will be confirmed once we see a flip above 136-139$
- Solana on a 4H TF is trying to build a consolidation base which should eventually lead to a larger expansion
- Solana and the whole crypto market is currently waiting for a bullish catalyst in order to move higher
- We have 4 central banks speaking this week all eyes on what Jerome Powell will comment and this will dictate the price action for the upcoming weeks.
- Manage risk properly and don't over risk

SOLANA AT FIVE: The High-Speed Blockchain Revolutionizing Crypto📢 SOLANA AT FIVE: The High-Speed Blockchain Revolutionizing Crypto Transactions
What is Solana?
#Solana is a high-performance blockchain designed for speed, scalability, and ultra-low fees. It supports DeFi, NFTs, and Web3 applications with an impressive 65,000 transactions per second (TPS) at almost zero cost!
📌 Founded by: Anatoly Yakovenko
📌 Launched in: March 2020
📌 Market Position: Among the Top 10 Crypto's
Top 3 Highlights of Solana
✅ Ultra-Fast Transactions: Solana’s unique PoH + PoS hybrid model enoS hybrid model ensures high-speed processing.
✅ Low Transaction Fees: Sub-penny costs make it more affordable than Ethereum.
✅ Growing Ecosystem: Used in DeFi, NFT marketplaces, and GameFi, attracting global investors and developers.
How Does Solana Work?
🔹 Proof of History (PoH): A cryptographic clock that timestamps transactions, reducing validation time.
🔹 Delegated Proof of Stake (dPoS): Users stake SOL tokens to secure the network and earn rewards.
🔹 Sealevel: Allows parallel smart contract execallel smart contract execution for improved efficiency.
🔹 Turbine & Gulf Stream: Optimized data transfer and transaction propagation.
Why Use Solana?
✔ Speed: 65,000 TPS vs. Ethereum’s 15 TPS
✔ Low Fees: $0.00025 per transaction
✔ Scalability: No need for Layer-2 solutions like Polygon or Arbitrum
✔ Eco-Friendly: Energy-efficient blockchain
✔ Developer-Friendly: Supports Rust & C++ SDKs
Solana vs Ethereum – Key Differences
▶️Feature | Solana | Ethereum
▶️TPS (Speed) | 65,000+ | ~15
▶️Transaction Fees | <$0.01 | $5-$50
▶️Consensus Mechanism | PoH + dPoS | PoS
▶️Smart Contracts | Rust, C++ | Solidity
▶️Scalability | Built-in (No L2 required) | Requires Layer-2
#Ethereum dominates DeFi & NFTs, but Soires Layer-2Ethereum dominates DeFi & NFTs, but Solana’s high-speed, low-cost model is attracting new projects & users.
Key Use Cases of Solana
🔹 Decentralized Finance (DeFi): Used in Serum, Raydium, Mango Markets
🔹 NFTs & Gaming: Magic Eden, Solanart, Star Atlas, Aurory leverage Solana’s low-cost transactions.
🔹 Smart Contracts & Web3: DAOs, Social Networks, Tokenization projects.
🔹 Crypto Payments: Solana Pay enableay enables instant, fee-less USDC payments, compe comp payments, competing with Visa.
Challenges of the Solana Network
⛔ Network Outages: Several disruptions in 2021-2024 raised concerns.
⛔ Centralization Risks: Fewer validators make it less decentralized than Ethereum.
⛔ Security Issues: Past incidents like the 2022 wallet exploit highlighted risks.
✅ Solution: Firedancer Client Upgrade is expected to enhance network stability.
Solana’s Recent Milestones & Price Performance
📌 2021: SOL hit $260 ATH in the bull run.
📌 2022: Dropped to $9 after FTX collapse.
📌 2023: Massive 1000% rebound, surpassing $100 again.
📌 2024: From $80 to $264 in one year. Visa integrates Solana for stablecoin payments.
📌 2025: New ATH of $295.83, then correction to $110. Over 105M active monthly users in January.
Is Solana a Good Investment?
✅ Pros:
✔ Strong Technical Foundation (PoH + PoS scal Foundation (PoH + PoS scalability)
✔ Growing Adoption & Developer Interest
✔ Institutional Support (Visa, Google Cloud)
✔Support (Visa, Google Cloud)
✔ Active & Expanding Community
❌ Cons:
⚠ Regulatory Uncertainty
⚠ Past Network Downtime Issues
⚠ Strong Competition from Ethereum & Other L1s
📢 Always do your own research before investing in any cryptocurrency.
Final Thoughts – The Future of Solana continues to push the boundaries of blockchain scalability with its ultra-fast transactions and low fees. With growing institutional adoption and ecosystem expansion, CRYPTOCAP:SOL has the potential to compete with Ethereum and beyond.

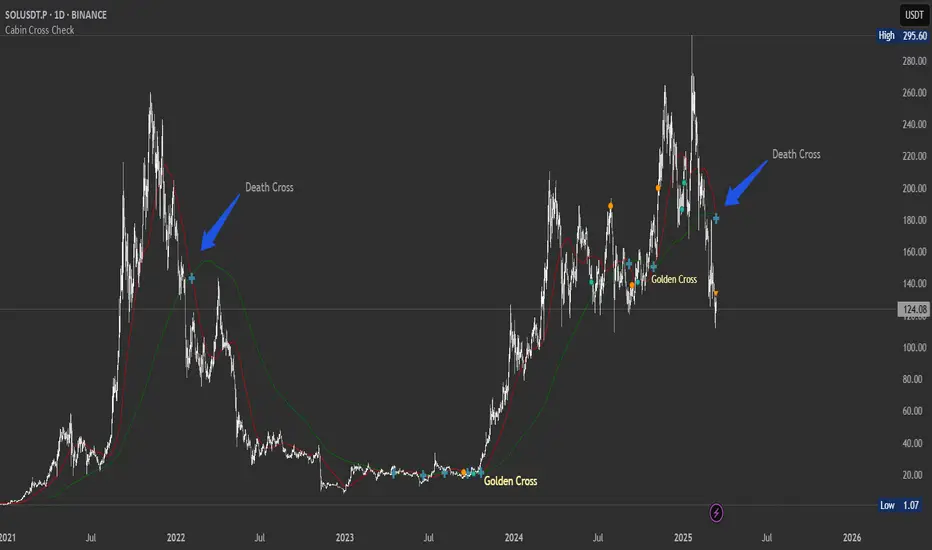
Detailed : Solana Death Cross on Daily TFSolana is on the verge of forming a Death Cross on the daily timeframe, with the 50-day moving average (MA) set to cross below the 200-day MA in the next day or two. This technical event is often seen as a bearish signal, indicating potential downside movement.
Key Observations on Solana’s Upcoming Death Cross
Historical Context
The last major Death Cross on Solana occurred in early 2022, leading to an extended two-year bearish phase with SOL dropping from its highs.
However, past performance does not guarantee a similar outcome, especially considering different market conditions.
What Could Happen Next?
If Solana confirms the Death Cross, it may see increased selling pressure, leading to a test of key support zones.
The broader crypto market sentiment and Bitcoin's movement will play a critical role in determining if this breakdown is sustained.
Critical Levels to Watch
Support Zones: $100, $85, and $65 if a deep correction occurs.
Resistance Areas: $140–$150, where bulls must regain control for recovery.
Could This Be a Fakeout?
If Solana stabilizes above key supports or sees sudden bullish catalysts (e.g., strong ecosystem growth, and institutional inflows), it could invalidate the bearish thesis.
Market-Wide Influence
If Bitcoin remains strong, altcoins like Solana might see limited downside.
A broader crypto correction, however, could accelerate the bearish breakdown.
Final Thoughts
While a Death Cross is a bearish signal, it doesn’t guarantee a prolonged downtrend. The next few days will be critical—watch for volume, support reactions, and overall market sentiment before making strong bearish bets.
Polkadot (DOT) at Critical Support – What’s Next?Polkadot (DOT) at Critical Support – What’s Next?
📉 DOT is trading near strong support at $3.80–$3.60. If this level holds, we could see an upward move.
⚠️ Risk of liquidity grab: Price may dip below support to liquidate high-leverage positions before bouncing.
💡 Buy Strategy: Consider small entries now and place buy orders between $2.50–$2.00 for long-term gains.
📈 Altseason Target: If DOT follows the market uptrend, it could reach $40–$50 in the next cycle.
🔎 Key Levels:
✅ Above $3.60 – Bullish move likely
❌ Below $3.60 – Possible stop hunts before reversal
Are you buying DOT at these levels? Let’s discuss! 👇
#Polkadot #DOT #Crypto

Death Cross on Solana Daily TFLooks scary. last time a proper death cross lasted 2 years.
Let me know your suggestions and ideas!
