Will SOLANA potentila to $1000?Many people are emotionally attached to Solana and the $1,000 target and that may be possible long term.
But markets never move straight up.
Corrections are part of every cycle, and CRYPTOCAP:SOL is currently in a correction phase.
If the $120 support breaks, I’m expecting SOL to drop below $100.
A move under $100 could offer a strong long-term accumulation opportunity.
My accumulation zone: $98 – $50
Long-term outlook: $500 – $1,000
Crypto is highly volatile and risky.
Always DYOR, manage risk properly, and this is not financial advice (NFA).
Solusdt

Solana Technical Reversal: MA Compression Resolves to the UpsideSolana is trading around 126 levels and there is a support which is being respected around 125 levels.
For last few weeks, no considerate candle is there. Only doji are being formed which shows the sideways moment in the charts.
If the market cycle changes, turning bullish, an entry can be made above 127 levels expecting a 10-11% movement in the crypto.
Major trend is bearish, Minor trend sideways.
The major support is around 100-110 level zone and there is not much of fall to capture as it has fallen 50% since Sept 2025.
On the hourly charts, there is a liquidity grab, taking out the bullish positions created on previous occassions.
A moving averages gate is also being created on the hourly charts as all the four EMAs (20, 50, 100 & 200) are moving in small range.
Now as per my view the market is trading in a range and it is also respecting a falling resistance line. A good R:R trade is there on the bullish side.
As per the plan, bullish position can be created in the assest once it crosses 127 levels.
Stop Loss :- 122.5
Target :- 144
R:R = 1:4
Multiple confluence there to enter the trade on the bullish side. Wait for the price action near the levels before entering the trade.

SOLUSD COMPLETE TRADING PLAN (BUY, SELL, NO-TRADE ZONES)PRICE IS CURRENTLY INSIDE A SUPPLY / SELL ZONE
The light-blue highlighted area is a strong supply zone between:
🔵 Supply Zone (Sell Zone)
146.00 – 149.00
Price has tapped this zone 3 times → weakness for buyers → sellers may take control.
🚫 NO-TRADE ZONE (RIGHT NOW)
The region where price is stuck is:
🚫 No-Trade Zone: 144.00 – 146.00
Reason:
Price is consolidating
Multiple rejections
Both bulls & bears fighting
Not safe for entering until breakout or rejection confirmation
🔥 SELL SETUP (High Probability)
This is the safest setup at the moment.
📍 SELL ENTRY
146.50 – 148.50 (inside the supply zone)
🛑 SL (Stoploss)
150.50
Above previous wick + above the zone.
🎯 TP (Targets)
1️⃣ 140.15
2️⃣ 136.12
3️⃣ 134.84 → strong demand
4️⃣ 130.56 → final target
This gives excellent RR (Reward–Risk).
🟢 BUY SETUP (Only After Breakout)
Don’t buy inside the zone.
Buy only if candles close above the zone.
📍 BUY ENTRY
Above 150.00 (Breakout + Retest)
🛑 SL
147.80
🎯 TP
1️⃣ 153.50
2️⃣ 157.20
3️⃣ 163.94
🟡 BUY SETUP (Pullback Buy)
If price drops to demand zone:
📍 BUY ENTRY ZONE
140.15 – 136.12
🛑 SL
134.00
🎯 TP
1️⃣ 144.00
2️⃣ 146.00
3️⃣ 148.00
📌 SUMMARY
🚫 NO TRADE:
144.00 – 146.00
🔥 SELL SETUP:
Entry: 146.50 – 148.50
SL: 150.50
TP: 140.15 → 136.12 → 134.84 → 130.56
🟢 BUY SETUP (Breakout Buy):
Entry: Above 150
SL: 147.80
TP: 153.50 → 157.20 → 163.94
🟢 BUY SETUP (Demand Buy):
Entry: 140.15 – 136.12
SL: 134
TP: 144 – 146 – 148

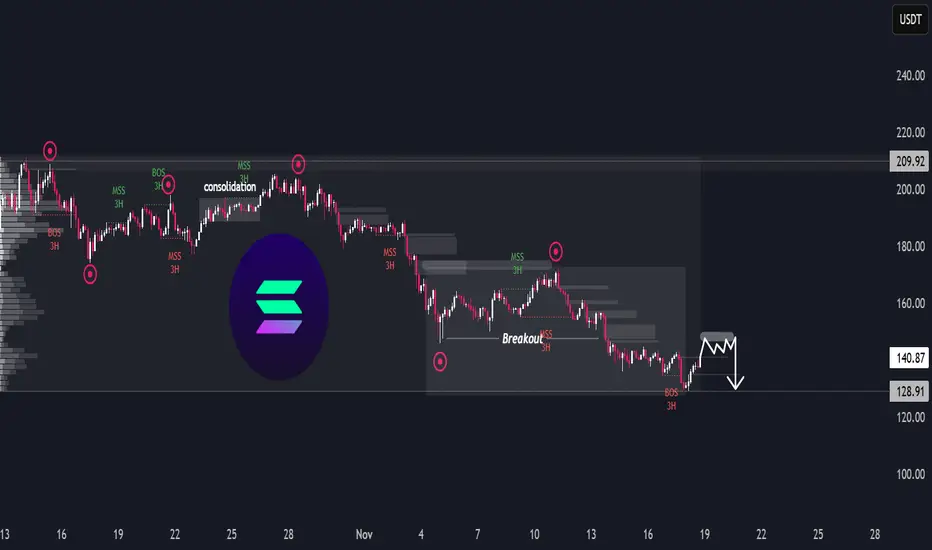
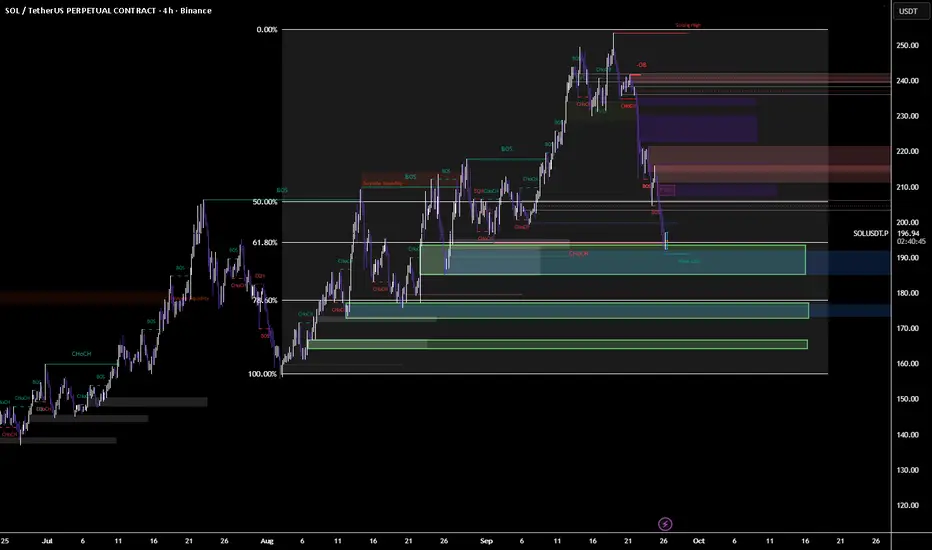
SOL/USDT – Downside LoadingSOL/USDT – Downside Loading
The chart shows a prolonged distribution phase followed by a steady macro decline, with multiple structure breaks confirming a persistent bearish flow. After the earlier consolidation in the upper range, each attempt to reclaim previous highs has been met with a shift in momentum, leading to progressive downside sequences.
The recent breakout from the lower range transitioned into continued weakness, indicating sellers remain in firm control. Despite short-term rebounds, the overall behaviour reflects a market that is unwinding previous demand zones rather than building new ones.
At the current level, SOL is forming a tight corrective pattern, suggesting price is building liquidity before the next directional move. Given the broader trend context, this type of compression typically precedes continuation rather than full reversal. The chart’s projection implies a potential liquidity sweep on the minor rally, followed by renewed downside pressure once short-term buyers are exhausted.
Overall, the environment still favours the bearish continuation scenario unless the market shows a decisive shift in character backed by sustained strength — something not yet present.
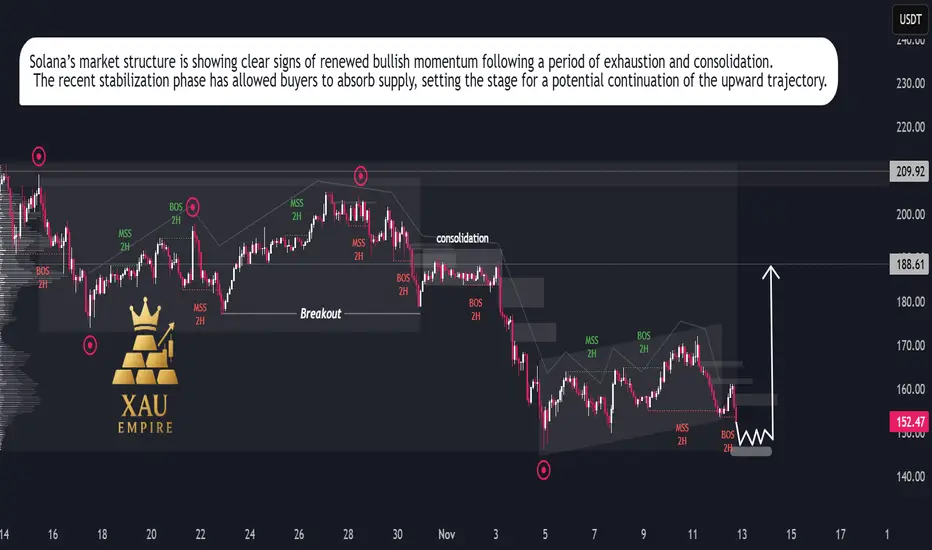
SOL/USDT – Bullish Momentum Rising, Rally Setup in ProgressSolana is showing renewed strength after an extended corrective phase, suggesting that the recent slowdown was a temporary reaccumulation rather than the start of a new downtrend. Price action has begun to stabilize, reflecting growing investor confidence and increasing participation from buyers at discounted levels.
Market flow indicates that selling pressure is fading, while buying volume has started to build up gradually. The recent structure reflects a healthy market rotation, where weaker hands are being replaced by strategic buyers positioning for the next expansion phase.
Momentum appears to be shifting in favor of the bulls, supported by consistent higher reactions after each dip and a clear compression pattern that often precedes strong directional movement. This behavior points toward a potential continuation of the broader uptrend, with expectations for renewed growth as market sentiment strengthens.
Overall, Solana’s current price behavior suggests the market is preparing for another bullish leg. As volatility contracts, the probability of an impulsive upside expansion increases, signaling that the next significant move is likely to unfold in favor of buyers.
Solana Price Action Turns BearishSolana’s market structure shows a gradual weakening of bullish momentum after an extended upward phase earlier in the month. The asset experienced a breakout that temporarily fueled optimism among traders, but recent sessions indicate a loss of strength as sellers began to dominate. The volume profile suggests that market participants are shifting focus from accumulation to potential distribution, reflecting caution ahead of broader market developments.
Price movements over the past few weeks show that Solana has transitioned from impulsive bullish waves into a corrective environment. This phase reflects uncertainty and potential repositioning by large holders. The consolidation seen mid-cycle indicates a period of balance before a directional move resumes. Current activity implies that short-term liquidity adjustments are occurring, and volatility may expand in the coming sessions.
Market sentiment remains sensitive, with investor confidence depending largely on macroeconomic flows and digital asset liquidity trends. Solana’s performance continues to mirror broader crypto risk appetite, where speculative behavior is being tempered by cautious profit-taking. If momentum continues to decline, extended corrective movement could unfold as participants await new catalysts.
Overall, the report indicates that Solana is entering a controlled phase of distribution where institutional participants may be preparing for another medium-term adjustment in valuation.

SOL/USDT (1H timeframe)...SOL/USDT (1H timeframe):
Here’s a clear technical breakdown 👇
🧭 Chart Overview:
Current price: around $200.40
Trend: Uptrend, but showing short-term pullback
Support area: $190 – $195
Resistance area: $205 – $210
🔍 Key Observations:
The ascending trendline is acting as dynamic support.
Price recently rejected near the $210 resistance zone and is pulling back toward the trendline and Ichimoku cloud.
The target points marked on my chart suggest downside retracements if support breaks.
---
🎯 Target Levels:
If price stays above the trendline/support → bullish continuation:
Target 1: $207
Target 2: $212
Target 3: $220 (major breakout target)
If price breaks below the trendline/cloud support → bearish correction:
Target 1: $195 (short-term support / first target point)
Target 2: $188 (lower target zone marked on chart)
Target 3: $180 (major downside target if correction deepens)
---
⚠ Summary:
📈 Bullish scenario: Hold above $198 → move to $207–$212.
📉 Bearish scenario: Break below $198 → drop to $195 → $188.

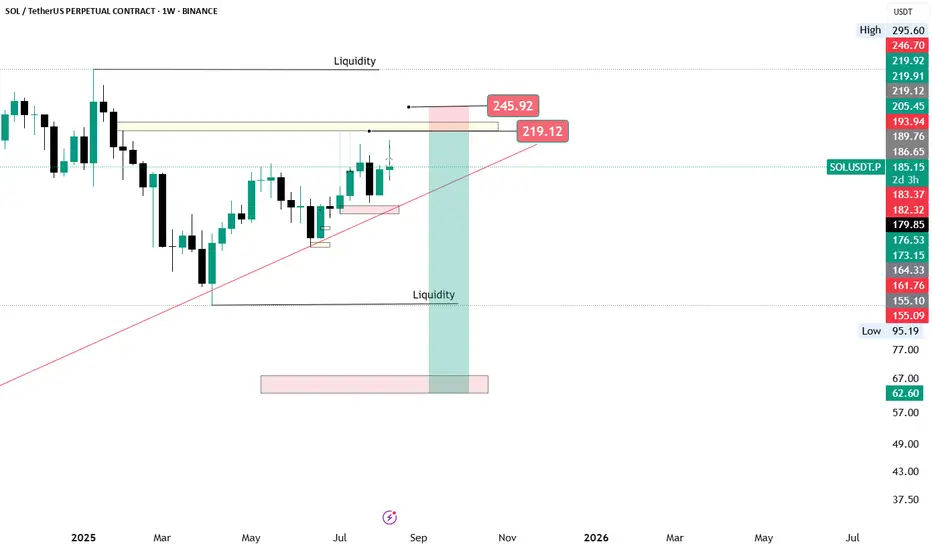
SOLANA 27,560% CYCLE IS ABOUT TO REPEAT - $9,200 TARGET BY 2029 SOLANA 27,560% CYCLE IS ABOUT TO REPEAT - $9,200 TARGET BY 2029
Previous Bull Cycle Metrics:
1️⃣ Duration: 1,492 days
2️⃣ % Gain: 27,560%
3️⃣ Price: $1 → $295
Now here's where it gets CRAZY...
IF we get a healthy retracement to the golden pocket ($60-$35), and IF the fractal repeats:
1️⃣ Bottom: $60-$35
2️⃣ Same % gain: 27,560%
3️⃣ Same timeframe: 1492 days (Feb 2029)
This is Wyckoff accumulation into parabolic expansion.
The risk/reward is GENERATIONAL
Bookmark this. Screenshot this. Thank me in 2029.
This is just my math based on past fractals & returns. Not financial advice - DYOR

SOLUSDT is for sell side in short termSOLUSDT if closed below 185.35 then only we can plan for sell side up to 182.35. We can book some qty at 184.35 as TGT 1 . After hitting TGT 1 we can trail SL to 185 and wait for 182.35

Solana Ready for Bullish ContinuationSolana demonstrates a constructive market posture with evidence of renewed accumulation following its recent corrective phase.Price activity indicates that buying momentum is gradually strengthening as liquidity continues to shift from weak hands into strategic positioning.The market structure shows improving stability,with compression patterns hinting at an impending expansion cycle.Sustained absorption near recent lows underscores growing institutional participation,reinforcing the probability of continued upward repricing.Trading volume remains consistent,reflecting controlled demand rather than speculative inflow.The overall market tone supports a constructive bias,with expectations aligning toward a progressive recovery phase and potential continuation of the broader bullish trajectory.

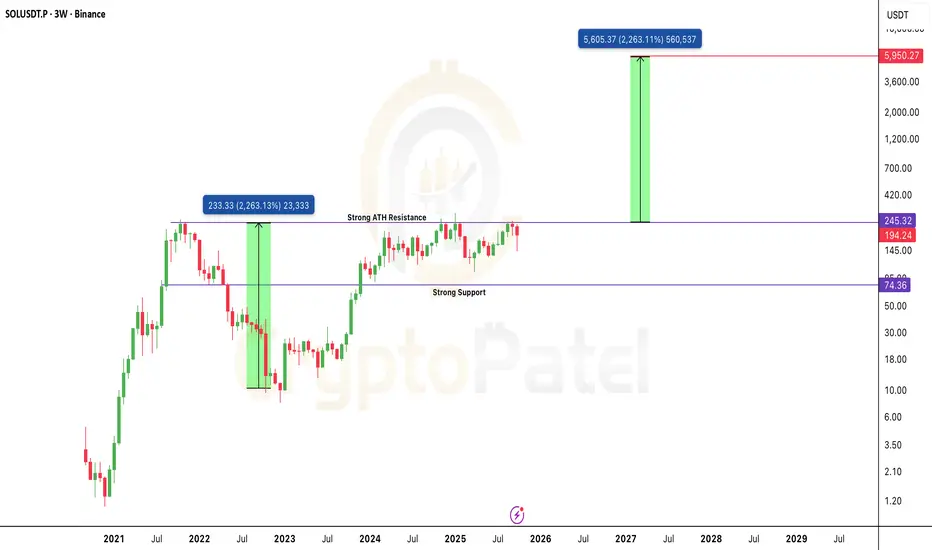
The Chart That Could Send $SOL to $6,000: Cup & Handle on 3W TFThe Chart That Could Send CRYPTOCAP:SOL to $6,000: Cup & Handle on 3W Timeframe
Solana is shaping one of the cleanest Cup & Handle patterns on the 3-Week chart, a formation that often signals the start of a massive long-term rally.
Technical Structure
🔹 Cup formed: $260 → $8 → back to $245 — a perfect rounded recovery base.
🔹 Handle forming: Price consolidating between $140–$245, building pressure before breakout.
🔹 Breakout trigger: Clean close above $245 (ATH zone) will confirm the move.
🔹 Targets:
– First target: $480–$500
– Extended target: $2,000–$6,000 if momentum mirrors the last 2200% run.
🔹 Major Support: $74–$90 zone.
What this really means: Solana is quietly preparing for its next macro expansion phase.
A confirmed breakout above ATH could kickstart one of the strongest alt rallies of this cycle.
Bias: Bullish on breakout confirmation
Timeframe: 3W / Long-Term Swing Setup
Plan: Watch $245 zone closely, breakout with volume = game on.
Note: NFA & DYOR
SOL | Network Strength Meets Market MomentumSolana (SOLUSDT) continues to show resilience as both technical and fundamental factors align for potential upside. On the technical side, the market has completed a controlled correction phase, suggesting liquidity buildup below recent lows. The structure remains bullish, with increasing volume and price stability hinting that buyers are regaining control. Fundamentally, Solana’s network growth and strong developer activity have reinforced investor confidence, supported by rising on-chain activity and ecosystem expansion in DeFi and NFTs. This combination of solid fundamentals and technical structure indicates the possibility of another bullish leg, with SOL positioning itself for a gradual climb toward the $240–$250 range in the near term.

SOL Ready TO Ignite from Demand - Eyeing $240 Supply “SOL Ready to Ignite from Demand – Eyeing $240 Supply”
📌 Description:
Solana swept liquidity into the $192–195 demand zone and is showing signs of strength. As long as $185 holds, bulls may drive price into the $210–240 supply zones. First target sits at $210 (FVG close), with higher objectives at $225 and $240. If demand fails, watch for a rejection short from $210.
Long Setup (Buy Idea)
Entry Zone: $192 – $195 (current demand + weak low + 61.8 retracement support)
Stop Loss (SL): $185 (below demand zone + liquidity sweep area)
Take Profit (TP):
TP1: $210 (FVG imbalance zone)
TP2: $225 (OB resistance zone)
TP3: $240 (supply zone / strong high)
⚖️ Risk–Reward: Around 1:3 to 1:4 if TP2 or TP3 hits.
🔴 Short Setup (Sell Idea, only if rejection occurs)
Entry Zone: $210 – $215 (FVG imbalance / supply)
Stop Loss (SL): $222 (above imbalance zone)
Take Profit (TP):
TP1: $195 (back to current demand)
TP2: $180 (major demand below)
⚖️ Risk–Reward: Around 1:2 to 1:3.
📌 Bias: Currently, price tapped demand and bounced — so long setup looks stronger unless $185 breaks.
Solana Price Forecast | SOLUSDT Market OutlookSOLUSDT has completed a strong upward cycle and is now unwinding through a structured retracement. This phase is not showing disorderly selling but rather a controlled reset, where liquidity is being cleared to prepare for the next expansion.
The chart reflects a market that is cycling through accumulation, breakout, and pullback phases with consistency. Current downside movement is shaping a foundation zone that could serve as the springboard for renewed upward momentum.
Overall, the asset is displaying a constructive trajectory: corrections are functioning as fuel rather than weakness, pointing toward continuation of its broader growth path once this reset stabilizes.

Solana: The Scam or the Breakthrough? | PipGuardSolana: The Scam or the Breakthrough?
Hello there, my colleagues, welcome back!
Article published by PipGuard™ on the TradingView® platform – to continue this free publication, LEAVE A BOOST and a COMMENT, hit the notification bell, and never miss ANOTHER ANALYSIS.
ANALYSIS
Hello everyone,
I know many of you appreciate my analyses, and I thank you for the support. As you know, I spend most of my time on the charts, looking for the best trading opportunities. To avoid missing updates, I recommend you turn on notifications!
Solana, with its ambiguous name, raises a question. Is it the “scam” that will ruin you or the “breakthrough” that will make you take the great leap? Regardless of preferences, what matters is the profit potential.
The Trend to Watch
Solana's dominant trend is clearly bullish. Our focus must remain on growth, but without underestimating possible downside scenarios.
Currently, the price is going through a bullish accumulation phase. There's liquidity to be filled, and we need to keep an eye on two critical levels very close to $210 . This is our support and resistance zone.
Below $210, the risk of a downward correction increases.
Above $210, the bullish trend strengthens.
A possible retracement could push the price into the $175-$160 zone. Here, the market will decide whether to continue falling or resume its upward run.
If Solana breaks above $210 without a retracement, the bullish target remains the $260 zone.
In short, the key levels:
Bullish target: $260
Bearish target: $175-$160
Support/Resistance zone: $210
NEWS
✅ Galaxy Digital, Multicoin, and Jump Crypto are aiming for a $1 billion treasury in Solana, the largest ever seen in the sector.
✅ Sharps Technology soars 70% after raising $400 million for a treasury entirely in Solana, featuring giants like Pantera and ParaFi.
SECRETS
🔓 The return of the Coinbase hacker: a wallet linked to the $300M mega-heist on Coinbase is back in action, buying 38,126 SOL ($8M) around $209.
🔓 The dark side of meme-tokens: on the Solana network, the Kanye West token burned $75M in a week, crashing by 80%. Those who believed in it are now left with worthless paper.
GREETINGS
Remember to leave a GREETING 🚀 or a COMMENT — not because I really need it, but because it's cool to support the one who brings you these bombshells while you're having your coffee.
Talk to you soon,
PipGuard
Article published by PipGuard™ on the TradingView® platform

Sol 1 Pending Market Crash so wait for thisSol 1 Pending Market Crash so wait for this
Sol 1 Pending Market Crash so wait for thisSol 1 Pending Market Crash so wait for thisSol 1 Pending Market Crash so wait for thisSol 1 Pending Market Crash so wait for thisSol 1 Pending Market Crash so wait for thisSol 1 Pending Market Crash so wait for thisSol 1 Pending Market Crash so wait for this
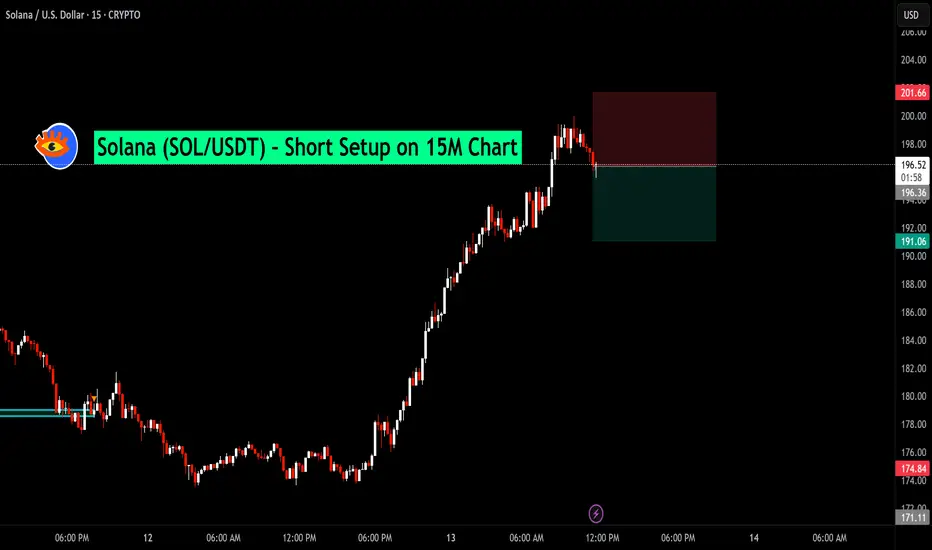
Solana (SOL/USDT) – Short Setup on 15M ChartAfter an extended bullish run, Solana is showing early signs of exhaustion near the $196–$197 zone. Price has failed to sustain above recent highs, forming a potential short-term reversal pattern.
📉 Trade Idea:
Entry: $196.40
Stop Loss: $201.66 (Above recent swing high)
Target: $191.06 (Support zone from prior consolidation)
This setup aims to capture a pullback move following a strong rally, with a favorable risk-to-reward ratio.
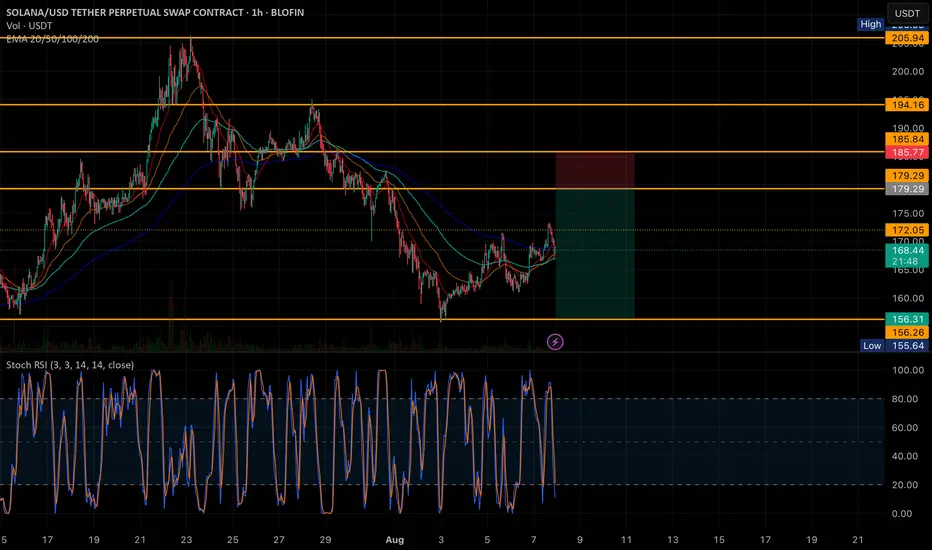
Sol short chartExpecting some upside move on Sol if holds this level.
But Sol need to break first 172 level
I will dca this trade from 172
SOL/USDT 1H Chart Analysis – Bullish Reversal Targeting Resistan🚀 SOL/USDT 1H Chart Analysis – Bullish Reversal Targeting Resistance Zone 🎯
📊 Pair: SOL/USDT
🕐 Timeframe: 1H
📈 Platform: Binance
🔍 Technical Overview:
🔵 Support Zone (145.00 – 147.50 USDT)
Price has bounced multiple times from this strong demand zone marked in light blue.
Recent price action shows buyers defending this level aggressively — potential accumulation area. ✅
🔴 Resistance Zone (159.50 – 162.00 USDT)
Marked in red, this zone has historically rejected price twice (confirmed by red & yellow arrows).
Currently, the market is expected to retest this supply area once again. ⚠️
📈 Bullish Pathway:
Current structure suggests a reversal from support, aiming for:
TP1: $150.46
TP2: $154.31
TP3 / Final Target: $160.89 (within resistance)
🔄 Trend Structure:
Price is forming higher lows, hinting at early reversal stages.
Break above $150.46 would confirm bullish momentum. 🟢
🧠 Conclusion:
SOL/USDT is setting up for a bullish reversal from a strong support zone, with targets aligned toward previous resistance. Traders should monitor the reaction at $150.46 and $154.31 — a clean break may propel price to $160.89.
📌 Watch for:
Confirmation candle at support zone
Break and retest patterns on intraday resistance levels
📉 Support: 145.00 – 147.50
📈 Resistance: 159.50 – 162.00
🎯 Bullish Targets: 150.46 → 154.31 → 160.89
🔔 Stay updated, manage risk, and trade wisely! 💹📈

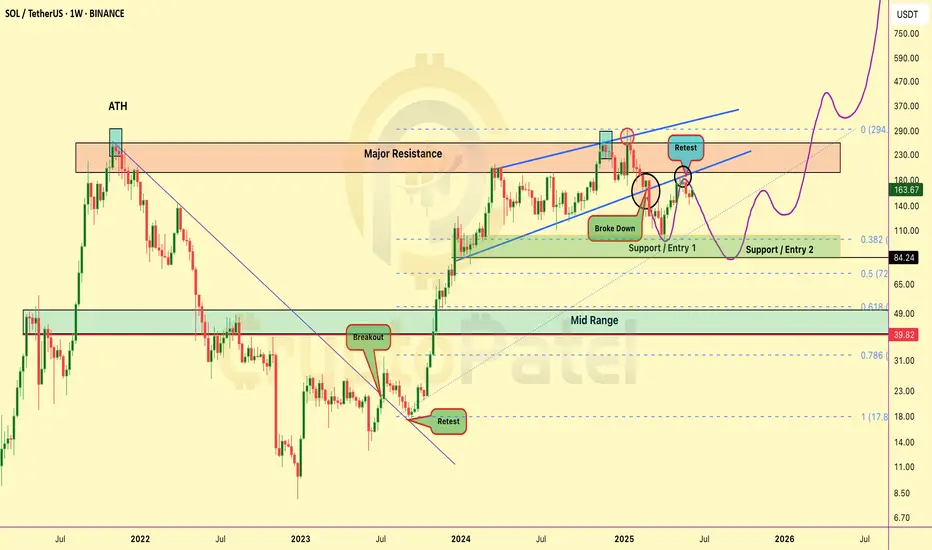
Is $SOL about to DUMP… or set up a MASSIVE BUY ZONE?Is CRYPTOCAP:SOL about to DUMP… or set up a MASSIVE BUY ZONE?
Solana is now at a critical level on the higher timeframe chart:
✅ After a breakdown, SOL is now retesting the bearish retest zone
✅ Strong resistance seen at $170–$180
✅ If rejected → price could dip toward the $100 range
But here’s the key: A dip to $100 would be a massive long-term buying opportunity for many investors (including me).
Long-term targets? I’m still eyeing $500 → $1000 if the macro trend plays out.
👉 Keep a close eye — the next few weeks could set up the next big move for $SOL.
Are you ready? Will you be buying the dip? Comment below! 👇
NFA & DYOR
MY ANALYSIS IS HITTING THE TARGET! WHAT A CATCHING VIEW!🎯🔥 MY ANALYSIS IS HITTING THE TARGET! WHAT A CATCHING VIEW! 🔥🎯
✨📈 Everything is playing out as I expected – let’s keep riding this wave! 🌊💹
🚀 SOL/USDT Analysis Update 🚀
📅 Date: June 11, 2025
📊 Timeframe: 4H
✅ Key Zones & Levels:
🟢 Support Level Zone: 144.00 – 147.24
🔴 Resistance Level Zone: 184.00 – 187.99
⚠️ Mini Support/Resistance: Around 160.00
🎯 Current Price Action:
The price has respected my previously marked Support Zone (🟢), resulting in a strong rebound. After forming a bottom at the support level (marked with green arrows), SOL/USDT is now on an impressive upward move.
🟡 The current upward momentum is targeting the Resistance Level Zone near 187.99.
💡 Expected Movement:
If the price approaches the Resistance Zone (🔴), a reversal may occur, creating a potential short-term sell opportunity. Conversely, if it breaks above, we might see further bullish momentum.
🟦 Potential Path:
🔁 Expect a retest of the resistance zone → Possible rejection → Revisit the mini support (~160.00) before a decisive move either back to support or a breakout above 187.99.
💪 Key Takeaways:
Support Zone held strongly, confirming my analysis.
Mini Support/Resistance acts as a pivot for short-term reactions.
Watch closely as the price nears the Resistance Zone – this will be a key area for possible reversals or breakouts.
🔥 Let’s keep an eye on the next moves! Your feedback and thoughts are always welcome. Happy trading! 💪📈

SOL/USDT 4H Chart Analysis📊 SOL/USDT 4H Chart Analysis
🟢 Key Zones:
🔴 Resistance Level Zone:
Marked at approximately 185–188 USDT
Multiple rejections in this area (red arrows 📉), confirming it as a significant supply zone.
🟩 Support Level Zone:
Found around 140–147 USDT
Price has previously bounced off this zone (green arrows 📈), indicating strong demand.
⚖️ Mini Levels:
🟡 Mini Support/Resistance:
Around 157 USDT, previously acted as both support and resistance (yellow box).
Price reacts to this zone during its downtrend and uptrend, highlighting its significance.
🔮 Current Price Action:
The price is currently at 153.36 USDT.
The recent low was just above 140 USDT, confirming a higher low formation.
A small pullback is visible after testing the support zone.
📝 Trade Outlook & Scenarios:
🔵 Bullish Scenario (Main Bias):
If the price maintains above the support zone (140–147 USDT) and breaks the mini resistance (~157 USDT):
Possible continuation towards the resistance zone (185–188 USDT).
Target 🎯 at 187.99 USDT (highlighted in the yellow zone).
🔴 Bearish Scenario:
If the price breaks below the 140 USDT support:
Downward continuation to 132 USDT or lower, as shown in the chart (red zone).
🔧 Risk Management:
🛑 Stop Loss:
Conservative traders: below 140 USDT (red zone 🚨).
Aggressive traders: below the last swing low (~144 USDT).
💡 Professional Takeaway:
✅ Support and resistance zones are well-defined.
✅ Current bounce from support zone suggests a possible reversal.
✅ A break and close above the mini-resistance at 157 USDT would confirm strength.
✅ Risk management and patience are key for this potential upside move.

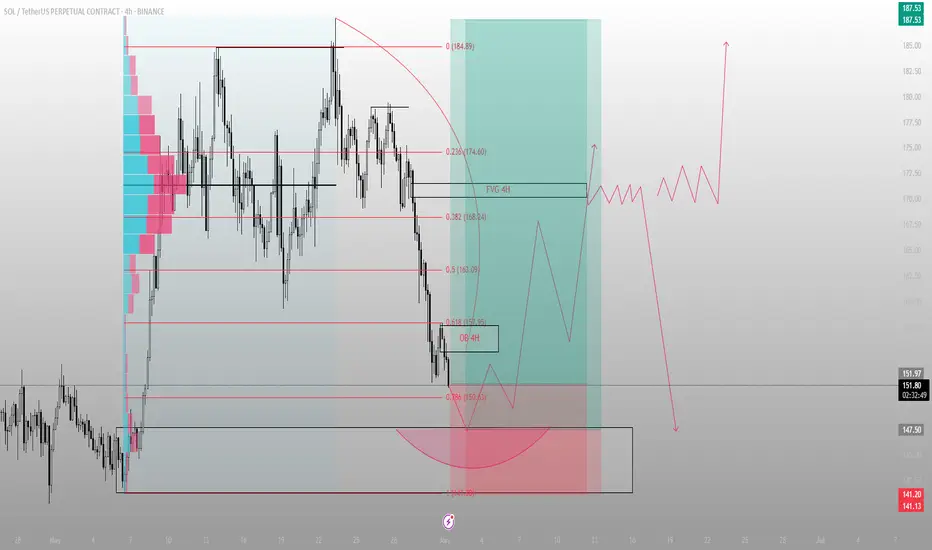
Liquidity tagged. Sentiment shaken. Now the real move begins.SOL just kissed the 0.786 retracement at 150.6 — and did so with precision, not hesitation.
Below that sits a 4H OB that hasn’t been touched since the impulse leg began. That zone, now swept, resets the auction. We’ve completed the delivery cycle down, and Smart Money is reloading while the herd panics.
The rejection from this OB aligns with a thin LVN pocket — a classic bounce zone for engineered reaccumulation. From here, I’m watching for expansion into the inefficiency above: the 4H FVG at 174.6. That’s the draw.
Structure shows that the 163–168 zone (0.5 to 0.382) will act as a decision shelf. If price respects that as a new support, this entire move becomes the foundation for a higher macro expansion into 185+.
If we fail? The resting liquidity at 141 is still untouched.
Execution bias:
🟩 Bid zone: 150.6–147.5 (OB + 0.786)
🎯 Target 1: 163.09
🎯 Target 2: 174.6 (4H FVG)
❌ Invalidation: Full body breakdown below 141.13
This isn’t about catching a bounce.
It’s about understanding where Smart Money needs to rebalance.
I don’t trade candles. I trade consequences.